. 2014 Jun 27:3:e02851.
doi: 10.7554/eLife.02851.

Global distribution maps of the leishmaniases

Affiliations

Global distribution maps of the leishmaniases

David M Pigott et al. Elife. .

Abstract

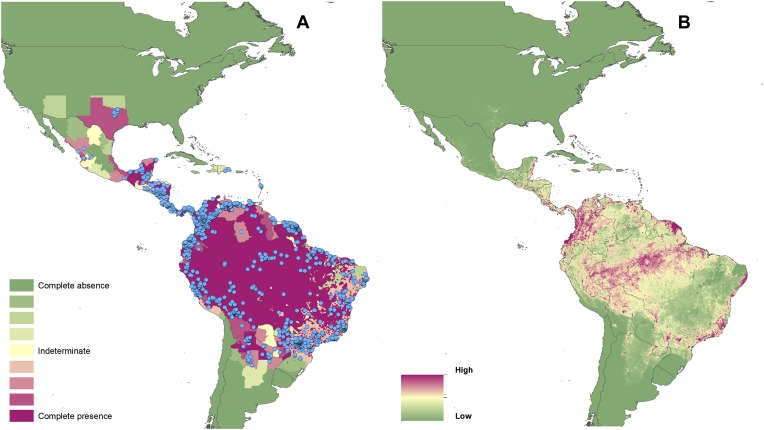
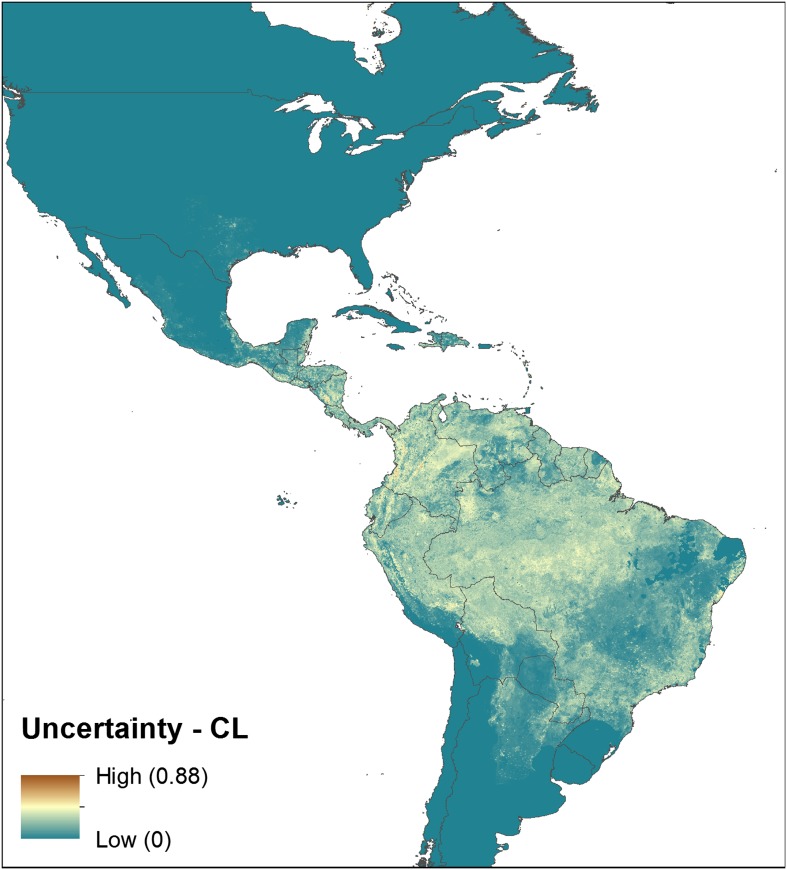
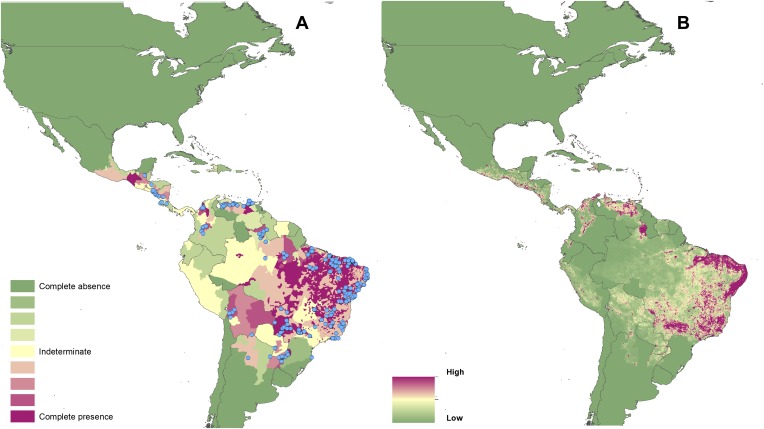
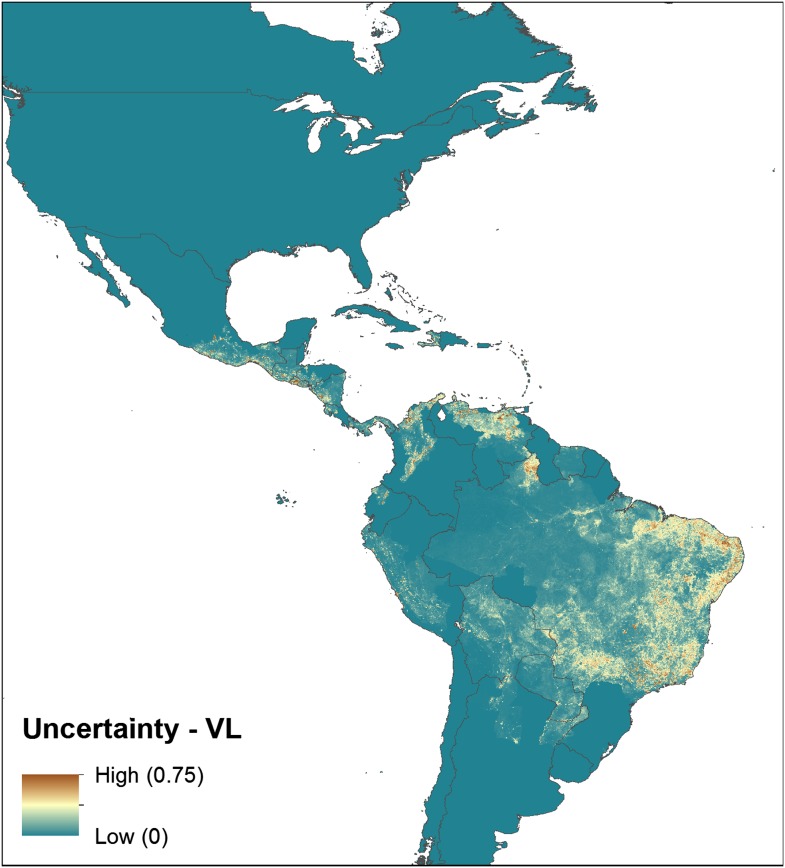
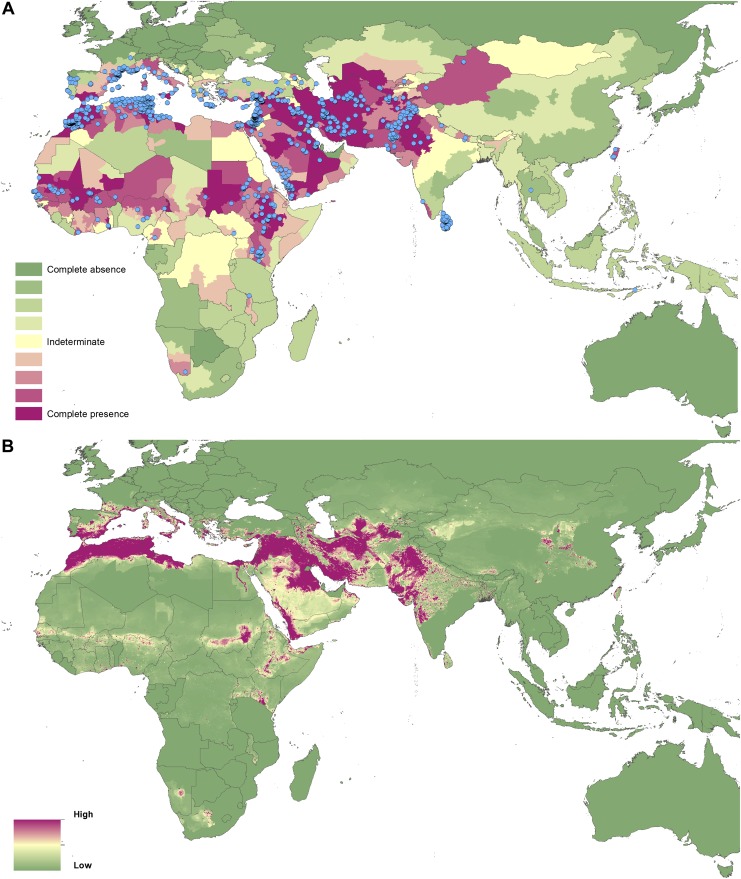
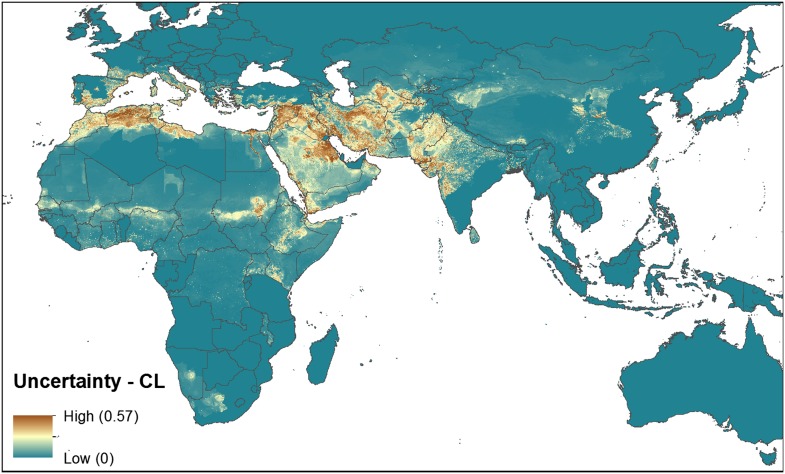
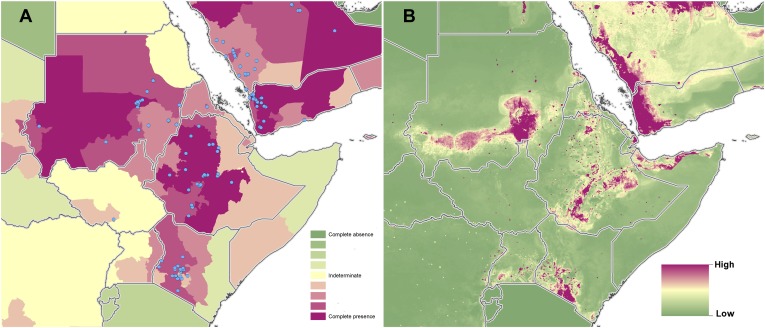
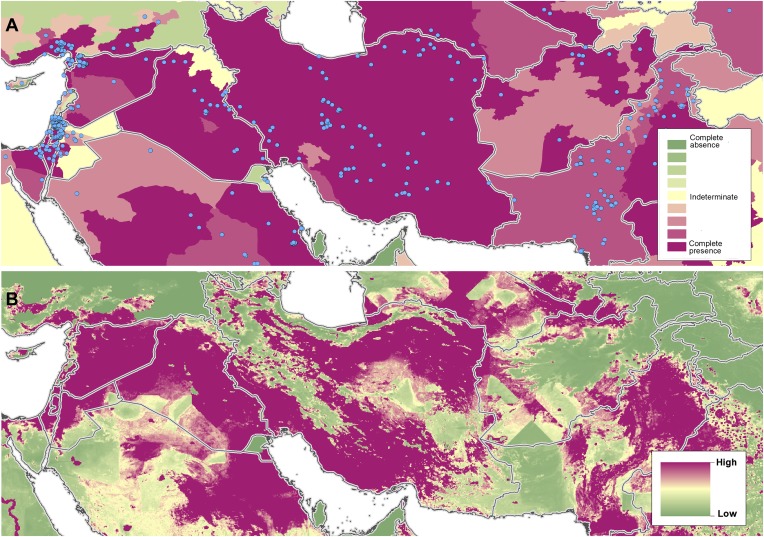
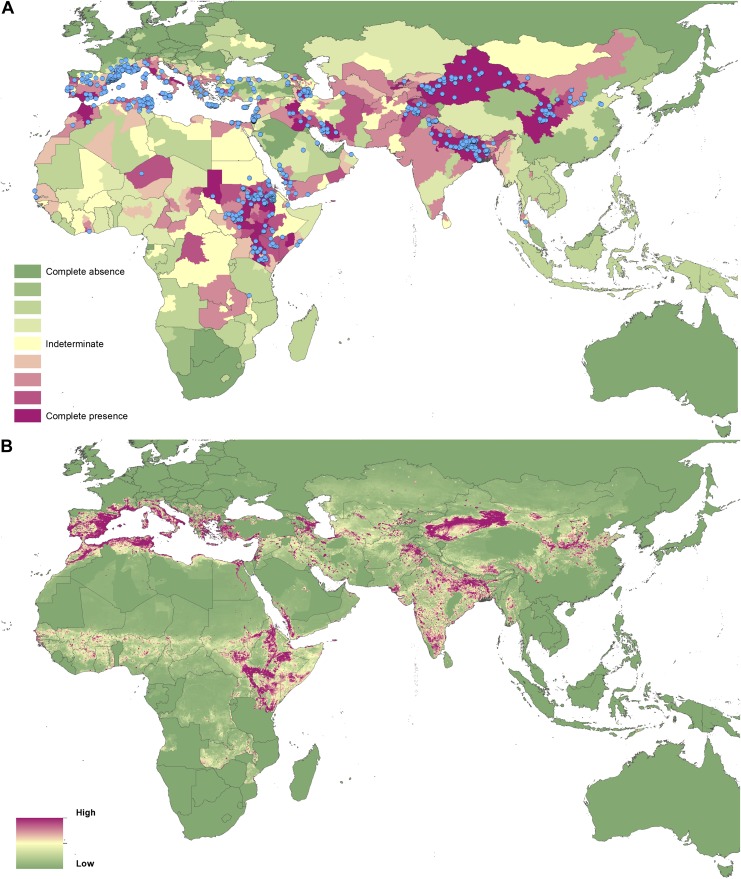
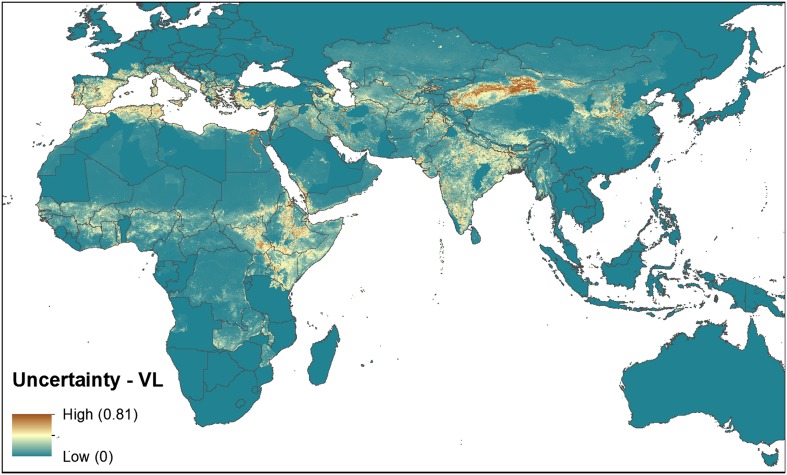
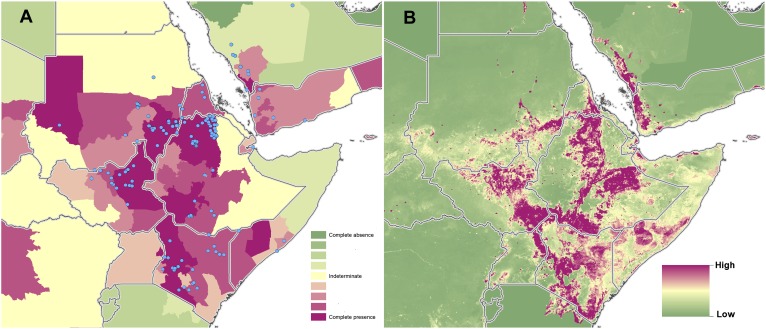
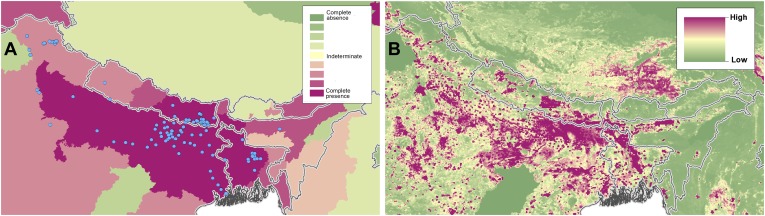
The leishmaniases are vector-borne diseases that have a broad global distribution throughout much of the Americas, Africa, and Asia. Despite representing a significant public health burden, our understanding of the global distribution of the leishmaniases remains vague, reliant upon expert opinion and limited to poor spatial resolution. A global assessment of the consensus of evidence for leishmaniasis was performed at a sub-national level by aggregating information from a variety of sources. A database of records of cutaneous and visceral leishmaniasis occurrence was compiled from published literature, online reports, strain archives, and GenBank accessions. These, with a suite of biologically relevant environmental covariates, were used in a boosted regression tree modelling framework to generate global environmental risk maps for the leishmaniases. These high-resolution evidence-based maps can help direct future surveillance activities, identify areas to target for disease control and inform future burden estimation efforts.

Keywords: boosted regression trees; cutaneous leishmaniasis; epidemiology; global health; human; infectious disease; leishmania; microbiology; niche based modelling; species distribution modelling; visceral leishmaniasis.


Conflict of interest statement

The authors declare that no competing interests exist.

Figures

Figure 1.
Figure 1.. Reported and predicted distribution of cutaneous leishmaniasis in the New World.
(A) Evidence consensus for presence of the disease ranging from green (complete consensus on the absence: −100%) to purple (complete consensus on the presence of disease: +100%). The blue spots indicate occurrence points or centroids of occurrences within small polygons. (B) Predicted risk of cutaneous leishmaniasis from green (low probability of presence) to purple (high probability of presence). DOI: http://dx.doi.org/10.7554/eLife.02851.003
Figure 1—figure supplement 1.
Figure 1—figure supplement 1.. Uncertainty associated with predictions in Figure 1B.
Uncertainty was calculated as the range of the 95% confidence interval in predicted probability of occurrence for each pixel. Regions of highest uncertainty are in dark brown, with blue representing low uncertainty. DOI: http://dx.doi.org/10.7554/eLife.02851.004
Figure 2.
Figure 2.. Reported and predicted distribution of visceral leishmaniasis in the New World.
(A) Evidence consensus for presence of the disease ranging from green (complete consensus on the absence: −100%) to purple (complete consensus on the presence of disease: +100%). The blue spots indicate occurrence points or centroids of occurrences within small polygons. (B) Predicted risk of visceral leishmaniasis from green (low probability of presence) to purple (high probability of presence). DOI: http://dx.doi.org/10.7554/eLife.02851.005
Figure 2—figure supplement 1.
Figure 2—figure supplement 1.. Uncertainty associated with predictions in Figure 2B.
Uncertainty was calculated as the range of the 95% confidence interval in predicted probability of occurrence for each pixel. Regions of highest uncertainty are in dark brown, with blue representing low uncertainty. DOI: http://dx.doi.org/10.7554/eLife.02851.006
Figure 3.
Figure 3.. Reported and predicted distribution of cutaneous leishmaniasis in the Old World.
(A) Evidence consensus for presence of the disease ranging from green (complete consensus on the absence: −100%) to purple (complete consensus on the presence of disease: +100%). The blue spots indicate occurrence points or centroids of occurrences within small polygons. (B) Predicted risk of cutaneous leishmaniasis from green (low probability of presence) to purple (high probability of presence). DOI: http://dx.doi.org/10.7554/eLife.02851.007
Figure 3—figure supplement 1.
Figure 3—figure supplement 1.. Uncertainty associated with predictions in Figure 3B.
Uncertainty was calculated as the range of the 95% confidence interval in predicted probability of occurrence for each pixel. Regions of highest uncertainty are in dark brown, with blue representing low uncertainty. DOI: http://dx.doi.org/10.7554/eLife.02851.008
Figure 3—figure supplement 2.
Figure 3—figure supplement 2.. Reported and predicted distribution of cutaneous leishmaniasis in northeast Africa.
(A) Evidence consensus for presence of the disease ranging from green (complete consensus on the absence: −100%) to purple (complete consensus on the presence of disease: +100%). The blue spots indicate occurrence points or centroids of occurrences within small polygons. (B) Predicted risk of cutaneous leishmaniasis from green (low probability of presence) to purple (high probability of presence). DOI: http://dx.doi.org/10.7554/eLife.02851.009
Figure 3—figure supplement 3.
Figure 3—figure supplement 3.. Reported and predicted distribution of cutaneous leishmaniasis across the Near East, including Syria, Iran and Afghanistan.
(A) Evidence consensus for presence of the disease ranging from green (complete consensus on the absence: −100%) to purple (complete consensus on the presence of disease: +100%). The blue spots indicate occurrence points or centroids of occurrences within small polygons. (B) Predicted risk of cutaneous leishmaniasis from green (low probability of presence) to purple (high probability of presence). DOI: http://dx.doi.org/10.7554/eLife.02851.010
Figure 4.
Figure 4.. Reported and predicted distribution of visceral leishmaniasis in the Old World.
(A) Evidence consensus for presence of the disease ranging from green (complete consensus on the absence: −100%) to purple (complete consensus on the presence of disease: +100%). The blue spots indicate occurrence points or centroids of occurrences within small polygons. (B) Predicted risk of visceral leishmaniasis from green (low probability of presence) to purple (high probability of presence). DOI: http://dx.doi.org/10.7554/eLife.02851.011
Figure 4—figure supplement 1.
Figure 4—figure supplement 1.. Uncertainty associated with predictions in Figure 4B.
Uncertainty was calculated as the range of the 95% confidence interval in predicted probability of occurrence for each pixel. Regions of highest uncertainty are in dark brown, with blue representing low uncertainty. DOI: http://dx.doi.org/10.7554/eLife.02851.012
Figure 4—figure supplement 2.
Figure 4—figure supplement 2.. Reported and predicted distribution of visceral leishmaniasis in northeast Africa.
(A) Evidence consensus for presence of the disease ranging from green (complete consensus on the absence: −100%) to purple (complete consensus on the presence of disease: +100%). The blue spots indicate occurrence points or centroids of occurrences within small polygons. (B) Predicted risk of visceral leishmaniasis from green (low probability of presence) to purple (high probability of presence). DOI: http://dx.doi.org/10.7554/eLife.02851.013
Figure 4—figure supplement 3.
Figure 4—figure supplement 3.. Reported and predicted distribution of visceral leishmaniasis in the Indian subcontinent.
(A) Evidence consensus for presence of the disease ranging from green (complete consensus on the absence: −100%) to purple (complete consensus on the presence of disease: +100%). The blue spots indicate occurrence points or centroids of occurrences within small polygons. (B) Predicted risk of visceral leishmaniasis from green (low probability of presence) to purple (high probability of presence). DOI: http://dx.doi.org/10.7554/eLife.02851.014
Figure 4—figure supplement 4.
Figure 4—figure supplement 4.. Population at risk estimates for leishmaniasis.
Four scatterplots showing the relationship between non-zero estimated mean annual incidence (Alvar et al., 2012) and estimated population at risk derived from the cartographic approach for (A) New World cutaneous leishmaniasis, (B) New World visceral leishmaniasis, (C) Old World cutaneous leishmaniasis, and (D) Old World visceral leishmaniasis. For each country the bars represent the annual incidence estimate range. DOI: http://dx.doi.org/10.7554/eLife.02851.015

References

    1. Alvar J Velez ID Bern C Herrero M Desjeux P Cano J Jannin J den Boer M, WHO Leishmaniasis Control Team . 2012. Leishmaniasis worldwide and global estimates of its incidence. PLOS ONE 7:e35671. doi: 10.1371/journal.pone.0035671 - DOI - PMC - PubMed
    1. Ashford RW. 1996. Leishmaniasis reservoirs and their significance in control. Clinics in Dermatology 14:523–532. doi: 10.1016/0738-081x(96)00041-7 - DOI - PubMed
    1. Balk DL, Deichmann U, Yetman G, Pozzi F, Hay SI, Nelson A. 2006. Determining global population distribution: methods, applications and data. Advances in Parasitology 62:119–156. doi: 10.1016/S0065-308X(05)62004-0 - DOI - PMC - PubMed
    1. Banuls AL, Bastien P, Pomares C, Arevalo J, Fisa R, Hide M. 2011. Clinical pleiomorphism in human leishmaniases, with special mention of asymptomatic infection. Clinical Microbiology and Infection 17:1451–1461. doi: 10.1111/j.1469-0691.2011.03640.x - DOI - PubMed
    1. Barbet-Massin M, Jiguet F, Albert CH, Thuiller W. 2012. Selecting pseudo-absences for species distribution models: how, where and how many? Methods in Ecology and Evolution 3:327–338. doi: 10.1111/j.2041-210X.2011.00172.x - DOI

Publication types