. 2014 Aug;42(14):e115.
doi: 10.1093/nar/gku537. Epub 2014 Jun 27.

Full-length haplotype reconstruction to infer the structure of heterogeneous virus populations

Affiliations

Full-length haplotype reconstruction to infer the structure of heterogeneous virus populations

Francesca Di Giallonardo et al. Nucleic Acids Res. 2014 Aug.

Abstract

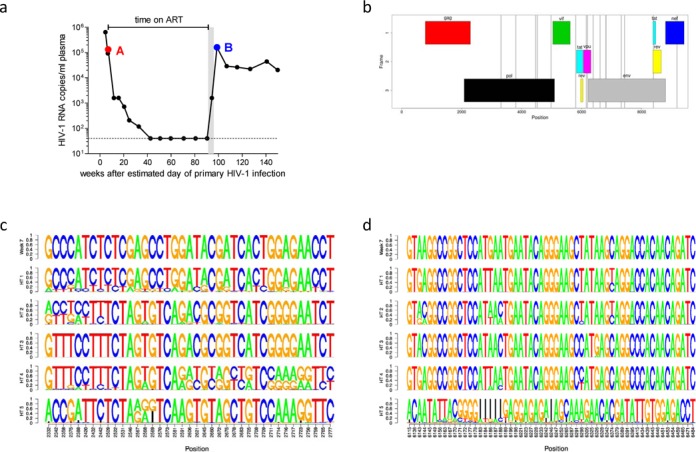
Next-generation sequencing (NGS) technologies enable new insights into the diversity of virus populations within their hosts. Diversity estimation is currently restricted to single-nucleotide variants or to local fragments of no more than a few hundred nucleotides defined by the length of sequence reads. To study complex heterogeneous virus populations comprehensively, novel methods are required that allow for complete reconstruction of the individual viral haplotypes. Here, we show that assembly of whole viral genomes of ∼8600 nucleotides length is feasible from mixtures of heterogeneous HIV-1 strains derived from defined combinations of cloned virus strains and from clinical samples of an HIV-1 superinfected individual. Haplotype reconstruction was achieved using optimized experimental protocols and computational methods for amplification, sequencing and assembly. We comparatively assessed the performance of the three NGS platforms 454 Life Sciences/Roche, Illumina and Pacific Biosciences for this task. Our results prove and delineate the feasibility of NGS-based full-length viral haplotype reconstruction and provide new tools for studying evolution and pathogenesis of viruses.


Figures

Figure 1.
Figure 1.
HIV-1 full-length genome sequencing using three different NGS technologies. (A) Experimental protocol. Five HIV-1 full-length plasmids were transfected into 293T cells to generate five different virus stocks. These clones were mixed in a large batch and aliquoted. RNA was isolated and amplified with three different protocols. DNA libraries were sequenced with either 454/Roche, Illumina or PacBio. (B) Coverage in overlapping reads per base pair. The map of the HIV-1 genome is shown on the top, with each subsequently analyzed gene indicated. The position numbering refers to the HIV-1HXB2 genome (GenBank accession number K03455). Amplicon layout is visualized for each NGS platform with individual numbering (Supplementary Table S1). (C) Read length distribution of each NGS technology, after preprocessing and alignment.
Figure 2.
Figure 2.
SNV calling based only on the alignment (naïve) versus haplotype reconstruction. (A) Distribution of SNVs across the full-length HIV-1 coding region compared to the ground truths for each NGS platform, on top shown as directly obtained from the alignment and on the bottom after gene-wise haplotype reconstruction. A SNV is called from the alignment, when its relative occurrence is higher than 1%, except for the deletions within the PacBio data, where a threshold of 5% was applied. SNVs from inferred haplotypes are called if found in at least one reconstructed haplotype. False positive SNVs and false negative SNVs are represented as upward and downward pointing bars, respectively. Bars are color coded for the four different nucleotides and the gap-symbol, bars may stack for multiple false calls at a single position, and false positives and false negatives may occur at the same position. (B) Co-occurrence of false positive and false negative SNVs among NGS platforms shown as Venn diagrams, with and without gene-wise haplotype reconstruction.
Figure 3.
Figure 3.
Gene-wise haplotype reconstruction. Haplotypes were reconstructed for the genes p17, p24, p2-p6 (functional regions in gag), PR, RT, RNase, Int (pol, polymerase), gp120, gp41 (env, envelope) and the accessory genes vif, vpr, vpu and nef using QuasiRecomb. The five distinct HIV-1 strains are color coded and their frequencies in each region are shown for each NGS platform. The length of each region is denoted in base pairs at the bottom of each column together with the genetic distances of the five HIV-1 variants against each other in the corresponding regions. A number instead of a symbol indicates the Hamming distance of the reconstructed haplotype to its closest match in the ground truth.
Figure 4.
Figure 4.
Global haplotype reconstruction of the HIV-1 gag-pol genomic region and of full-length genomes. Estimated frequencies are shown for the HIV-1 gag-pol region and the full-length coding region for each data set and each computational method. Gray shaded areas represent haplotypes that did not pass quality control; white striped area shows reconstructed HIV-1HXB2 with a Hamming distance of nine. The white number in the QuasiRecomb result indicates the Hamming distance to the closest ground truth. For comparison, the mean gene-wise frequencies for each data set using QuasiRecomb and the frequencies of each virus strain detected by SGA of the protease gene in three independent experiments (20). Numbers of analyzed clones are given below each bar.
Figure 5.
Figure 5.
Global haplotype reconstruction of HIV-1 in an HIV-1 superinfected patient. (a) HIV-1 RNA load (black circles) and estimated time of superinfection (gray shaded area). Depicted are time points A (∼7 weeks after primary HIV-1 infection) and B (∼99 weeks after primary HIV-1 infection) that were chosen for HIV-1 full-length sequencing using the Illumina platform. Global haplotype reconstruction was performed using both computational methods, data obtained with the PredictHaplo model are depicted. The dotted line shows the detection limit of the viral load assay (40 HIV-1 RNA copies/ml plasma). (b) Mismatches between haplotype 1 (HT 1) to the haplotype from week 7 are shown as gray vertical lines within the HIV-1 gene map. (c and d) Sequence logo representation of all five reconstructed haplotypes (HT1 – HT 5) and the respective haplotype from week 7 in a window between position 2300 and 2800 (c) and between 6100 and 6500 (d). The frequency information in the sequence logos reflects the statistical properties of the PredictHaplo model, where haplotypes are represented as chains of probability tables over the four nucleotides plus gaps. Shown are only positions where at least one haplotype differs from the others.

Similar articles

Cited by

References

    1. Nowak M.A. What is a quasispecies? Trends Ecol. Evol. 1992;7:118–121. - PubMed
    1. Domingo E., Sheldon J., Perales C. Viral quasispecies evolution. Microbiol. Mol. Biol. Rev. 2012;76:159–216. - PMC - PubMed
    1. Metzker M.L. Sequencing technologies—the next generation. Nat. Rev. Genet. 2010;11:31–46. - PubMed
    1. Macalalad A.R., Zody M.C., Charlebois P., Lennon N.J., Newman R.M., Malboeuf C.M., Ryan E.M., Boutwell C.L., Power K.A., Brackney D.E., et al. Highly sensitive and specific detection of rare variants in mixed viral populations from massively parallel sequence data. PLoS Comput. Biol. 2012;8:e1002417. - PMC - PubMed
    1. Henn M.R., Boutwell C.L., Charlebois P., Lennon N.J., Power K.A., Macalalad A.R., Berlin A.M., Malboeuf C.M., Ryan E.M., Gnerre S., et al. Whole genome deep sequencing of HIV-1 reveals the impact of early minor variants upon immune recognition during acute infection. PLoS Pathog. 2012;8:e1002529. - PMC - PubMed

Publication types