. 2014 Aug 8;289(32):22090-102.
doi: 10.1074/jbc.M114.566927. Epub 2014 Jun 27.

Mitochondrial phosphoenolpyruvate carboxykinase (PEPCK-M) is a pro-survival, endoplasmic reticulum (ER) stress response gene involved in tumor cell adaptation to nutrient availability

Affiliations

Mitochondrial phosphoenolpyruvate carboxykinase (PEPCK-M) is a pro-survival, endoplasmic reticulum (ER) stress response gene involved in tumor cell adaptation to nutrient availability

Andrés Méndez-Lucas et al. J Biol Chem. .

Abstract

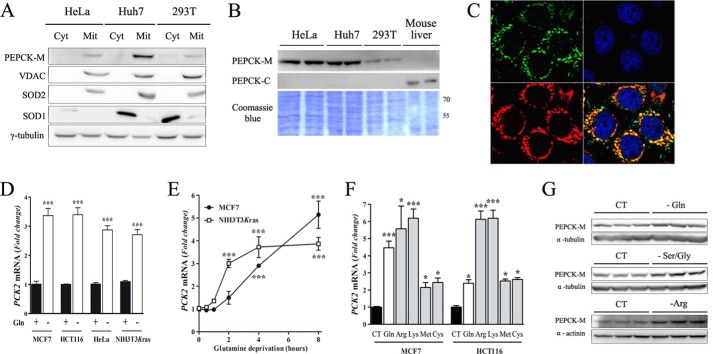
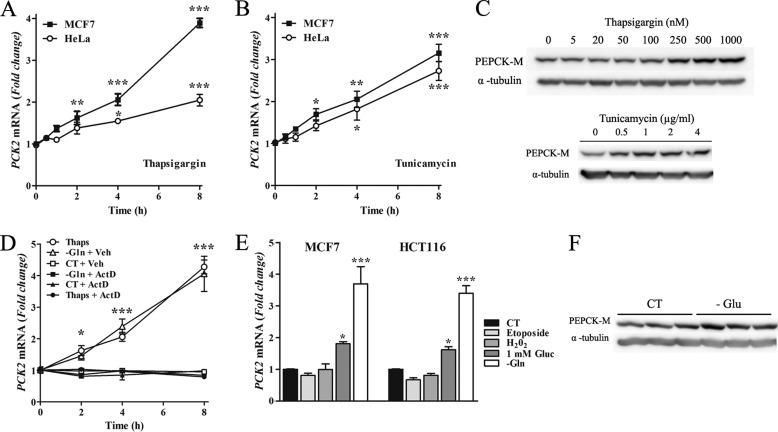
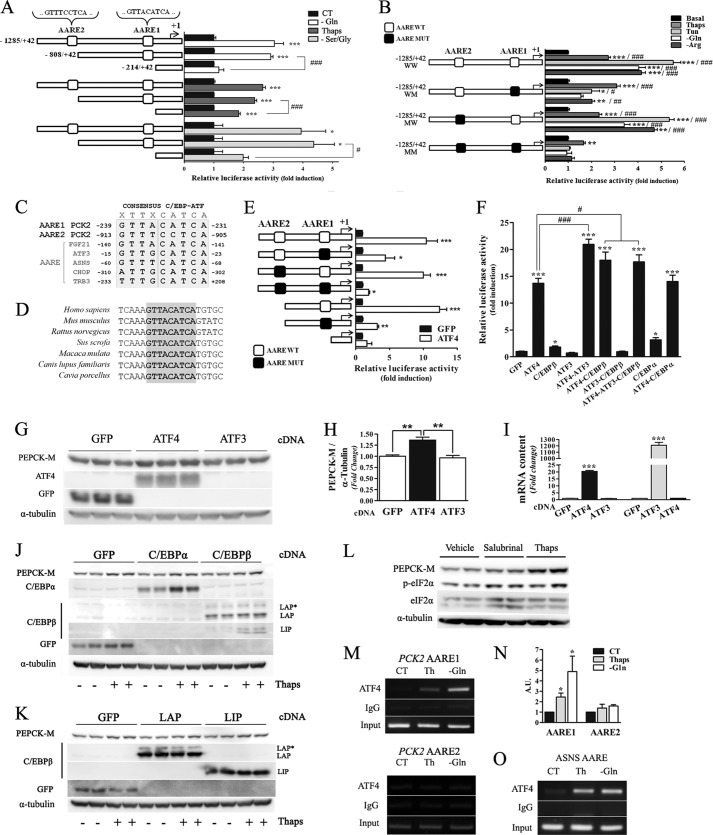
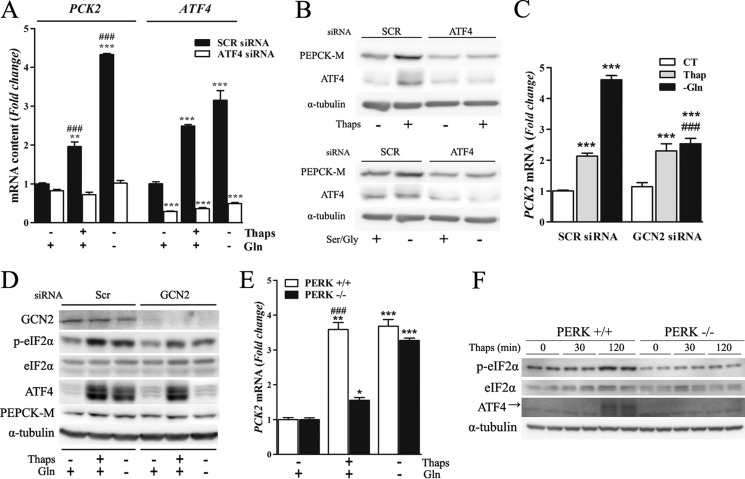
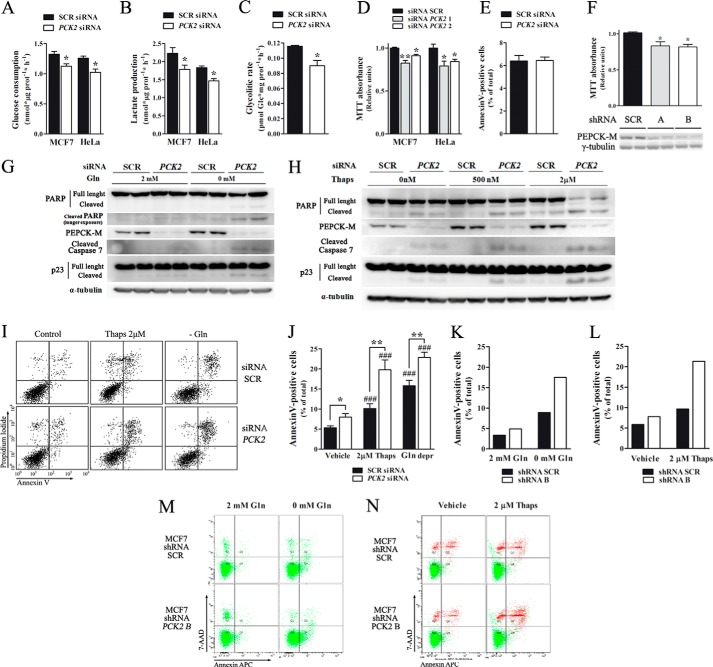
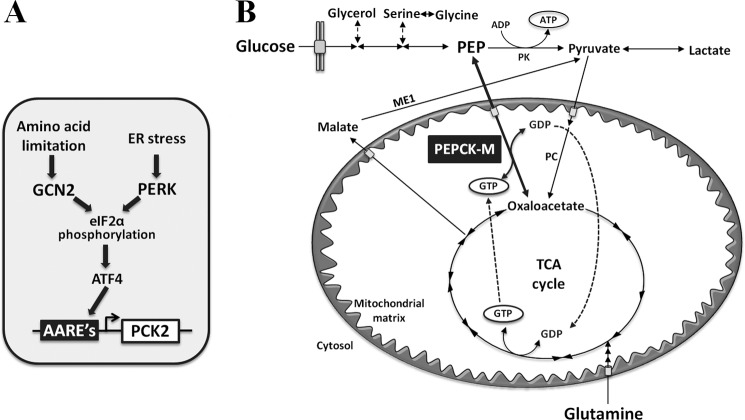
Mitochondrial phosphoenolpyruvate carboxykinase (PEPCK-M), encoded by the nuclear PCK2 gene, links TCA cycle intermediates and glycolytic pools through the conversion of mitochondrial oxaloacetate into phosphoenolpyruvate. In the liver PEPCK-M adjoins its profusely studied cytosolic isoform (PEPCK-C) potentiating gluconeogenesis and TCA flux. However, PEPCK-M is present in a variety of non-gluconeogenic tissues, including tumors of several origins. Despite its potential relevance to cancer metabolism, the mechanisms responsible for PCK2 gene regulation have not been elucidated. The present study demonstrates PEPCK-M overexpression in tumorigenic cells as well as the mechanism for the modulation of PCK2 abundance under several stress conditions. Amino acid limitation and ER stress inducers, conditions that activate the amino acid response (AAR) and the unfolded protein response (UPR), stimulate PCK2 gene transcription. Both the AAR and UPR lead to increased synthesis of ATF4, which mediates PCK2 transcriptional up-regulation through its binding to a putative ATF/CRE composite site within the PCK2 promoter functioning as an amino acid response element. In addition, activation of the GCN2-eIF2α-ATF4 and PERK-eIF2α-ATF4 signaling pathways are responsible for increased PEPCK-M levels. Finally, PEPCK-M knockdown using either siRNA or shRNA were sufficient to reduce MCF7 mammary carcinoma cell growth and increase cell death under glutamine deprivation or ER stress conditions. Our data demonstrate that this enzyme has a critical role in the survival program initiated upon stress and shed light on an unexpected and important role of mitochondrial PEPCK in cancer metabolism.

Keywords: AAR; AARE; ATF4; Cell Metabolism; ER Stress; PEPCK-M; Transcription Regulation; Tumor Metabolism; UPR; Unfolded Protein Response (UPR).


Figures

FIGURE 1.
FIGURE 1.
PEPCK-M is expressed in cancer cells, and its expression is regulated by amino acid limitation. A, PEPCK-M protein expression detection in different cell lines analyzed by Western blot after subcellular fractionation. Cytosolic and mitochondrial superoxide dismutases (SOD1 and -2, respectively) and the mitochondrial voltage-dependent anion channel protein (VDAC) transporter were used as markers. Cyt, cytosol; Mit, mitochondria. B, mitochondrial and cytosolic PEPCK (PEPCK-M and PEPCK-C, respectively) were measured in the same cell lines shown in A; mouse liver was used as positive control for PEPCK-C, and Coomassie Blue was used as the loading control. C, indirect immune detection using confocal microscopy of human PEPCK-M endogenously expressed in MCF7 cells. PEPCK-M staining is shown in green. Mitochondria are visualized using MitoTracker Red CMXRos (red), and nuclei are stained in blue using TO-PRO®3. PEPCK-M and mitochondria colocalize as seen by the yellow in the superimposed image. C–E, quantitative PCR with human PCK2-specific primers. D, four different cell lines (see “Experimental Procedures” for more information) were incubated with media lacking glutamine for 16 h. E, MCF7 and NIH3T3Kras cells were glutamine-deprived for the indicated times. F, MCF7 and HCT116 cells were cultured in media lacking glutamine, arginine, lysine, methionine, or cysteine for 8 h. CT, control. In all cases, the -fold induction of PCK2 with respect to basal conditions is represented. Data are presented as the mean ± S.E., n = 3–4. *, p < 0.05; ***, p < 0.001 relative to basal conditions; one-way ANOVA, with a Newman-Keuls post-hoc test. G, PEPCK-M protein induction was verified by Western blot in MCF7 cells incubated for 24 h in media lacking glutamine, serine and glycine, or arginine as indicated. α-Tubulin or α-actinin were used as the loading control.
FIGURE 2.
FIGURE 2.
PEPCK-M is activated by ER stress. MCF7 and HeLa cells were incubated with media containing 500 nm thapsigargin (A) or 2 μm tunicamycin (B) for the indicated times. C, PEPCK-M protein induction was verified by Western blot in MCF7 cells exposed for 24 h to different concentrations of thapsigargin (upper panel) or tunicamycin (lower panel). α-Tubulin was used as the loading control. D, MCF7 cells were incubated for the indicated time points in control media (CT + Veh), in media lacking glutamine, or media containing thapsigargin in the presence or absence of 5 μg/ml actinomycin D (ActD). DMSO was used as vehicle (Veh). E, MCF7 and HCT116 cells were cultured in media containing 10 μm etoposide, 0.4 mm H202, 1 mm glucose, or media lacking glutamine for 8 h. In all cases, the -fold induction of PCK2 with respect to control conditions is represented. Data are presented as the mean ± S.E., n = 3. *, p < 0.05; **, p < 0.01; ***, p < 0.001 relative to basal conditions; one-way ANOVA, with a Newman-Keuls post-hoc test. F, PEPCK-M protein levels were analyzed by Western blot in MCF7 cells incubated for 16 h in media containing 1 mm glucose.
FIGURE 3.
FIGURE 3.
Transcriptional control of PCK2 under amino acid limitation and ER stress is mediated by ATF4 through AARE consensus sequences. A, MCF7 cells were transiently transfected with the PCK2 full-length promoter-luciferase reporter construct (−1327 from the translational start) and truncated promoter fragments lacking one or both putative amino acid response elements (AARE1 and AARE2). When indicated, cells were glutamine- or serine- and glycine-deprived (−Ser/Gly) or treated with thapsigargin (Thaps; 500 nm) for 16 h. B, MCF7 cells were transiently transfected with the wild type PCK2 full-length promoter-luciferase reporter constructs or constructs AARE1 and AARE2. When indicated, cells were glutamine- or arginine-deprived (−Arg), treated with thapsigargin (500 nm), or with tunicamycin (Tun; 2 μm) for 16 h. C, comparison of the PCK2 AARE sequences with functional C/EBP-ATF binding sites present in other genes. D, alignment of the highly conserved PCK2 AARE1 sequence in different mammals. E, luciferase activity of the wild type, truncated, and mutated PCK2 promoter constructs co-transfected with an expression plasmid for human ATF4 during 24 h. GFP expression vector was used as control. F, luciferase activity of the wild type PCK2 promoter construct co-transfected with expression plasmids for GFP, ATF4, ATF3, C/EBPα, C/EBPβ, or combinations during 24 h. In A, B, E, and F luciferase and β-galactosidase activities were measured in cell extracts. -Fold induction of luciferase activity of treated cells with respect to basal condition or control vector is represented. G, PEPCK-M protein levels were measured by Western blot after ATF4 and ATF3 cDNA transfection, and GFP was used as cDNA control and α-tubulin as loading control. H, quantification of the PEPCK-M levels (normalized to α-tubulin) in the experiment detailed in G. The average of three experiments is shown. I, ATF4 and ATF3 mRNA levels after transfection were determined by quantitative PCR PEPCK-M levels determined by Western blot after C/EBPα and C/EBPβ (J) and C/EBPβ-LAP and C/EBPβ-LIP (K) overexpression with and without thapsigargin treatment (500 nm; 24 h). MCF7 cells were treated 5 μm salubrinal or 500 nm thapsigargin for 24 h (L) and ChIP analysis of ATF4 recruitment to the PCK2 promoter in response to glutamine deprivation and thapsigargin (500 nm) treatment during 8 h before chromatin preparation for ChIP in MCF7 cells (M). Amplification of input DNA (representing 1% of immunoprecipitated material) is shown for comparison. N, the level of amplified DNA was quantified by densitometric analysis of three different gels and corrected for the amount of input DNA. Values are expressed as the -fold change with respect to the control media. O, as the positive control, ChIP analysis of ATF4 recruitment to the asparagine synthetase (ASNS) AARE sequence in the experiment detailed above is shown. Data are presented as the mean ± S.E., n = 3. *, p < 0.05; **, p < 0.01; ***, p < 0.001 relative to basal conditions; #, p < 0.05; ##, p < 0.01; ###, p < 0.001 relative to minimal promoter (A and E), double-mutated (B) constructs, or GFP overexpression (F). One-way ANOVA, with a Newman-Keuls post-hoc test. CT, control.
FIGURE 4.
FIGURE 4.
Induction of PCK2 under amino acid limitation and ER stress depends on GCN2/eIF2α/ATF4 and PERK/eIF2α/ATF4 axis, respectively. A, real-time PCR analysis of PCK2 and ATF4 mRNA levels in MCF7 cells transfected with ATF4 or control (SCR) siRNA and incubated for 8h in control medium or in media either lacking glutamine or media supplemented with thapsigargin (Thaps; 500 nm). B, protein levels of PEPCK-M, ATF4, and α-tubulin were measured by immunoblotting in ATF4 siRNA knockdown cells exposed to 500 nm thapsigargin or to media lacking serine and glycine for 24 h. C, real-time PCR analysis of PCK2 mRNA levels in MCF7 cells transfected with GCN2 or control siRNA and incubated for 8 h with either control medium or in media lacking either glutamine or supplemented with thapsigargin (500 nm). CT, control. D, Western blot analysis of the experiment detailed in C demonstrates GCN2 knockdown with blunted ATF4 induction in response to amino acid depletion but not to ER stress. E, WT and Perk knock-out (Perk−/−) mouse embryonic fibroblasts were exposed to glutamine depletion or 500 nm thapsigargin for 8 h, and expression levels of PEPCK-M were quantified by real-time RT-PCR. F, Western blot analysis showing Perk−/− mouse embryonic fibroblasts blunted eif2α phosphorylation and ATF4 induction in response to thapsigargin. In all cases DMSO was added as vehicle control. The mRNA data are shown as -fold change relative to the control condition and represent the means ± S.E. of three independent experiments. *, p < 0.05; **, p < 0.01; ***, p < 0.001 relative to basal conditions; ###, p < 0.001 relative to same treatment in the other siRNA treatment or genotype. One-way ANOVA, with a Newman-Keuls post-hoc test.
FIGURE 5.
FIGURE 5.
PCK2 knockdown impairs survival under amino acid deprivation and ER stress conditions. PCK2 knockdown decreases glucose consumption (A) and lactate production (B) in MCF7 and HeLa cells. Glucose/lactate levels were measured in complete media collected after 8 h of cell culture 48 h after PCK2 knockdown. C, glycolytic flux was assayed by measuring the radioactivity of the 3H2O released at the enolase step of glycolysis using [5-3H]glucose after 1 h of incubation. D, MTT proliferation assay of MCF7 cells treated with 2 different siRNA against PCK2 for 2 days in complete media. E, FACS analysis of annexin V in the cells treated as panels A–D demonstrates the absence of apoptosis under normal grown conditions. F, MTT proliferation assay of MCF7 cells expressing two different shRNA against PCK2. PEPCK-M protein levels were determined by Western blot. G and H, 48 h after PCK2 knockdown with siRNA, MCF7 were incubated for 24 h in serum-free media either lacking glutamine or supplemented with thapsigargin (Thaps; 500 and 2 μm), and protein expression was assayed by Western blot. Apoptosis is demonstrated by PARP (poly(ADP-ribose) polymerase), caspase-7, and co-chaperone p23 cleavage. Note PEPCK-M efficient knockdown. I, FACS analysis of annexin V/propidium iodide labeling in Scr (top) and PCK2 siRNA (bottom) of the experiment detailed in G and H (thapsigargin: 2 μm). J, quantitation of annexin V labeling depicted in I (three experiments with four replicates per condition). Data are shown as -fold change relative to the control condition and represent the means ± S.E. of ≥3 independent experiments; * p < 0.05; **, p < 0.01; ***, p < 0.001 relative to SCR; ###, p < 0.001 relative to the basal condition. One-way ANOVA, with a Newman-Keuls post-hoc test, or two-tailed Student's t test (C and E). Annexin V/7-aminoactinomycin D analysis of MCF7 cells expressing shRNA against PCK2 either untreated, glutamine-deprived (K and M) or treated with thapsigargin (2 μm) (L and N). The average result and flow cytometry plots are representative of two experiments.
FIGURE 6.
FIGURE 6.
A, schematic diagram of our working hypothesis. Both GCN2 and PERK activation by stress lead to the phosphorylation of eif2α, which in turn increases the translation of ATF4. ATF4 binds to the AARE sequences in the PCK2 gene promoter, enhancing its transcriptional activity. B, schematic diagram of PEPCK-M involvement in cataplerosis and TCA cycle metabolism. PK, pyruvate kinase; PC, pyruvate carboxylase; ME1, malic enzyme 1.

References

    1. Chang H. C., Lane M. D. (1966) The enzymatic carboxylation of phosphoenolpyruvate. II. Purification and properties of liver mitochondrial phosphoenolpyruvate carboxykinase. J. Biol. Chem. 241, 2413–2420 - PubMed
    1. Nordlie R. C., Lardy H. A. (1963) Mammalian liver phosphoneolpyruvate carboxykinase activities. J. Biol. Chem. 238, 2259–2263 - PubMed
    1. Hanson R. W., Garber A. J. (1972) Phosphoenolpyruvate carboxykinase: I. Its role in gluconeogenesis. Am. J. Clin. Nutr. 25, 1010–1021 - PubMed
    1. Méndez-Lucas A., Duarte J. A., Sunny N. E., Satapati S., He T., Fu X., Bermúdez J., Burgess S. C., Perales J. C. (2013) PEPCK-M expression in mouse liver potentiates, not replaces, PEPCK-C mediated gluconeogenesis. J. Hepatol. 59, 105–113 - PMC - PubMed
    1. Stark R., Pasquel F., Turcu A., Pongratz R. L., Roden M., Cline G. W., Shulman G. I., Kibbey R. G. (2009) Phosphoenolpyruvate cycling via mitochondrial phosphoenolpyruvate carboxykinase links anaplerosis and mitochondrial GTP with insulin secretion. J. Biol. Chem. 284, 26578–26590 - PMC - PubMed

Publication types

MeSH terms