

Frailty in the Honolulu-Asia Aging Study: deficit accumulation in a male cohort followed to 90% mortality
- PMID: 24973228
- PMCID: PMC4296165
- DOI: 10.1093/gerona/glu089
Frailty in the Honolulu-Asia Aging Study: deficit accumulation in a male cohort followed to 90% mortality
Abstract
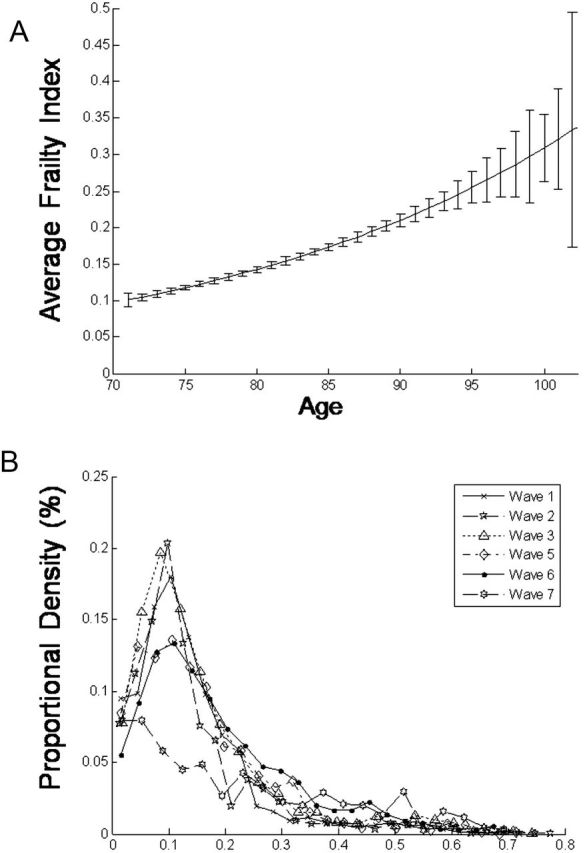
Background: A frailty index (FI) based on the accumulation of deficits typically has a submaximal limit at about 0.70. The objectives of this study were to examine how population characteristics of the FI change in the Honolulu-Asia Aging Study cohort, which has been followed to near-complete mortality. In particular, we were interested to see if the limit was exceeded.
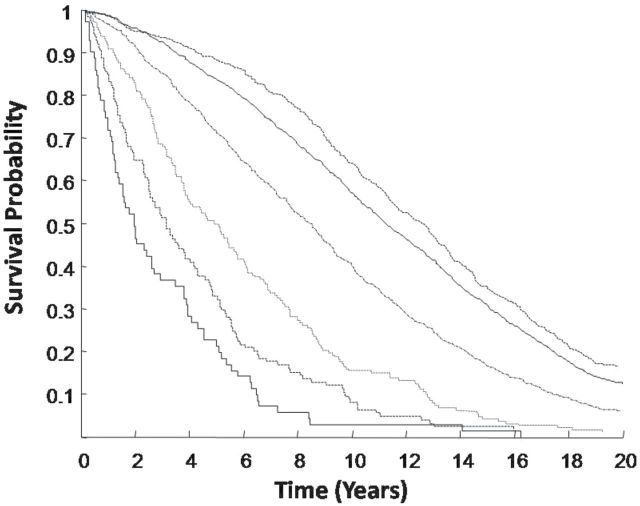
Methods: Secondary analysis of six waves of the Honolulu-Asia Aging Study. Men (n = 3,801) aged 71-93 years at baseline (1991) were followed until death (N = 3,455; 90.9%) or July 2012. FIs were calculated across six waves and the distribution at each wave was evaluated. Kaplan-Meier analyses and Cox proportional hazard models were performed to examine the relationship of frailty with mortality.
Results: At each wave, frailty was nonlinearly associated with age, with acceleration in later years. The distributions of the FIs were skewed with long right tails. Despite the increasing mortality in each successive wave, the 99% submaximal limit never exceeded 0.65. The risk of death increased with increasing values of the FI (eg, the hazard rate increased by 1.44 [95% CI = 1.39-1.49] with each increment in the baseline FI grouping). Depending on the wave, the median survival of people with FI more than 0.5 ranged 0.84-2.04 years.
Conclusions: Even in a study population followed to almost complete mortality, the limit to deficit accumulation did not exceed 0.65, confirming a quantifiable, maximum number of health deficits that older men can tolerate.
Keywords: Deficit accumulation; Epidemiology; Frailty; Frailty index; Mortality..
© The Author 2014. Published by Oxford University Press on behalf of The Gerontological Society of America. All rights reserved. For permissions, please e-mail: journals.permissions@oup.com.
Figures
References
-
- Parks RJ, Fares E, Macdonald JK, et al. A procedure for creating a frailty index based on deficit accumulation in aging mice. J Gerontol A Biol Sci Med Sci. 2012;67:217–227. :10.1093/gerona/glr193 - PubMed
-
- Armstrong JJ, Stolee P, Hirdes JP, Poss JW. Examining three frailty conceptualizations in their ability to predict negative outcomes for home-care clients. Age Ageing. 2010;39:755–758. :10.1093/ageing/afq121 - PubMed
Publication types
MeSH terms
Grants and funding
LinkOut - more resources
Full Text Sources
Other Literature Sources
Medical
