. 2014 Jun 27;2(6):e12054.
doi: 10.14814/phy2.12054. Print 2014 Jun 1.

Vasohibin-1 deficiency enhances renal fibrosis and inflammation after unilateral ureteral obstruction

Affiliations

Vasohibin-1 deficiency enhances renal fibrosis and inflammation after unilateral ureteral obstruction

Hiroyuki Watatani et al. Physiol Rep. .

Abstract

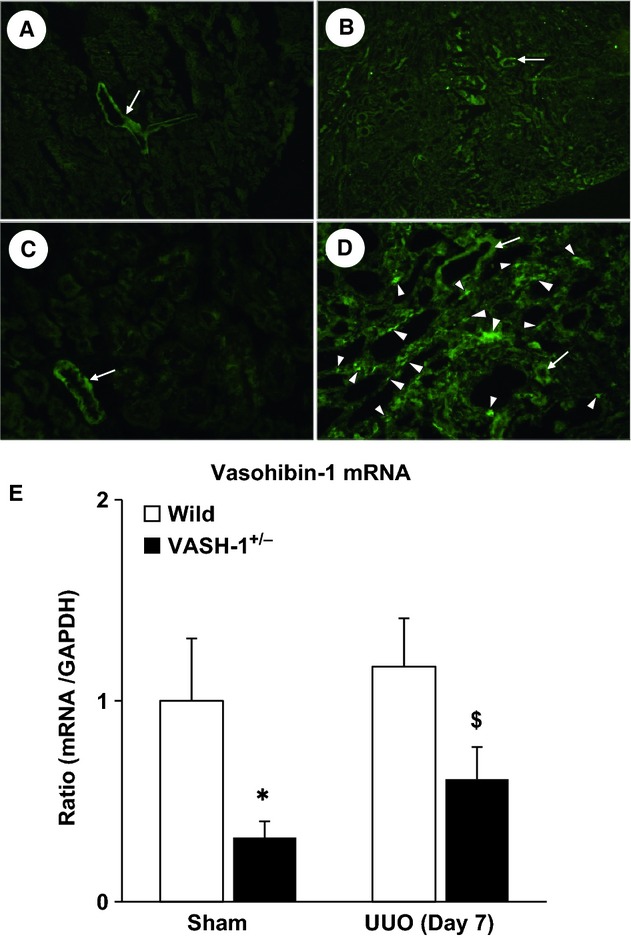
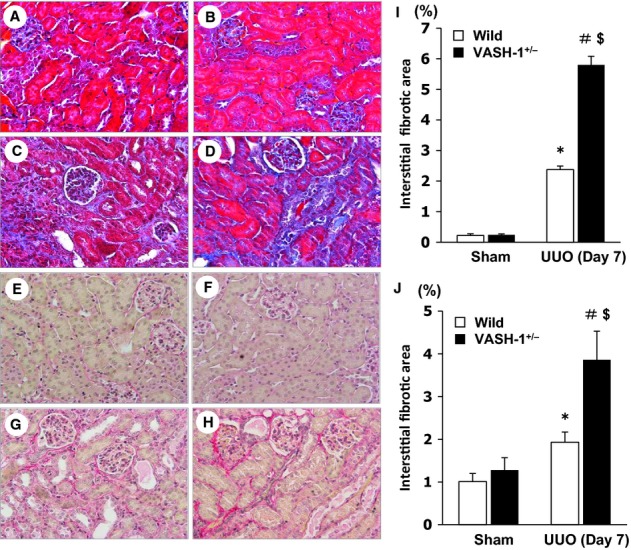
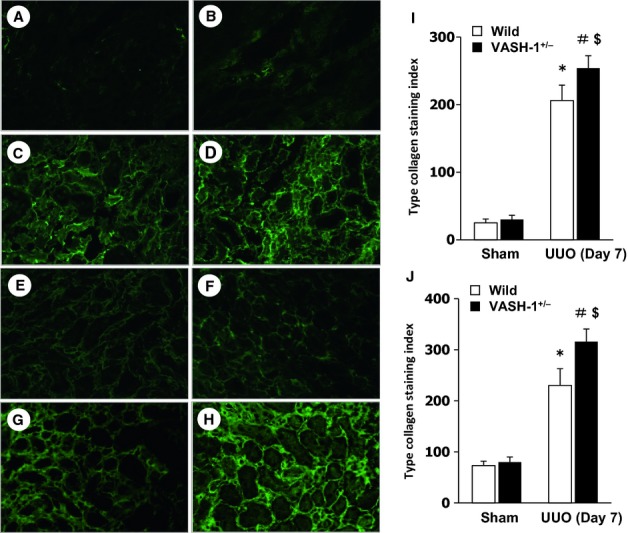
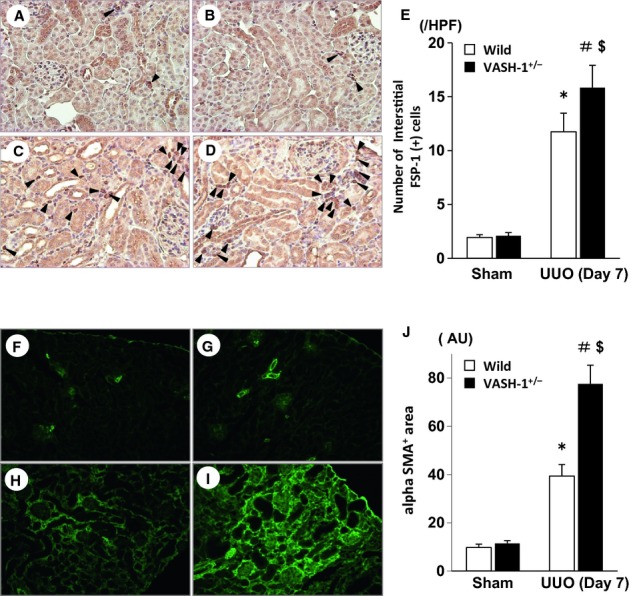
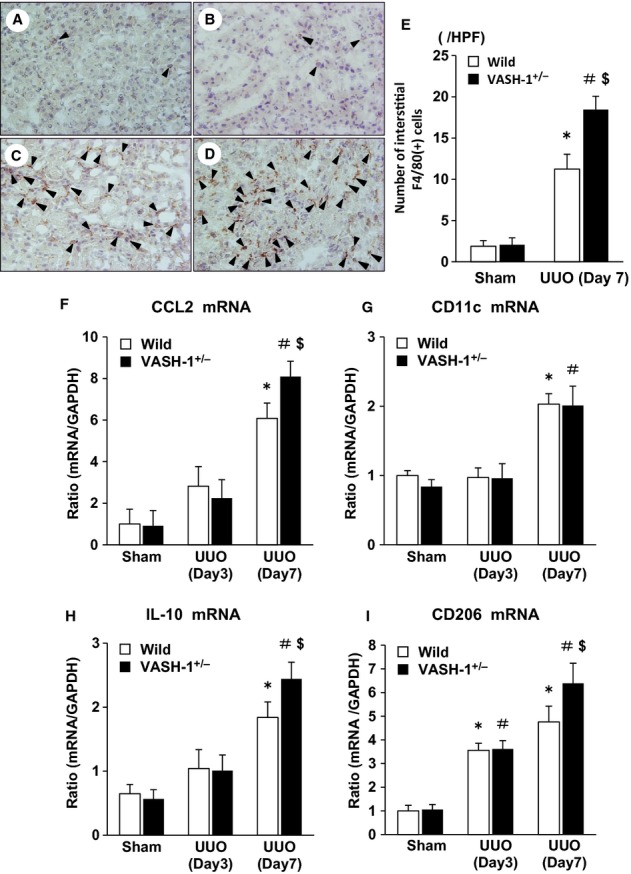
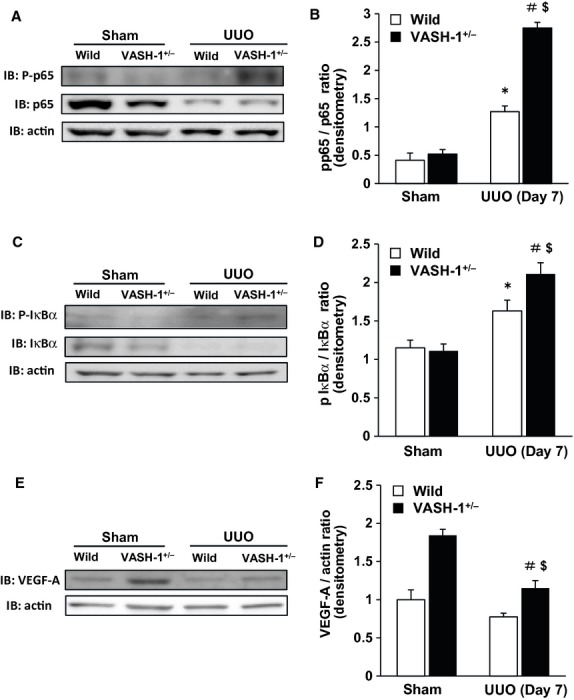
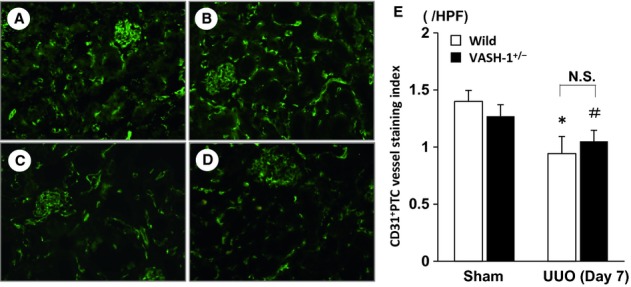
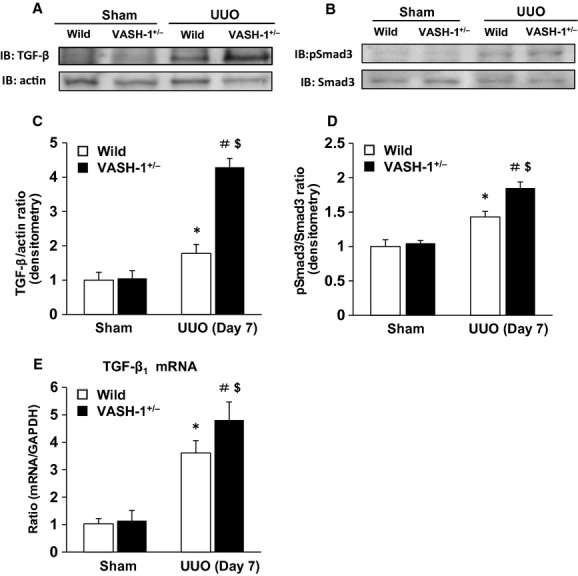
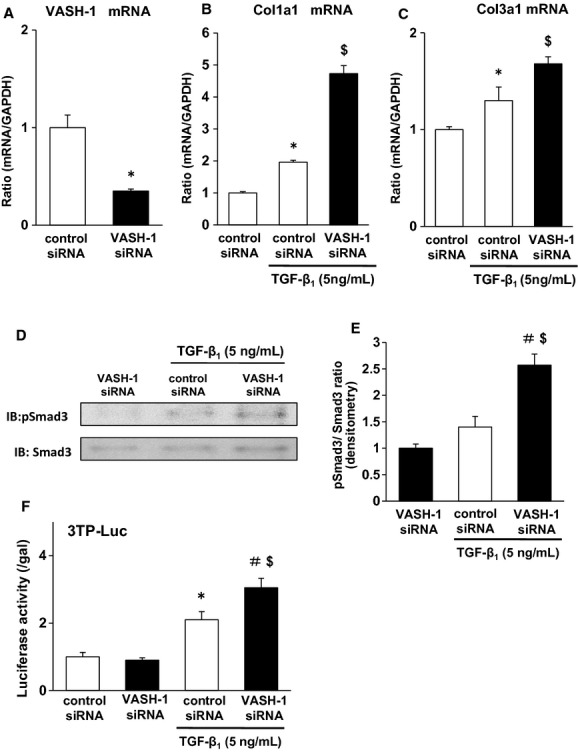
Tubulointerstitial injuries are known to predict the deterioration of renal function in chronic kidney disease (CKD). We recently reported the protective role of Vasohibin-1(VASH-1), a negative feedback regulator of angiogenesis, in diabetic nephropathy, but its impact on tubulointerstitial injuries remains to be elucidated. In the present study, we evaluated the role of endogenous VASH-1 in regulating the tubulointerstitial alterations induced by unilateral ureteral obstruction (UUO), and assessed its role on fibrogenesis and the activation of Smad3 signaling in renal fibroblasts. UUO was induced in female Vasohibin-1 heterozygous knockout mice (VASH-1(+/-)) or wild-type (WT) (VASH-1(+/+)) littermates. Mice were sacrificed on Day 7 after left ureter ligation, and the kidney tissue was obtained. Interstitial fibrosis, the accumulation of type I and type III collagen and monocytes/macrophages infiltration in the obstructed kidneys (OBK) were significantly exacerbated in VASH-1(+/-) mice compared with WT mice (Day 7). The increases in the renal levels of TGF-β1, pSmad3, NF-κB pp65, CCL2 mRNA, and the number of interstitial fibroblast-specific protein-1 (FSP-1)(+) fibroblasts in the OBK were significantly aggravated in VASH-1(+/-) mice. In addition, treatment with VASH-1 siRNA enhanced the TGF-β1-induced phosphorylation of Smad3, the transcriptional activation of the Smad3 pathway and the production of type I/type III collagen in fibroblasts, in vitro. Taken together, our findings demonstrate a protective role for endogenous VASH-1 on tubulointerstitial alterations via its regulation of inflammation and fibrosis and also show the direct anti-fibrotic effects of VASH-1 on renal fibroblasts through its modulation of TGF-β1 signaling.

Keywords: Inflammation; TGF‐β1; macrophage; tubulointerstitial fibrosis; unilateral ureteral obstruction; vasohibin‐1.


Figures

Figure 1.
Figure 1.
Characterization of the VASH‐1 KO mice. (A–D) The VASH‐1 antibody was used to stain serial kidney sections from sham‐operated wild‐type (WT) (A, C) and WT/unilateral ureteral obstruction (UUO) (B, D) mice. (A, B) Original magnification; ×80. (C, D) Original magnification; ×400. (A, C) The immunoreactivity for VASH‐1 was mainly observed in the blood vessels (arrows). (B, D) The immunoreactivity for VASH‐1 was observed mainly in the renal interstitial cells (arrowheads), but was also observed in the blood vessels (arrows). (E) Real‐time PCR of WT (VASH1+/+) and VASH1+/− kidneys. The levels of VASH‐1 mRNA were normalized to those of GAPDH. The VASH‐1 mRNA levels were decreased in the VASH1+/− sham‐operated mice compared with the WT sham‐operated control mice. Similarly, the levels of VASH‐1 mRNA were decreased in the OBK of the VASH‐1+/− UUO mice compared with the WT UUO mice. OBK, obstructed kidneys.
Figure 2.
Figure 2.
Accelerated tubulointerstitial fibrosis in the VASH‐1+/− unilateral ureteral obstruction (UUO) mice. (A–D) Representative light microscopic findings of the renal cortex of the obstructed kidneys (OBK) on Day 7 (Masson's Trichrome staining, original magnification; ×400) for wild‐type (WT) sham‐operated (A), VASH1+/− sham‐operated (B), WT UUO (C) and VASH1+/− UUO (D) mice. (I) The interstitial fibrosis in the OBK was significantly exacerbated in the VASH1+/− UUO compared with the WT UUO mice. (E–H) Representative light microscopic findings of the renal cortex of the OBK on Day 7 (Sirius red staining, original magnification; ×400) for WT sham‐operated (E), VASH1+/− sham‐operated (F), WT UUO (G) and VASH1+/− UUO (H) mice. (J) The interstitial fibrosis in the OBK was significantly exacerbated in the VASH1+/− UUO compared with WT UUO mice. n =5 for each group. *P <0.05 versus WT sham. #P <0.05 versus VASH1+/− sham. $P <0.05 versus WT UUO. Each column shows the means ± SEM.
Figure 3.
Figure 3.
Immunofluorescent staining of type I and type III collagens. The interstitial accumulation of type l (A–D) and type lll (E–H) collagens was assessed by immunofluorescent staining for wild‐type (WT) sham‐operated (A and E), VASH1+/− sham‐operated (B and F), WT unilateral ureteral obstruction (UUO) (C and G) and VASH1+/− UUO (D and H) mice. The interstitial accumulation of collagens in the obstructed kidneys (OBK) was significantly exacerbated in the VASH1+/− UUO (D and H) compared with the WT UUO (C and G) mice. The computer image analysis further confirmed the exacerbation of interstitial collagen accumulation in the OBK of the VASH1+/− UUO mice (I and J). *P <0.05 versus WT sham‐operated. #P <0.05 versus VASH1+/− sham‐operated. $P <0.05 versus WT UUO. n =5 for each group. Each column shows the means ± SEM.
Figure 4.
Figure 4.
Immunohistochemical staining for FSP‐1 and αSMA. (A–D) The interstitial accumulation of FSP‐1+ fibroblasts (arrowheads) was assessed by an immunohistochemical analysis of wild‐type (WT) sham‐operated (A), VASH1+/− sham‐operated (B), WT unilateral ureteral obstruction (UUO) (C) and VASH1+/− UUO (D) mice. (E) The number of interstitial FSP‐1+ fibroblasts is shown. The quantitative analysis confirmed that there was a significant increase in interstitial FSP‐1+ fibroblasts in the obstructed kidneys (OBK) of the VASH‐1+/− UUO mice. (F–I) The interstitial accumulation of αSMA+ myofibroblasts was assessed by immunofluorescence staining of the WT sham‐operated (F), VASH1+/− sham‐operated (G), WT UUO (H) and VASH1+/− UUO (I) mice. (J) The interstitial αSMA+ area relative to the total tubulointerstitial area was determined by a computer image analysis. The increase in the interstitial αSMA+ area in the OBK of VASH‐1+/− mice (I) was significantly increased compared with that in the OBK of WT mice (H). *P <0.05 versus WT sham‐operated. #P <0.05 versus VASH1+/− sham‐operated. $P <0.05 versus WT UUO. n =5 for each group. Each column shows the means ± SEM.
Figure 5.
Figure 5.
Exacerbated interstitial monocyte/macrophage infiltration in the VASH1+/− unilateral ureteral obstruction (UUO) mice. (A–D) The interstitial accumulation of F4/80+ monocytes/macrophages (arrowheads) was assessed by performing an immunohistochemical analysis of the wild‐type (WT) sham‐operated (A), VASH1+/− sham‐operated (B), WT UUO (C) and VASH1+/− UUO (D) mice. (E) The number of interstitial F4/80+ monocytes/macrophages is shown. The quantitative analysis confirmed the significant exacerbation of the interstitial monocyte/macrophage infiltration in the obstructed kidneys (OBK) of VASH‐1+/− mice. (F, G) The alterations in the renal mRNA levels of CCL2 and CD11c (real‐time PCR). (F) The UUO‐induced increase in the renal levels of CCL2 mRNA was significantly exacerbated in the VASH‐1+/− mice compared with the WT mice. (G) The mRNA levels of CD11c in the OBK of WT and VASH‐1+/− mice were increased similarly to those in the sham‐operated mice. (H, I) The alterations in the renal mRNA levels of IL‐10 and CD206 (real‐time PCR). (H) The IL‐10 mRNA levels were markedly elevated in the OBK of VASH‐1+/− mice compared with those in the WT‐UUO group. (I) The CD206 mRNA levels were significantly elevated in the OBK of WT mice, and were further increased in the OBK of VASH‐1+/− mice. *P <0.05 versus WT sham‐operated. #P <0.05 versus VASH1+/− sham‐operated. $P <0.05 versus WT UUO. n =5 for each group. Each column shows the means ± SEM.
Figure 6.
Figure 6.
The increase in the renal level of phospho‐NF‐κB/p65 and phospho‐IκBα induced by unilateral ureteral obstruction (UUO) were enhanced in the VASH‐1+/− mice. (A) A Western blot analysis of the phospho‐NF‐κB/p65 level was performed. (A, B) The UUO‐induced increase in the renal levels of phospho‐NF‐κB/p65 was significantly exacerbated in the VASH‐1+/− mice compared with the wild‐type (WT) mice. (C, D) The UUO‐induced increase in the renal levels of phospho‐ IκBα was significantly elevated in the VASH‐1+/− mice compared with the WT mice. *P <0.05 versus WT sham‐operated. #P <0.05 versus VASH1+/− sham‐operated. $P <0.05 versus WT UUO. (E, F) The results of the Western blot analysis of VEGF‐A. The VEGF‐A protein levels were significantly increased in the VASH1+/− sham‐operated mice compared with the WT sham‐operated mice. The VEGF‐A protein levels were significantly decreased in the VASH1+/− UUO mice compared with the VASH1+/− sham‐operated mice, but were significantly higher than those in the WT UUO mice. #P <0.05 versus VASH1+/− sham‐operated. $P <0.05 versus WT UUO. n =5 for each group. Each column shows the means ± SEM.
Figure 7.
Figure 7.
Immunofluorescent staining of CD31+ peritubular capillaries (PTC). The CD31+ PTC were assessed by immunofluorescent staining in the wild‐type (WT) sham‐operated (A), VASH1+/− sham‐operated (B), WT unilateral ureteral obstruction (UUO) (C) and VASH1+/− UUO (D) mice. (E) There were no significant differences in the densities of CD31+ PTC between the WT sham‐operated and VASH1+/− sham‐operated mice. The PTC density in the WT UUO mice was significantly decreased compared with the WT sham‐operated mice, and compared with the VASH1+/− sham‐operated mice, the PTC density was significantly decreased in the VASH1+/− UUO mice. However, there were no significant differences in the density of the CD31+ PTC between the WT UUO and the VASH1+/− UUO mice. *P < 0.05 versus WT sham‐operated control. #P < 0.05 versus VASH1+/− sham‐operated. N = 5 for each group. Each column shows the means ± SEM.
Figure 8.
Figure 8.
VASH‐1 deficiency enhanced the TGF‐β1/Smad3 signaling in the unilateral ureteral obstruction (UUO). (A, C, E) The UUO‐induced increase in the renal levels of TGF‐β1 was significantly exacerbated in the VASH‐1+/− mice compared with the wild‐type (WT) mice as detected by immunoblots and real‐time PCR. (B, D) The UUO‐induced increase in the renal levels of phosphorylated Smad3 (normalized by the total Smad3 level) was significantly exacerbated in the VASH‐1+/− mice compared with the WT mice. *P <0.05 versus WT sham‐operated control. #P <0.05 versus VASH1+/− sham‐operated. $P <0.05 versus WT UUO. n =5 for each group. Each column shows the means ± SEM.
Figure 9.
Figure 9.
VASH1 deficiency exacerbated the TGF‐β1‐induced Smad3 signaling and matrix synthesis in cultured renal fibroblasts (NRK‐49F). (A) VASH‐1 was effectively inhibited by siRNA for VASH‐1. Real‐time PCR showed the knockdown of VASH‐1 mRNA by rat VASH‐1 siRNA in the NRK‐49F cells. (B, C) VASH‐1 siRNA treatment significantly upregulated the TGF‐β1‐induced synthesis of type I and III collagen mRNAs compared with the control siRNA. (D, E) VASH‐1 siRNA treatment significantly upregulated the TGF‐β1‐induced Smad3 phosphorylation compared with the control siRNA. (F) The Smad3‐responsive promoter assay (Luciferase assay). The cells were transiently transfected with a 3TP–Luc reporter plasmid (500 ng) and pCMV‐β‐gal (50 ng), and then were treated with TGF‐β1 (5 ng/mL) for 24 h. The cells were lysed, and the luciferase activity and β‐galactosidase (β‐gal) activity were measured and expressed as the ratio of luciferase to β‐gal activity. The results are shown as the means ± SEM of data from at least three separate experiments, each performed with triplicate samples. VASH‐1 siRNA treatment significantly up‐regulated the TGF‐β1‐induced Smad3‐dependent promoter activity compared with the control siRNA. *P <0.05 versus siRNA (Control). #P <0.05 versus siRNA (VASH‐1). $P <0.05 versus siRNA (Control)/TGF‐β1. Each column shows the means ± SEM.

Similar articles

Cited by

References

    1. Bascands J. L., Schanstra J. P. 2005. Obstructive nephropathy: insights from genetically engineered animals. Kidney Int.; 68:925-937. - PMC - PubMed
    1. Bottinger E. P., Bitzer M. 2002. TGF‐beta signaling in renal disease. J. Am. Soc. Nephrol.; 13:2600-2610. - PubMed
    1. Braga T. T., Correa‐Costa M., Guise Y. F., Castoldi A., de Oliveira C. D., Hyane M. I. 2012. MyD88 signaling pathway is involved in renal fibrosis by favoring a TH2 immune response and activating alternative M2 macrophages. Mol. Med.; 18:1231-1239. - PMC - PubMed
    1. Chen S. J., Yuan W., Mori Y., Levenson A., Trojanowska M., Varga J. 1999. Stimulation of type I collagen transcription in human skin fibroblasts by TGF‐beta: involvement of Smad 3. J. Invest. Dermatol.; 112:49-57. - PubMed
    1. Chung A. C., Huang X. R., Zhou L., Heuchel R., Lai K. N., Lan H. Y. 2009. Disruption of the Smad7 gene promotes renal fibrosis and inflammation in unilateral ureteral obstruction (UUO) in mice. Nephrol. Dial. Transplant.; 24:1443-1454. - PubMed