. 2014 Sep 1;592(17):3727-46.
doi: 10.1113/jphysiol.2014.274274. Epub 2014 Jun 27.

Activation and propagation of Ca2+ release from inside the sarcoplasmic reticulum network of mammalian skeletal muscle

Affiliations

Activation and propagation of Ca2+ release from inside the sarcoplasmic reticulum network of mammalian skeletal muscle

Tanya R Cully et al. J Physiol. .

Abstract

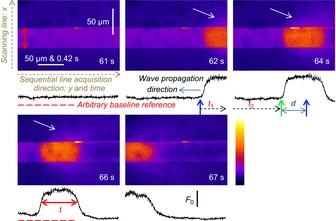
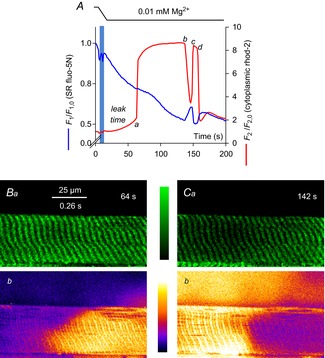
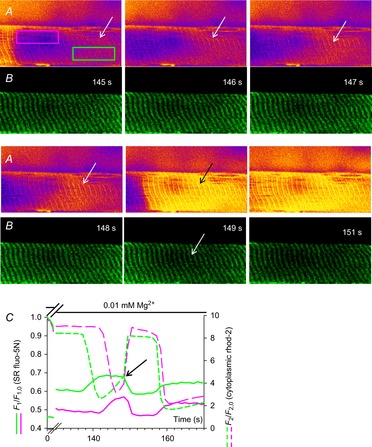
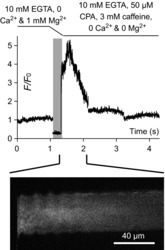
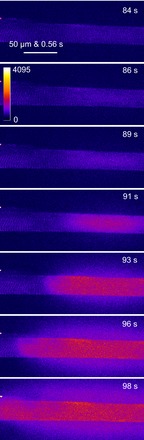
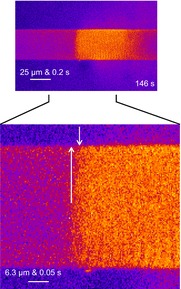
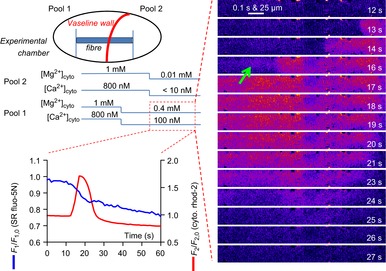
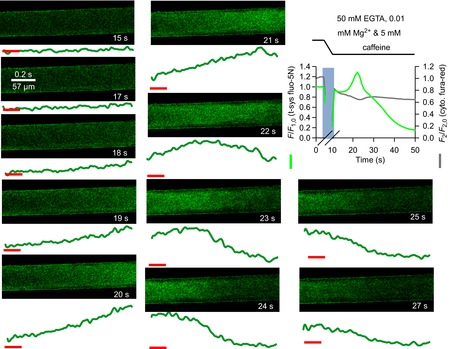
Skeletal muscle fibres are large and highly elongated cells specialized for producing the force required for posture and movement. The process of controlling the production of force within the muscle, known as excitation-contraction coupling, requires virtually simultaneous release of large amounts of Ca(2+) from the sarcoplasmic reticulum (SR) at the level of every sarcomere within the muscle fibre. Here we imaged Ca(2+) movements within the SR, tubular (t-) system and in the cytoplasm to observe that the SR of skeletal muscle is a connected network capable of allowing diffusion of Ca(2+) within its lumen to promote the propagation of Ca(2+) release throughout the fibre under conditions where inhibition of SR ryanodine receptors (RyRs) was reduced. Reduction of cytoplasmic [Mg(2+)] ([Mg(2+)]cyto) induced a leak of Ca(2+) through RyRs, causing a reduction in SR Ca(2+) buffering power argued to be due to a breakdown of SR calsequestrin polymers, leading to a local elevation of [Ca(2+)]SR. The local rise in [Ca(2+)]SR, an intra-SR Ca(2+) transient, induced a local diffusely rising [Ca(2+)]cyto. A prolonged Ca(2+) wave lasting tens of seconds or more was generated from these events. Ca(2+) waves were dependent on the diffusion of Ca(2+) within the lumen of the SR and ended as [Ca(2+)]SR dropped to low levels to inactivate RyRs. Inactivation of RyRs allowed re-accumulation of [Ca(2+)]SR and the activation of secondary Ca(2+) waves in the persistent presence of low [Mg(2+)]cyto if the threshold [Ca(2+)]SR for RyR opening could be reached. Secondary Ca(2+) waves occurred without an abrupt reduction in SR Ca(2+) buffering power. Ca(2+) release and wave propagation occurred in the absence of Ca(2+)-induced Ca(2+) release. These observations are consistent with the activation of Ca(2+) release through RyRs of lowered cytoplasmic inhibition by [Ca(2+)]SR or store overload-induced Ca(2+) release. Restitution of SR Ca(2+) buffering power to its initially high value required imposing normal resting ionic conditions in the cytoplasm, which re-imposed the normal resting inhibition on the RyRs, allowing [Ca(2+)]SR to return to endogenous levels without activation of store overload-induced Ca(2+) release. These results are discussed in the context of how pathophysiological Ca(2+) release such as that occurring in malignant hyperthermia can be generated.


Figures

Figure 1
Figure 1. Image acquisition and analysis
xyt imaging of Ca2+-dependent fluorescence from rhod-2 containing internal bathing solution surrounding a skinned fibre from mouse. The scanning line of the laser was transversal to the fibre axis, x, with each line (512) sequentially acquired along the long axis of the fibre, y. The spatially averaged profiles of F/F0 from within the borders of the preparation, indicated by vertical, double red arrows in first image, are shown below each image in black. Note that y maps proportionally to time and that each image was acquired at a rate of 1.622 s but the timestamp placed in the bottom right-hand corner of each image is rounded to the nearest second (these images are a subset of the experiment displayed in Fig. 7A, with corresponding time-stamp). Ca2+ waves pass along the fibre within the imaging region across four consecutive images. The conversion of the spatially averaged profile of fibre from y to t allows the determination of Ca2+ wave propagation rate (d/t1+t2) and full duration at half magnitude (t) with a temporal resolution two orders of magnitude better than that of the xyt scanning mode (1.662 s). The white arrows indicate diffusion of Ca-rhod-2 from the preparation during Ca2+ release.
Figure 2
Figure 2. SR and cytoplasmic Ca2+ during prolonged Ca2+ release
The spatially averaged fluorescence values for each frame in an xyt series of SR-trapped fluo-5N fluorescence (blue line) and cytoplasmic rhod-2 fluorescence (red line) from a rat skinned fibre during the lowering of [Mg2+]cyto is plotted in A. The interval of solution change is indicated by the horizontal bars at top and the vertical blue bar on the profile. a–d refer to the Ca2+ release and termination of release events. These events are described in the text and analysed in Fig. 6. Lowering [Mg2+]cyto causes Ca2+ to initially leak from SR, marked leak time and indicated by the rise in cytoplasmic rhod-2 fluorescence up to the position marked a (see Fig. 5). Images from the rise (B) and decline (C) of the Ca2+ transient induced by lowering [Mg2+]cyto are shown. The background of the fluo-5N fluorescence image has been subtracted and the image median filtered. Time stamp in top right-hand corner of fluo-5N fluorescence image corresponds to that of the spatially averaged values of rhod-2 and fluo-5N fluorescence shown in A. A ‘halo’ of Ca2+ released from the fibre was observed in C (see Methods). SR, sarcoplasmic reticulum.
Figure 3
Figure 3. Following prolonged Ca2+ release resequestered cytoplasmic Ca2+ provides the driving force for briefer Ca2+ transients to start
Selected images cytoplasmic rhod-2 fluorescence (A) and SR trapped fluo-5N fluorescence (B) following the exchange of standard internal bathing solution for low [Mg2+]cyto solution bathing a rat skinned fibre. The spatially restricted fluorescence values of cytoplasmic rhod-2 fluorescence and SR trapped fluo-5N fluorescence of the fibre bound by the pink and green boxes (indicated in the first image in A) are plotted against time in C for a selected section of this experiment (full experiment presented in Fig. 2). The white arrows in B from time-points 145 s to 148 s indicate a region of increasing cytoplasmic rhod-2 fluorescence intensity while the SR-trapped fluo-5N fluorescence remains relatively high and constant. The black arrow in A at time-point 149 s indicates a rapid increase in cytoplasmic rhod-2 fluorescence compared to the previous 3 s and a rapid decline in SR-trapped fluo-5N fluorescence. These events in this restricted region of the fibre are shown in profile in the green lines in C. The black arrow in C indicates the change in rate of increase of rhod-2 cytoplasmic fluorescence that correlates with net SR-trapped fluo-5N fluorescence turning negative. The profiles in the pink line in C represents the fluorescence values of SR-trapped fluo-5N fluorescence and cytoplasmic rhod-2 fluorescence from the area marked with the pink box in A. A delay in Ca2+ movements is observed between the two locations (C). SR, sarcoplasmic reticulum.
Figure 4
Figure 4. Inhibition of the SR Ca2+ pump during Ca2+ release depletes the SR in seconds
The spatially averaged cytoplasmic rhod-2 fluorescence values versus elapsed time (which maps proportionally to the abscissa of xy scans, see Methods) is plotted at top during the exchange of solutions in a skinned fibre from medium EGTA solution for medium EGTA releasing solution (Table 1). The lines above the figure and the vertical, pale grey bar indicate the exchange of solutions. The high amplitude of the rhod-2 fluorescence immediately after the solution exchange indicates the largest amount of Ca2+ is released in the first few hundreds of milliseconds. The xy image during the release of SR Ca2+ is shown at bottom. Note that no Ca2+ halo is observed in 10 mm EGTA (see Methods). Ca2+ is prevented from re-entering SR by 10 mm EGTA and the SR Ca2+ pump blocker CPA. CPA, cyclopianzonic acid; SR, sarcoplasmic reticulum.
Figure 5
Figure 5. Frequency plot of leak times
Plot of ‘leak times’ as defined in Fig. 2.
Figure 6
Figure 6. Analysis of prolonged Ca2+ release
Ratios of SR depletion rate to Ca2+ release rate at a and c; and the SR Ca2+ uptake rate to cytoplasmic Ca2+ decline rate at b and d from Fig. 2 (see text). SR, sarcoplasmic reticulum.
Figure 7
Figure 7. Restitution of BSR by lowering sarcoplasmic reticulum (SR) permeability and reloading the SR with Ca2+
The spatially averaged values of the frames of a xyt series capturing cytoplasmic rhod-2 fluorescence images from a skinned fibre from mouse exposed to four cycles of exposure to 200 nm Ca2+ and 1 mm Mg2+ followed by low Mg2+ and nominally 0 Ca2+. Each response to low Mg2+ produced release of Ca2+ that was initially prolonged, lasting many seconds to tens of seconds, which was followed by much briefer transients. The order of the exposure to low Mg2+ is left-to-right, top-to-bottom, labelled a–d. Images of Ca2+ release from this series of exposures to low Mg2+ are shown in Figs 1, 7 and 9.
Figure 8
Figure 8. Low Mg2+-induced Ca2+ releases are prolonged Ca2+ waves, brief Ca2+ waves and a composite
Selected images of cytoplasmic rhod-2 fluorescence following the application of low [Mg2+]cyto to a mouse skinned fibre. Three distinct types of Ca2+ wave are shown. A ‘halo’ of Ca2+ in the surrounding bathing solution of the skinned fibre is observed. The spatially averaged values of the complete experiment from which these images have been extracted are displayed in Fig. 7C.
Figure 9
Figure 9. A local and eventless rise of the prolonged Ca2+ transient
Selected images of cytoplasmic rhod-2 fluorescence following the exchange of standard internal bathing solution for low [Mg2+]cyto solution bathing a mouse skinned fibre. A gradual increase of Ca2+ over seconds (images marked 84–91 s) occurs locally without any obvious discrete events. At the imaged marked 93 s the locally increased cytoplasmic Ca2+ began to spread as an apparent Ca2+ wave.
Figure 10
Figure 10. Propagation of Ca2+ waves is not driven by a cytoplasmic mechanism
Selected cytoplasmic rhod-2 fluorescence image from Fig. 8 has been enlarged. The base of the first white arrow indicates the front of the Ca2+ wave, which is in the central region of the fibre, and the point of the arrow indicates a possible direction of propagation of the wave front. The second arrow indicates where the front of the wave meets the fibre edge. The distance, y, between the arrowheads, which also maps proportionally to t is used to determine the propagation rate if cytoplasmic propagation of Ca2+ is assumed to spread the wave front across the short axis of the fibre. Under this assumption, the rate of propagation would be close to 1 mm s−1.
Figure 11
Figure 11. The skeletal muscle SR is a network that can mobilize Ca2+ along the fibre
The schematic diagram at top left shows the experimental chamber with a skinned fibre preparation and a Vaseline wall built perpendicular to the axis of the fibre. The Vaseline wall creates two pools that allow different ionic conditions to be imposed across the halves of the preparation. Cytoplasmic rhod-2 fluorescence and SR-trapped fluo-5N fluorescence were imaged in pool 1. The [Mg2+] and [Ca2+] contained in the internal bathing solutions in each pool and the timing of the solution exchanges in an experiment performed in this chamber is shown by the lines below the schematic diagram. The red box indicates the positioning and point in time from which the spatially averaged fluorescence values of rhod-2 and fluo-5N (bottom, left) are derived and the cytoplasmic rhod-2 images (right). At about 10 s after the change in pool 2 from 1 mm to 0.01 mm [Mg2+]cyto a Ca2+ wave propagated along the fibre in pool 1. This was accompanied by a persistent decrease in [Ca2+]SR. The nadir of [Ca2+]SR depletion during the wave was significantly after the peak of the cytoplasmic response. Ca2+ waves were generated in all five preparations challenged in this manner. SR, sarcoplasmic reticulum.
Figure 12
Figure 12. t-system Ca2+ during prolonged sarcoplasmic reticulum Ca2+ release in low Mg2+, 5 mm caffeine and 50 mm EGTA
Spatially averaged values of t-system trapped fluo-5N fluorescence and cytoplasmic fura-red fluorescence during Ca2+ release induced by low Mg2+ and 5 mm caffeine in the presence of 50 mm EGTA following exchange from a solution containing 50 mm EGTA, 1 mm Mg2+ and 100 nm Ca2+ in a rat skinned fibre is shown top right. The lines at the top and pale vertical bar on the spatially averaged profile indicate the solution change. A slow uptake of Ca2+ by the t-system followed by a slow depletion is reported by t-system fluo-5N. The fura-red signal shows a peak trailed that of the t-system signal. Note that fura-red fluorescence is inversely proportional to [Ca2+]. Selected images of t-system trapped fluo-5N fluorescence are shown with time-stamps corresponding to that in the spatially averaged profile. Below each image are the spatially averaged values of t-system trapped fluo-5N fluorescence versus elapsed time (which maps proportionally to the abscissa of xy scans, see Methods). The horizontal red lines mark the arbitrary baseline for all images. Ca2+ increases in the t-system at right as the image is presented and moves to the left, followed by a depletion of Ca2+.

Similar articles

Cited by

References

    1. Armstrong CM, Bezanilla FM, Horowicz P. Twitches in the presence of ethylene glycol bis(-aminoethyl ether)-N,N′-tetracetic acid. Biochim Biophys Acta. 1972;267:605–608. - PubMed
    1. Bandschapp O, Girard T. Malignant hyperthermia. Swiss Med Wkly. 2012;142:w13652. - PubMed
    1. Beard NA, Sakowska MM, Dulhunty AF, Laver DR. Calsequestrin is an inhibitor of skeletal muscle ryanodine receptor calcium release channels. Biophys J. 2002;82:310–320. - PMC - PubMed
    1. Beard NA, Wei L, Dulhunty AF. Control of muscle ryanodine receptor calcium release channels by proteins in the sarcoplasmic reticulum lumen. Clin Exp Pharmacol Physiol. 2009;36:340–345. - PubMed
    1. Beard NA, Casarotto MG, Wei L, Varsányi M, Laver DR, Dulhunty AF. Regulation of ryanodine receptors by calsequestrin: effect of high luminal Ca2+ and phosphorylation. Biophys J. 2005;88:3444–3454. - PMC - PubMed

Publication types

LinkOut - more resources