Review
. 2014 Oct 1;592(19):4137-45.
doi: 10.1113/jphysiol.2014.277376. Epub 2014 Jun 27.

Synaptic mechanisms underlying cholinergic control of thalamic reticular nucleus neurons

Affiliations
Review

Synaptic mechanisms underlying cholinergic control of thalamic reticular nucleus neurons

Michael Beierlein. J Physiol. .

Abstract

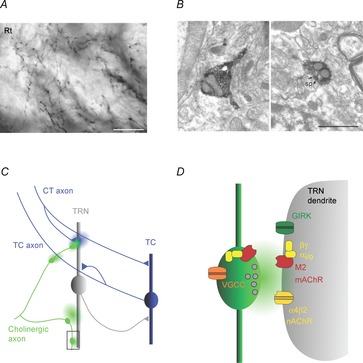
Neuronal networks of the thalamus are the target of extensive cholinergic projections from the basal forebrain and the brainstem. Activation of these afferents can regulate neuronal excitability, transmitter release, and firing patterns in thalamic networks, thereby altering the flow of sensory information during distinct behavioural states. However, cholinergic regulation in the thalamus has been primarily examined by using receptor agonist and antagonist, which has precluded a detailed understanding of the spatiotemporal dynamics that govern cholinergic signalling under physiological conditions. This review summarizes recent studies on cholinergic synaptic transmission in the thalamic reticular nucleus (TRN), a brain structure intimately involved in the control of sensory processing and the generation of rhythmic activity in the thalamocortical system. This work has shown that acetylcholine (ACh) released from individual axons can rapidly and reliably activate both pre- and postsynaptic cholinergic receptors, thereby controlling TRN neuronal activity with high spatiotemporal precision.


Figures

Figure 1
Figure 1. Cholinergic signalling modes in the thalamic reticular nucleus
A, axonal arborizations with small diameter varicosities formed by cholinergic afferents in the rat TRN (Rt). Axons are immunostained for choline acetyltransferase (ChAT), the enzyme responsible for ACh synthesis. Scale bar, 20 μm. B, micrographs show two examples of axonal varicosities (labelled dark) formed by cholinergic axons in the TRN. Left image depicts an unmyelinated axon containing vesicles leading into a varicosity, without an obvious synaptic junction. Right image shows synaptic junction (outlined by arrows), formed onto a postsynaptic spine (sp). Scale bar, 1 μm. Images reproduced with permission from Parent & Descarries (2008). C, schematic diagram illustrates thalamic circuitry as well as possible targets of ACh signalling in the TRN. Cholinergic afferents (green) contact distal dendrites of TRN neurons and generate E–I cholinergic responses, probably mediated by ultrastructurally defined synapses (area outlined by square and shown in more detail in D). In addition, ACh released from en passant varicosities could act over larger distances and activate extrasynaptic receptors expressed on TRN dendrites, nAChRs expressed by thalamocortical (TC) axons or receptors expressed at presynaptic corticothalamic (CT) terminals. In turn, glutamate release from CT axons could modulate cholinergic signalling by acting on pre- or postsynaptic receptors at cholinergic synapses. D, schematic diagram illustrating the cellular mechanisms underlying cholinergic synaptic signalling in the TRN, based on the findings in Sun et al. (2013). ACh release activates postsynaptic ionotropic nAChRs (probably α4β2) and metabotropic Gi/o-coupled M2 mAChRs, which are expressed both pre- and postsynaptically. M2 mAChR activation in the postsynaptic membrane triggers the liberation of the βγ subunit complex, in turn leading to the opening of G protein-coupled inwardly rectifying K+ (GIRK) channels. Presynaptic M2 mAChRs are responsible for autoinhibition of ACh release, probably generated by βγ subunit complex-mediated inhibition of presynaptic Ca2+ channels.
Figure 2
Figure 2. Properties of biphasic cholinergic synaptic signalling
TRN neurons were recorded with a K+-based internal solution, except for the recordings shown in B–D, which were obtained with a Cs+-based internal solution. Cholinergic synaptic transmission was isolated by including antagonists of glutamatergic and GABAergic synaptic transmission, except for data shown in B. A, E–I postsynaptic response (red trace) evoked by single stimuli applied locally. The EPSC was blocked by the nAChR antagonist DHβE, while the remaining IPSC (blue trace) was eliminated by the mAChR antagonist atropine (not shown). Subtraction of the IPSC from the biphasic response yields time course of nicotinic EPSC (nEPSC, black trace). B, comparison of the time course of the postsynaptic responses evoked by cholinergic and glutamatergic afferents to TRN. Single stimuli evoked EPSCs with a fast and a slow component (red trace) in a TRN neuron. The fast component generated by activation of corticoreticular and thalamoreticular inputs was blocked by the AMPAR antagonist NBQX and the slow component (black trace) was blocked by the nAChR antagonist DHβE (not shown). C, nEPSCs evoked by paired stimuli (inter-stimulus interval (ISI) 500 ms) prior to (red) and following application of the M2 mAChR antagonist AF-DX 116 (10 μm, black) in a representative recording. Blocking M2 mAChRs leads to an increase in nEPSC amplitude evoked by the second stimulus, showing that ACh release is controlled by autoinhibition. Note that the nEPSC amplitude evoked by the first stimulus remains unchanged, indicating the ACh release is not controlled by tonic activation of presynaptic mAChRs. D, summary (n = 5) showing nEPSC2/nEPSC1 (paired-pulse ratio) for different ISIs in control (red circles) and AF-DX 116 (black circles). E, activation of individual presynaptic cholinergic axons elicits E–I postsynaptic responses. Overlay of individual trials evoked at a constant stimulus intensity, showing both PSCs (light red) and response failures (grey), with averages for the two groups shown in red and black, respectively. F, graph plots mIPSC amplitude against nEPSC amplitude of individual trials (n = 38), for data shown in E. Note that nEPSCs and mIPSCs occur in common trials. Data adapted from Sun et al. (2013).
Figure 3
Figure 3. Cholinergic synaptic inputs triggers TRN neuronal firing via activation of T-type Ca2+ channels
A, somatic burst discharges produce robust Ca2+ responses in distal dendrites of TRN neurons, mediated by the activation of T-type Ca2+ channels. Left, image of TRN neuron filled with the green Ca2+-sensitive dye Fluo-4 and the red Ca2+-insensitive dye Alexa 594, obtained using 2-photon laser scanning microscopy. Boxes in blue and red outline regions from which Ca2+ measurements were obtained. Middle, Ca2+ responses in the proximal and distal dendrite of a different cell, evoked by burst firing at the soma. Fluorescence changes are expressed as ΔG/R, calculated as the change in Fluo-4 fluorescence, normalized to the average fluorescence of Alexa 594. Right, summary data (n = 14 dendrites) showing larger burst-evoked Ca2+ transients in distal dendrites (red) as compared to transients at more proximal dendrites (blue). Data reproduced with permission from Crandall et al. (2010). B, activation of cholinergic inputs triggers burst firing in TRN neuron. A representative experiment shows individual trials of either PSPs generating action potentials (red) or response failures (black), evoked at a constant stimulus intensity, indicating activation of a single presynaptic axon. C, activation of postsynaptic T-type Ca2+ channels is required for ACh-evoked neuronal firing. Representative recording shows cholinergic input-evoked burst firing prior to and following application of the specific T-type Ca2+ channel antagonist TTA-P2. D–G, cholinergic inputs entrain ongoing neuronal activity. Data shown are from the same neuron. D, postsynaptic E–I response evoked by a brief stimulus train (10 stimuli, 10 Hz), for a TRN neuron held at −60 mV. E, the same stimulus train (indicated by horizontal bar) was applied during ongoing action potential activity evoked by depolarizing current steps (6 s, 120 pA). Shown are 5 consecutive trials. F, raster plot showing the timing of spikes in consecutive trials during and following stimulus train (onset of synaptic stimulation at t = 0 ms). G, poststimulus time histogram (bin size 20 ms), compiled for 58 consecutive trials. Data adapted from Sun et al. (2013).

References

    1. Arroyo S, Bennett C, Aziz D, Brown SP, Hestrin S. Prolonged disynaptic inhibition in the cortex mediated by slow, non-α7 nicotinic excitation of a specific subset of cortical interneurons. J Neurosci. 2012;32:3859–3864. - PMC - PubMed
    1. Arroyo S, Bennett C, Hestrin S. Nicotinic modulation of cortical circuits. Front Neural Circuits. 2014;8:30. - PMC - PubMed
    1. Astori S, Wimmer RD, Prosser HM, Corti C, Corsi M, Liaudet N, Volterra A, Franken P, Adelman JP, Luthi A. The CaV3.3 calcium channel is the major sleep spindle pacemaker in thalamus. Proc Natl Acad Sci U S A. 2011;108:13823–13828. - PMC - PubMed
    1. Bell KA, Shim H, Chen CK, McQuiston AR. Nicotinic excitatory postsynaptic potentials in hippocampal CA1 interneurons are predominantly mediated by nicotinic receptors that contain α4 and β2 subunits. Neuropharmacology. 2011;61:1379–1388. - PMC - PubMed
    1. Bennett C, Arroyo S, Berns D, Hestrin S. Mechanisms generating dual-component nicotinic EPSCs in cortical interneurons. J Neurosci. 2012;32:17287–17296. - PMC - PubMed

Publication types

MeSH terms

LinkOut - more resources