Comparative Study
. 2014 Aug 1;193(3):1151-61.
doi: 10.4049/jimmunol.1301440. Epub 2014 Jun 27.

Conventional but not plasmacytoid dendritic cells foster the systemic virus-induced type I IFN response needed for efficient CD8 T cell priming

Affiliations
Comparative Study

Conventional but not plasmacytoid dendritic cells foster the systemic virus-induced type I IFN response needed for efficient CD8 T cell priming

Sandra Hervas-Stubbs et al. J Immunol. .

Abstract

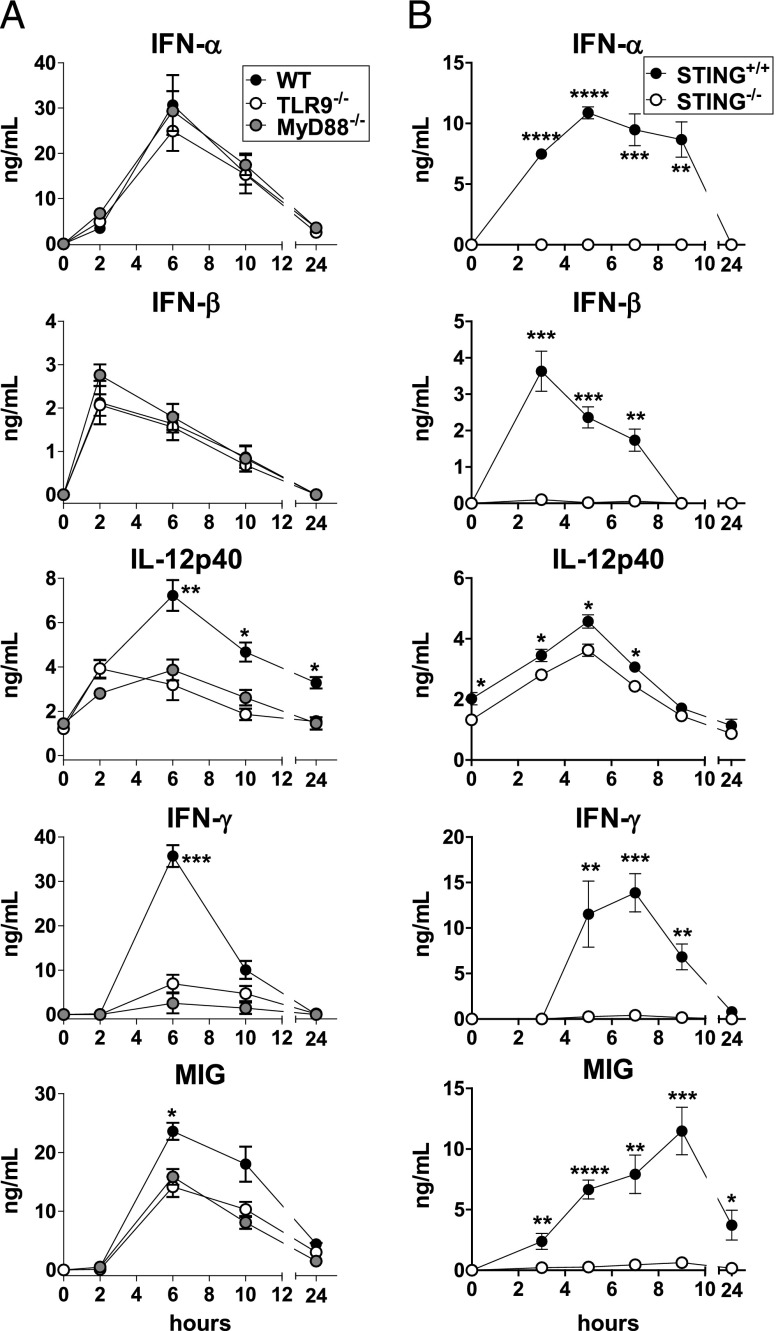
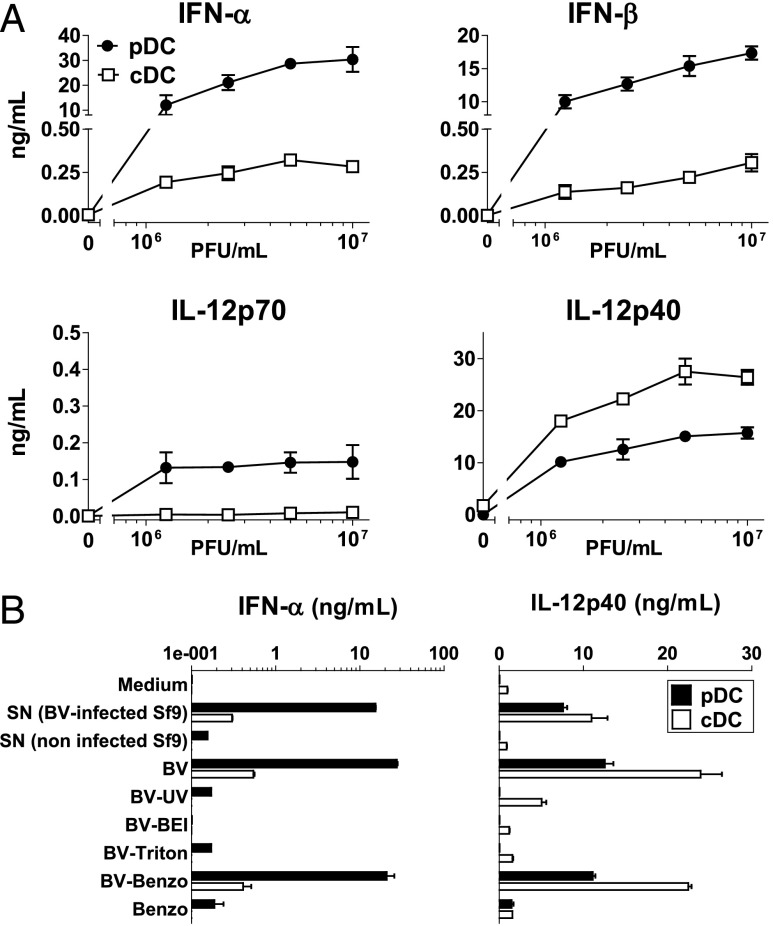
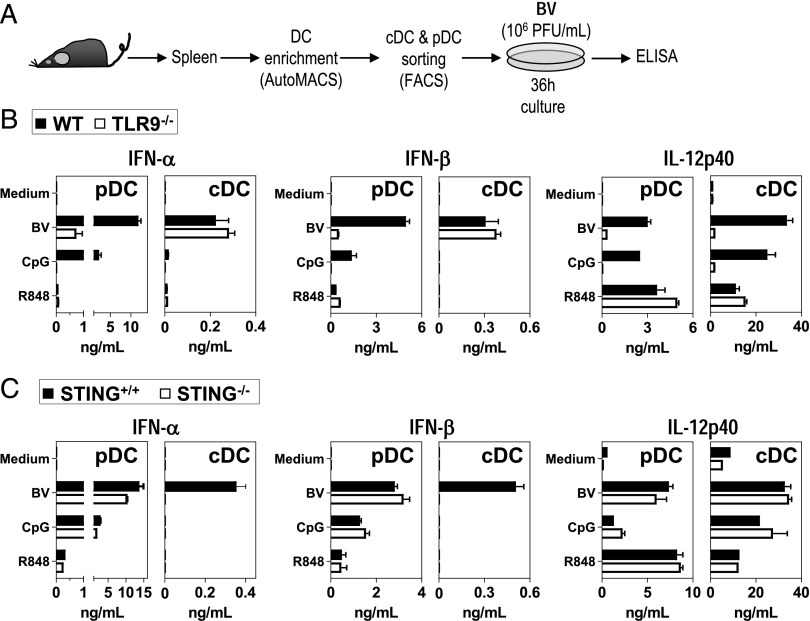
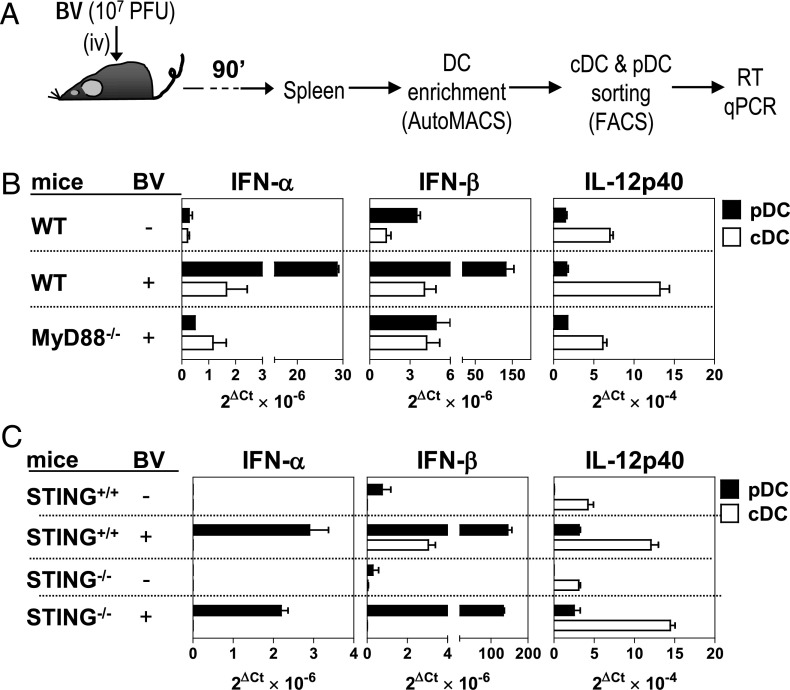
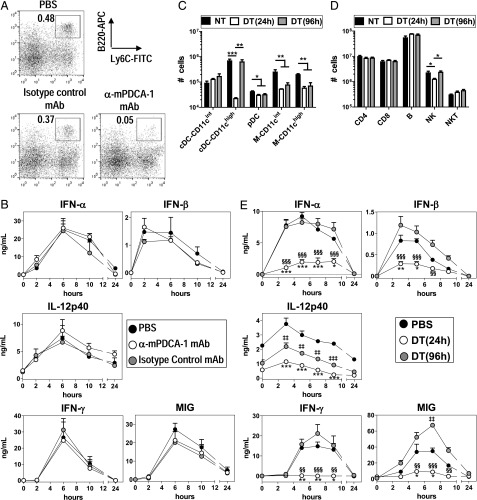
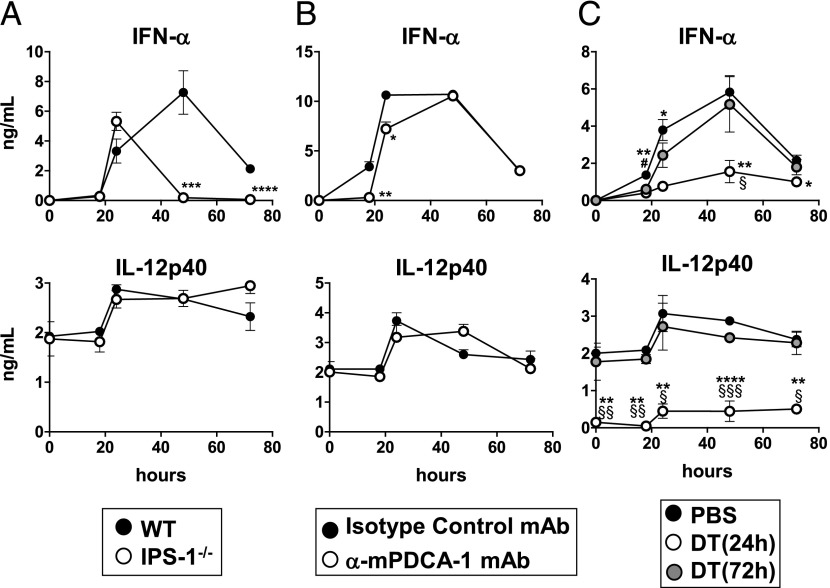
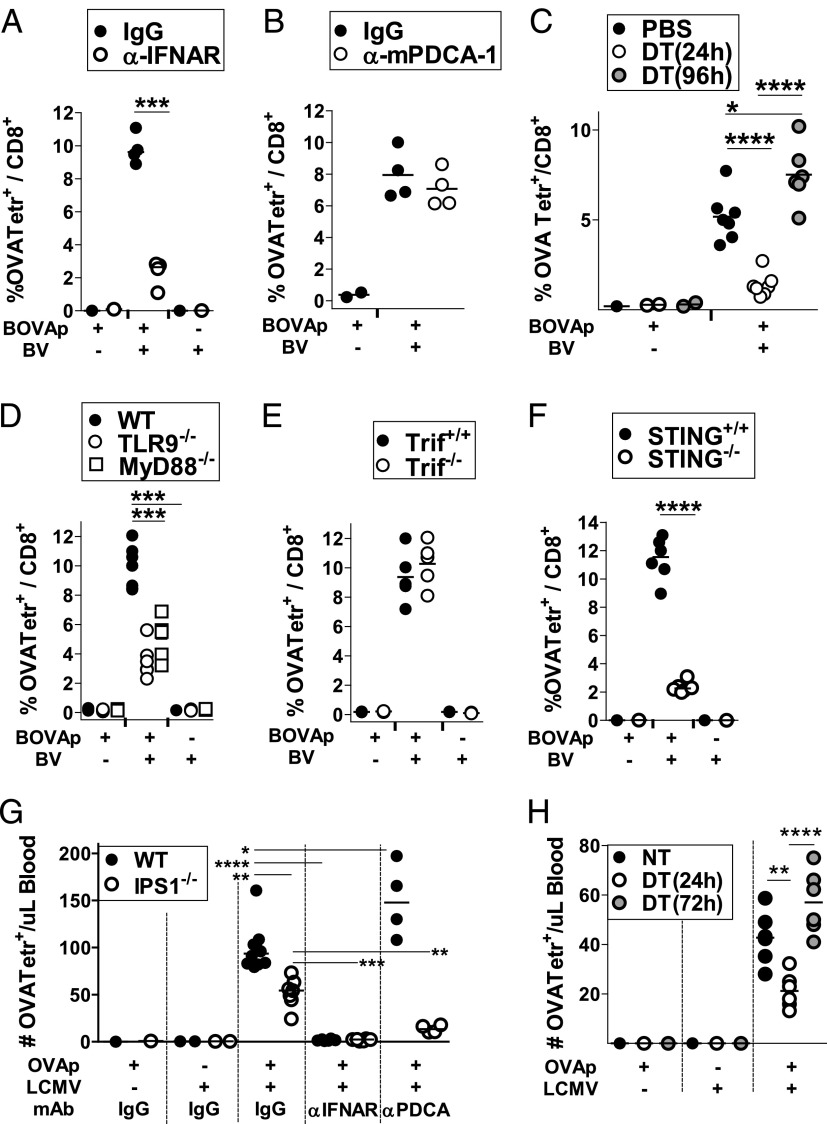
Plasmacytoid dendritic cells (pDCs) are considered to be the principal type-I IFN (IFN-I) source in response to viruses, whereas the contribution of conventional DCs (cDCs) has been underestimated because, on a per-cell basis, they are not considered professional IFN-I-producing cells. We have investigated their respective roles in the IFN-I response required for CTL activation. Using a nonreplicative virus, baculovirus, we show that despite the high IFN-I-producing abilities of pDCs, in vivo cDCs but not pDCs are the pivotal IFN-I producers upon viral injection, as demonstrated by selective pDC or cDC depletion. The pathway involved in the virus-triggered IFN-I response is dependent on TLR9/MyD88 in pDCs and on stimulator of IFN genes (STING) in cDCs. Importantly, STING is the key molecule for the systemic baculovirus-induced IFN-I response required for CTL priming. The supremacy of cDCs over pDCs in fostering the IFN-I response required for CTL activation was also verified in the lymphocytic choriomeningitis virus model, in which IFN-β promoter stimulator 1 plays the role of STING. However, when the TLR-independent virus-triggered IFN-I production is impaired, the pDC-induced IFNs-I have a primary impact on CTL activation, as shown by the detrimental effect of pDC depletion and IFN-I signaling blockade on the residual lymphocytic choriomeningitis virus-triggered CTL response detected in IFN-β promoter stimulator 1(-/-) mice. Our findings reveal that cDCs play a major role in the TLR-independent virus-triggered IFN-I production required for CTL priming, whereas pDC-induced IFNs-I are dispensable but become relevant when the TLR-independent IFN-I response is impaired.


Figures

FIGURE 1.
FIGURE 1.
Role of TLR9, MyD88, and STING in the systemic inflammatory cytokine triggered by BV. WT (C57BL/6), TLR9−/−, and MyD88−/− mice (A) or STING+/+ and STING−/− littermate mice (B) received a single injection of BV and their sera were titrated for the indicated cytokines by ELISA. The results are expressed as the means ± SEM for six (A) or five (B) mice per group. Data are representative (A) or are cumulative from two independent experiments (B). (A) *p < 0.05, **p < 0.01, ***p < 0.001 (WT versus TLR9−/− and WT versus MyD88−/−); (B) *p < 0.05, **p < 0.01, ***p < 0.001, ****p > 0.0001.
FIGURE 2.
FIGURE 2.
In vitro inflammatory cytokines produced by pDCs and cDCs after stimulation with BV. (A) FACS-sorted splenic cDCs and pDCs from 129Sv mice were stimulated with BV, and the cytokine production was determined in culture supernatant by ELISA. (B) pDCs and cDCs were stimulated with supernatants (SN) (diluted 1:10) from Sf9 cells infected or not with BV, or with BV (107 PFU/ml) either untreated or treated with UV light (BV-ultraviolet), BEI (BV-BEI), Triton X-100 (BV-Triton), or Benzonase (BV-Benzo). As a control, cells were also cultured with a volume of Benzonase (Benzo) equivalent to the volume of Benzonase-treated BV. Data are representative of at least two independent experiments.
FIGURE 3.
FIGURE 3.
Role of TLR9 and STING in the in vitro production of inflammatory cytokines by pDCs and cDCs in response to BV. (A) Experiment schedule. FACS-sorted splenic pDCs and cDCs from WT and TLR9−/− mice (B) or from STING+/+ and STING−/− mice (C) were stimulated with BV (107 PFU/ml). As control we also stimulated cells with CpGA-2216 (25 μg/ml) or R848 (1 μg/ml) (B and C). Cytokine production was determined in culture supernatants by ELISA. Data are representative of two independent experiments.
FIGURE 4.
FIGURE 4.
Role of MyD88 and STING in the in vivo production of inflammatory cytokines by pDCs and cDCs in response to BV. (A) Experiment schedule. Mice were left untreated or were injected (i.v.) with BV (107 PFU) and 90 min later spleens were harvested. Splenic cDCs and pDCs were FACS-sorted from a DC-enriched splenocyte preparation and processed for RNA isolation. (B and C). Expression of IFN-α, IFN-β, and IL-12p40 mRNA in FACS-sorted splenic pDCs and cDCs from WT and MyD88−/− mice (B) or from STING+/+ and STING−/− littermate mice (C) analyzed by quantitative RT-PCR. Data are representative of at least two independent experiments.
FIGURE 5.
FIGURE 5.
cDCs, but not pDCs, are required for the in vivo inflammatory response promoted by BV. (A) Percentage of pDCs (CD19NK1.1CD11c+B220+Ly6C+) in total splenocytes 24 h after PBS, anti–mPDCA-1 mAbs, or rat IgG2b delivery. (B) Seric levels of cytokines triggered by BV in C57BL/6J mice that were previously treated with PBS, anti–mPDCA-1 mAbs, or rat IgG2b. (C and D) Absolute number of different subsets of DCs, macrophages (C), and lymphocytes (D) in total splenocytes from CD11c-DTR → WT chimeric mice 24 and 96 h after PBS or DT administration. Cells were gated as indicated in Supplemental Fig. 2A, and phenotypic features are shown in Supplemental Fig. 2B. M, macrophages. Data were compiled from two independent experiments (n = 6). *p < 0.05, **p < 0.01, ***p < 0.001. (E) Seric levels of cytokines triggered by BV in CD11c-DTR → WT BM chimeric mice that were previously treated with PBS or DT (24 or 96 h before virus injection). *p < 0.05, **p < 0.01, ***p < 0.001 (NT versus DT, 24 h); $$p < 0.01, $$$p < 0.001 (NT versus DT, 96 h); ##p < 0.01, ###p < 0.001 (DT [24 h] versus DT [96 h]). (B and E) Results are expressed as the means ± SEM and represent cumulative data from four (B) and six (E) mice tested in two independent experiments.
FIGURE 6.
FIGURE 6.
Role of IPS-1, pDCs, and cDCs in the systemic IFN-I response elicited by LCMV. (A) C57BL/6 (WT) and IPS-1−/− mice were infected (i.v.) with LCMVArm. (B) C57BL/6 mice received two i.v. injections (24-h interval) of anti–mPDCA-1 mAbs (or control rat IgG2b). (C) CD11c-DTR → WT BM chimeric mice received PBS or DT (i.p.). (B and C) Twenty-four hours after the first mAb injection (B) or 24 or 72 h after the DT treatment (C) mice were infected (i.v.) with LCMVArm. (A–C) At the indicated times, the levels of IFN-α and IL-12p40 were determined in the sera by ELISA. The results are expressed as the means ± SEM and represent the cumulative data from six mice tested in two independent experiments. (A and B) *p < 0.05, **p < 0.01, ***p < 0.001, ****p < 0.0001. (C) *p < 0.05, **p < 0.01, ****p < 0.0001 (NT versus DT, 24h); #p < 0.05 (NT verus DT, 72 h); §p < 0.05, §§p < 0.01, §§§p < 0.001 (DT [24 h] versus DT [72 h]).
FIGURE 7.
FIGURE 7.
TLR-independent virus-triggered IFN-I production is the key IFN-I source for CTL priming. (A and B) C57BL/6 mice were left untreated or received two i.v. injections (24-h interval) of anti-IFNAR mAbs (or control mouse IgG1) (A) or anti–mPDCA-1 mAbs (or control rat IgG2b) (B). (C) CD11c-DTR → WT chimeric mice were left untreated or treated with a single injection of DT. Twenty-four and 96 h after the DT treatment mice were immunized with BOVAp alone or together with BV. (DF) WT, TLR9−/−, and MyD88−/− mice (D) or Trif+/+ and Trif−/− (E) or STING+/+ and STING−/− littermate mice (F) were immunized with BOVAp alone or together with BV. (A–F) The percentage of OVA-specific CD8 T cells/total CD8 T cell was analyzed at day 7 in the spleen by H-2Kb-OVA257–264-tetramer-PE staining. The results shown are cumulative data from four (A and B) or at least five (C–F) mice tested in two independent experiments. Data from control mice immunized with BOVAp or BV alone are also shown. ***p < 0.001, ****p < 0.0001. (G) WT and IPS-1−/− mice received four i.v. injections (24-h interval) of anti-IFNAR mAbs (or control mouse IgG1) or two i.v. injections (24-h interval) of anti–mPDCA-1 mAbs (or control rat IgG2b). (H) CD11c-DTR → WT chimeric mice were left untreated or treated with a single injection of DT. (G and H) Twenty-four hours after either the first injection of mAb (G) or DT treatment (H), and 72 h after the DT treatment (H), mice were infected (i.v.) with LCMVArm and 15 h later they were immunized (s.c.) with OVAp. The number per microliter of blood of OVA-specific CD8 T cells was determined at day 7 by H-2Kb-OVA257–264-tetramer-PE staining. The results shown are cumulative data from at least four mice tested in two independent experiments. Data from control groups injected with OVAp or LCMVArm alone are also shown. (G) Because mice treated with control mouse IgG1 or rat IgG2a give comparable results, they were plotted together under the IgG alias. *p < 0.05, **p < 0.01, ***p < 0.001, ****p < 0.0001.

Similar articles

Cited by

References

    1. Reis e Sousa C. 2004. Activation of dendritic cells: translating innate into adaptive immunity. Curr. Opin. Immunol. 16: 21–25 - PubMed
    1. Lee H. K., Iwasaki A.. 2007. Innate control of adaptive immunity: dendritic cells and beyond. Semin. Immunol. 19: 48–55 - PubMed
    1. Kolumam G. A., Thomas S., Thompson L. J., Sprent J., Murali-Krishna K.. 2005. Type I interferons act directly on CD8 T cells to allow clonal expansion and memory formation in response to viral infection. J. Exp. Med. 202: 637–650 - PMC - PubMed
    1. Mescher M. F., Curtsinger J. M., Agarwal P., Casey K. A., Gerner M., Hammerbeck C. D., Popescu F., Xiao Z.. 2006. Signals required for programming effector and memory development by CD8+ T cells. Immunol. Rev. 211: 81–92 - PubMed
    1. Santini S. M., Di Pucchio T., Lapenta C., Parlato S., Logozzi M., Belardelli F.. 2002. The natural alliance between type I interferon and dendritic cells and its role in linking innate and adaptive immunity. J. Interferon Cytokine Res. 22: 1071–1080 - PubMed

Publication types

MeSH terms