. 2014 Sep:74:188-199.
doi: 10.1016/j.freeradbiomed.2014.06.016. Epub 2014 Jun 26.

Redox activation of DUSP4 by N-acetylcysteine protects endothelial cells from Cd²⁺-induced apoptosis

Affiliations

Redox activation of DUSP4 by N-acetylcysteine protects endothelial cells from Cd²⁺-induced apoptosis

Alma Barajas-Espinosa et al. Free Radic Biol Med. 2014 Sep.

Abstract

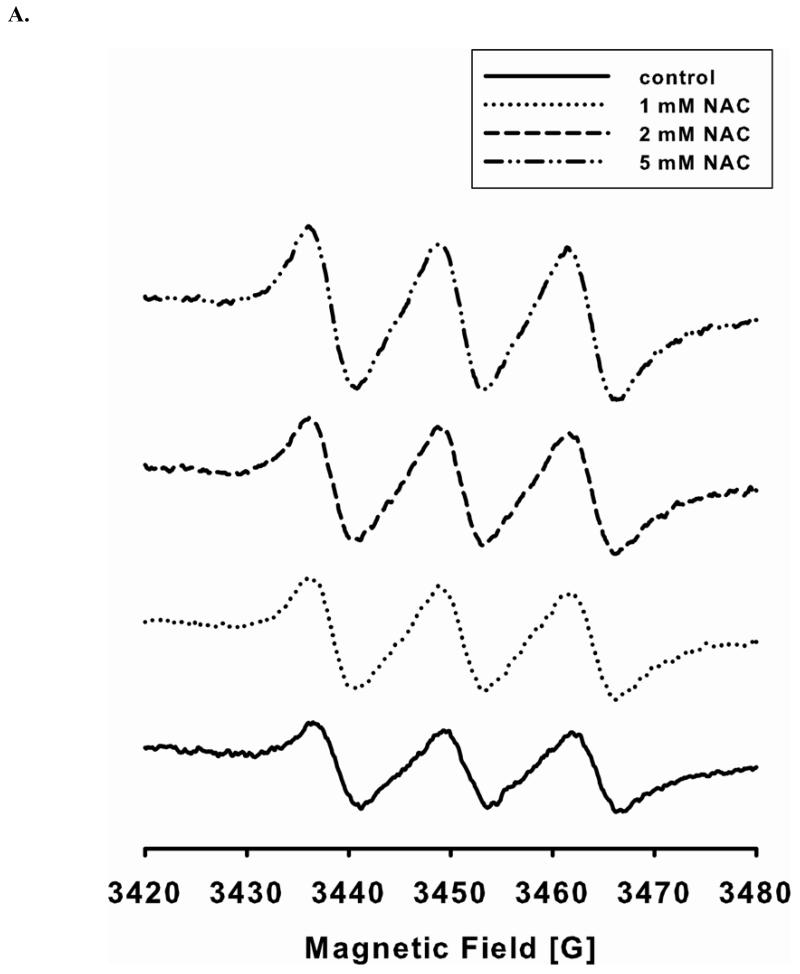
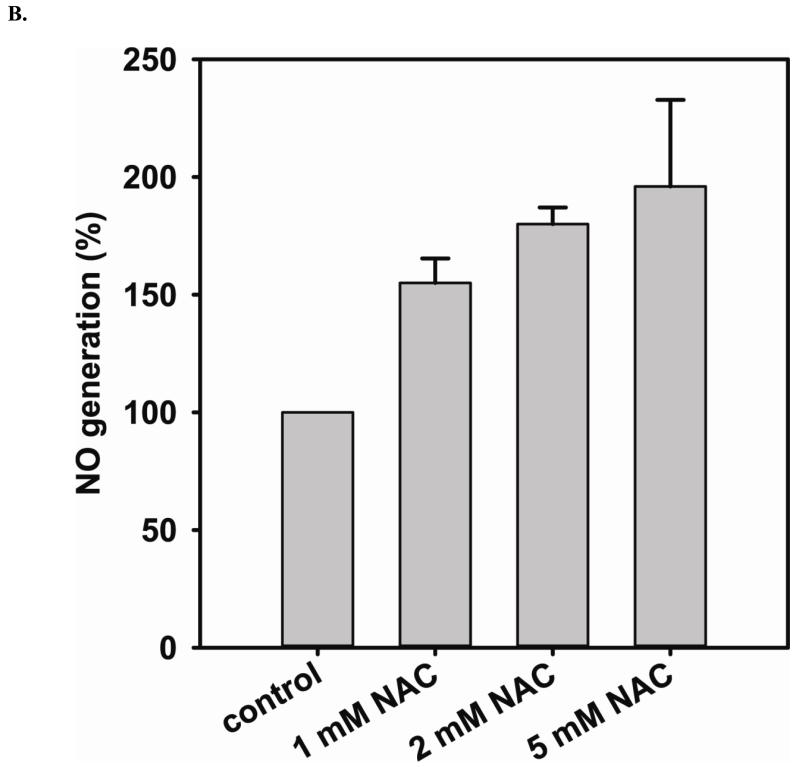
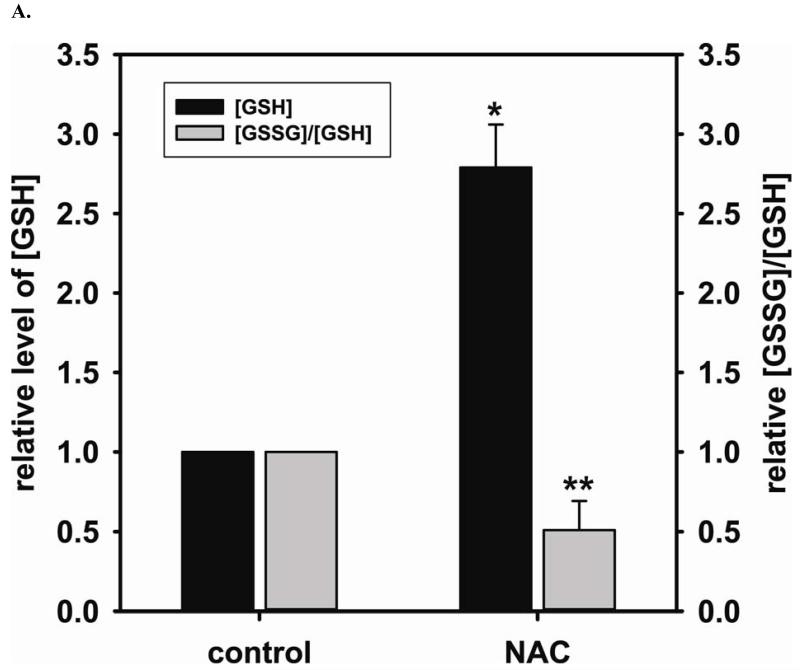
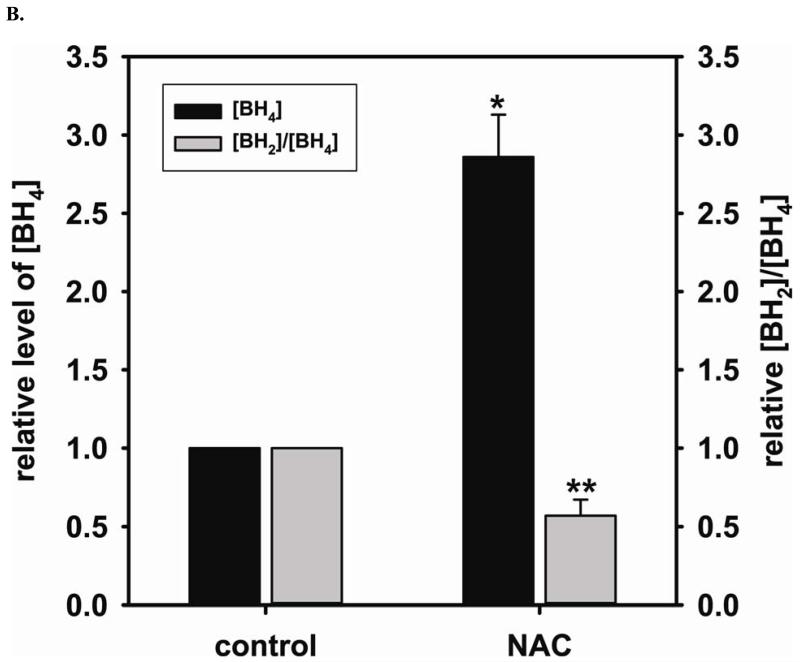
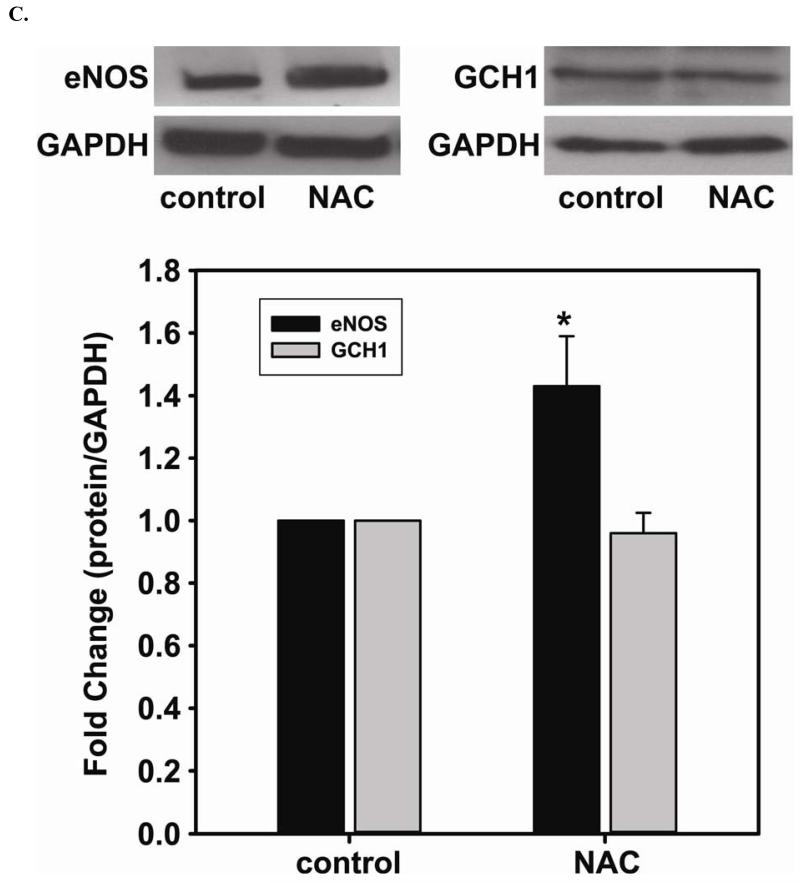
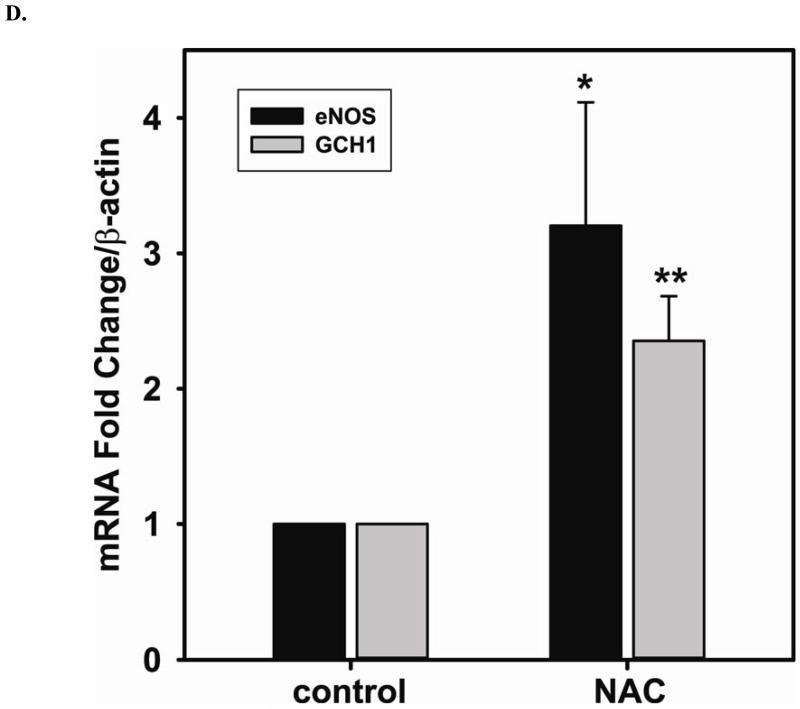
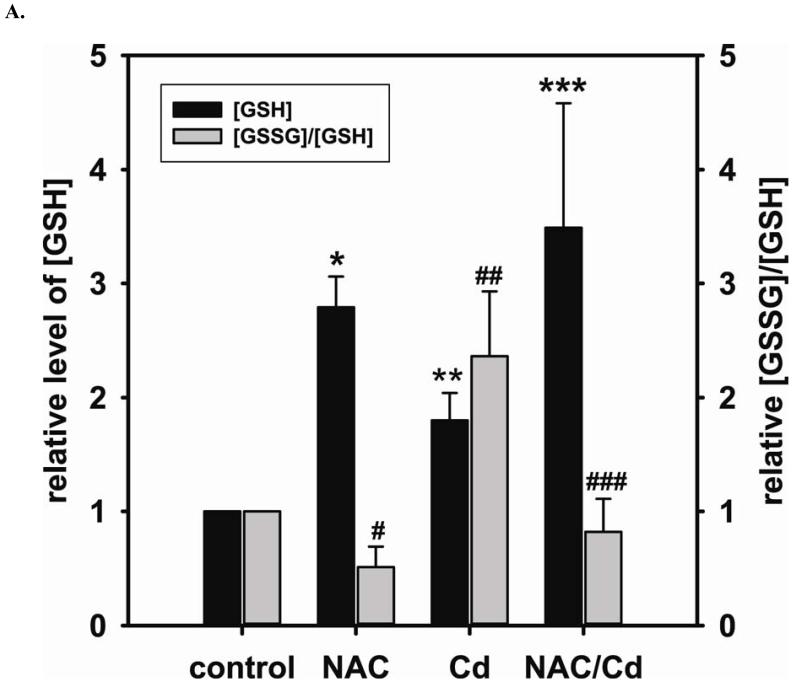
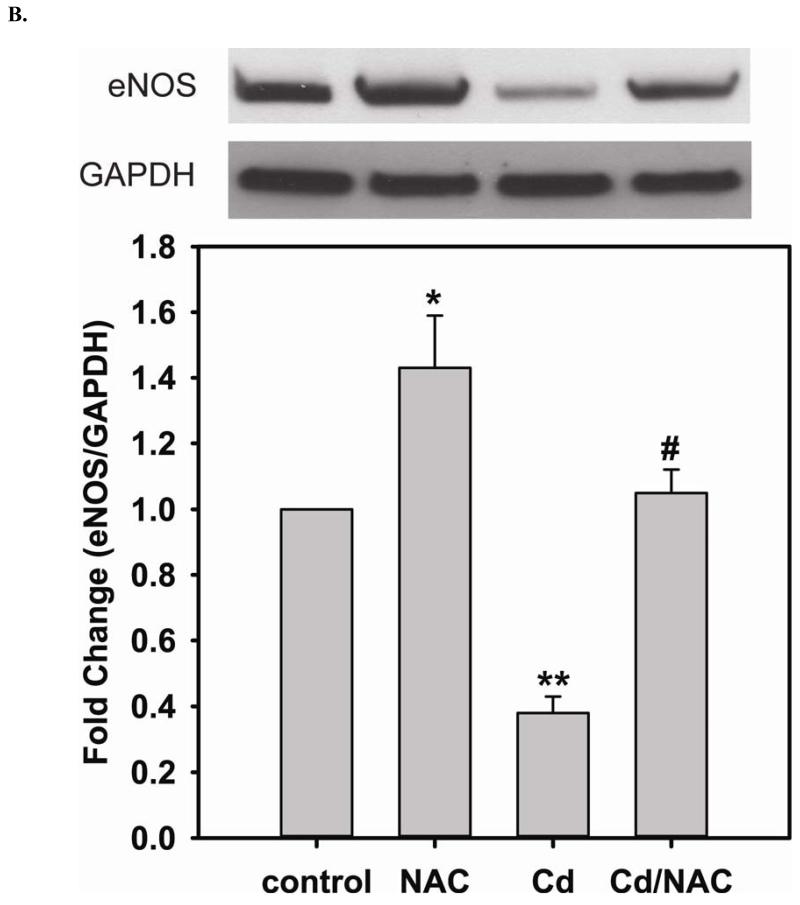
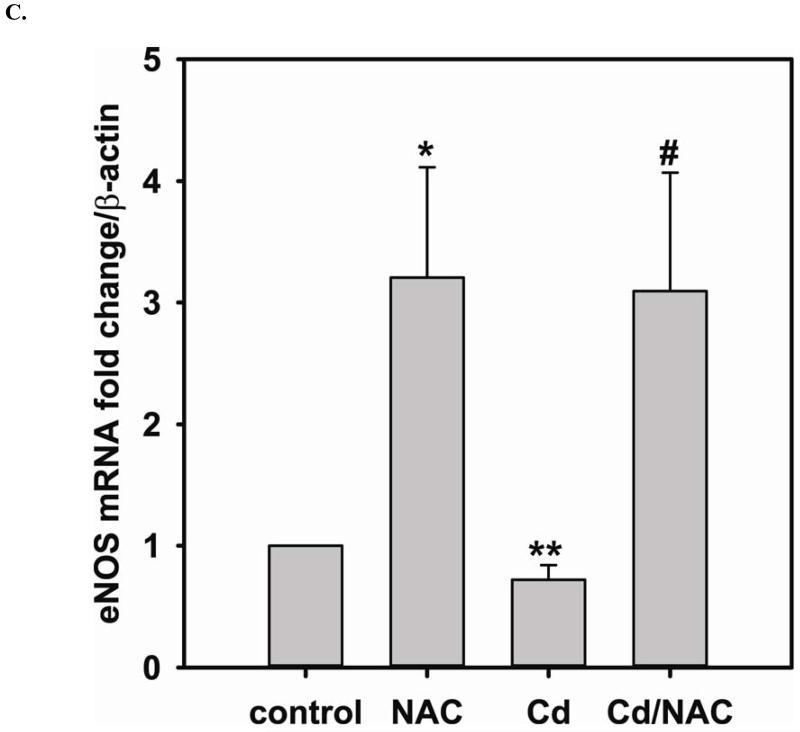
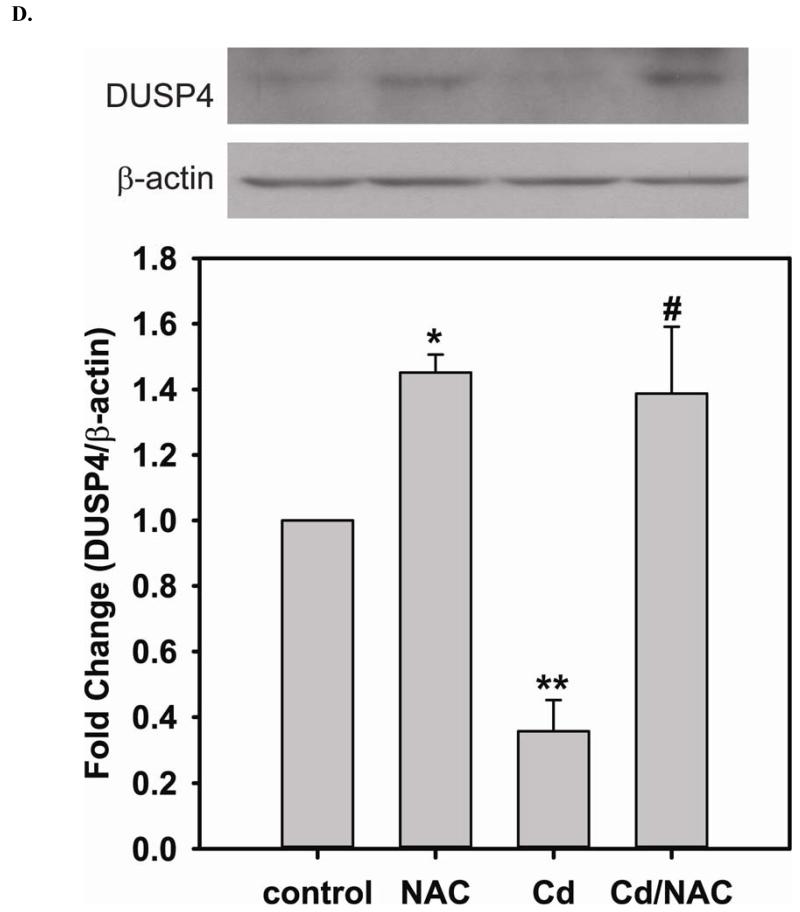
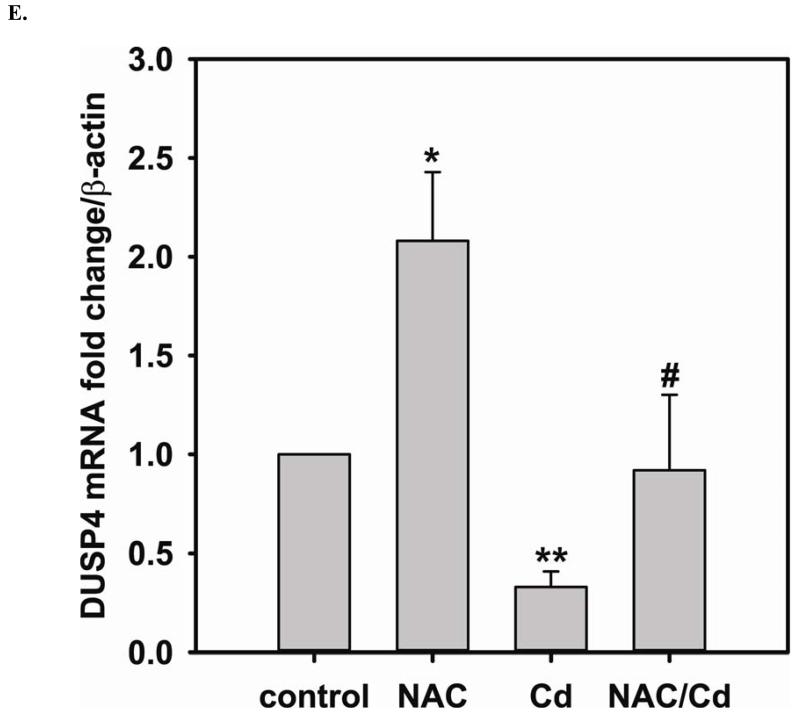
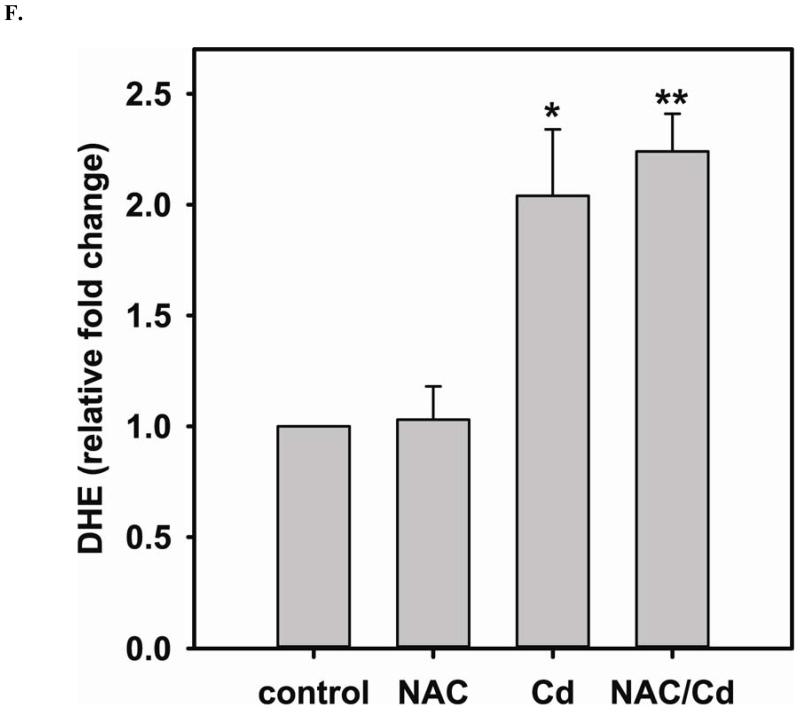
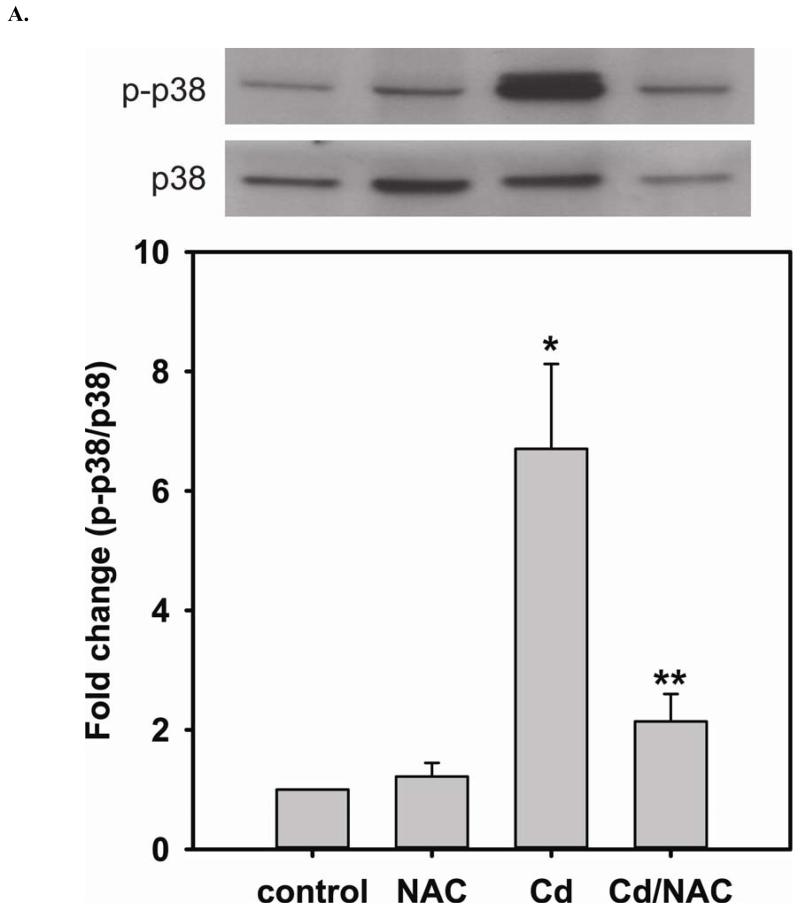
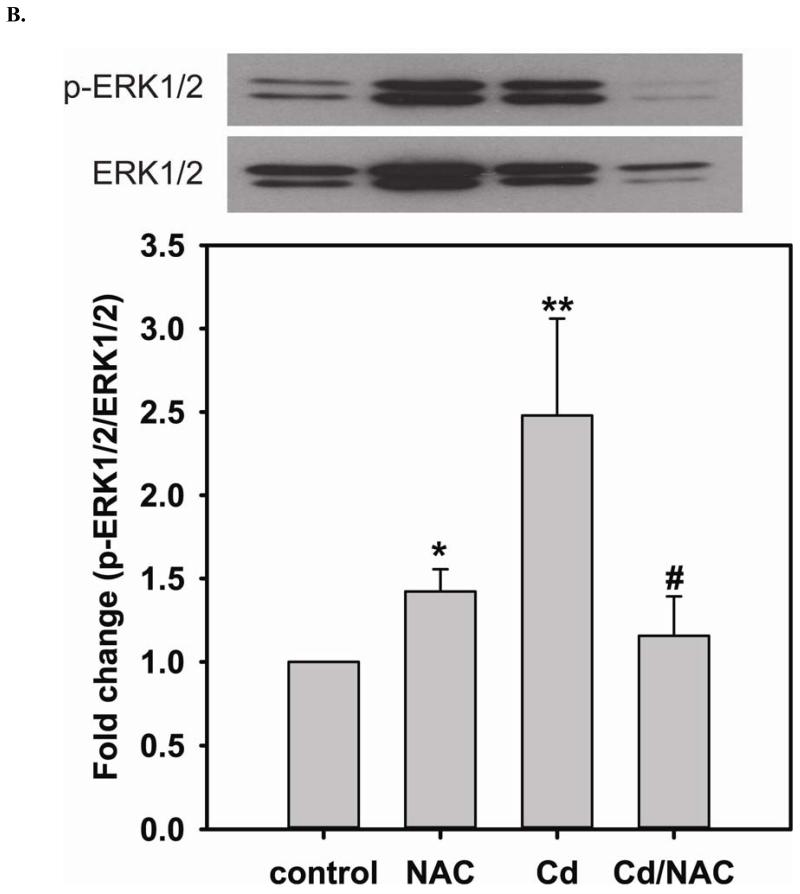
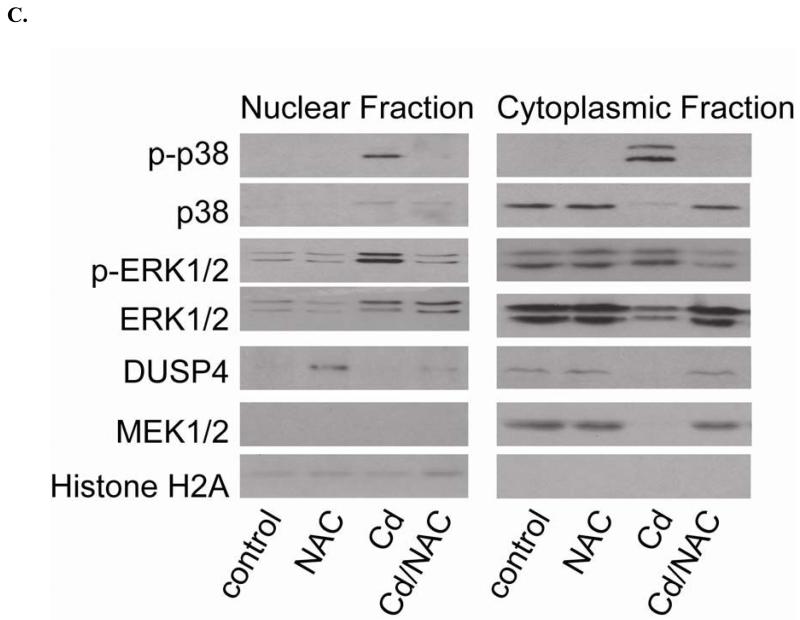
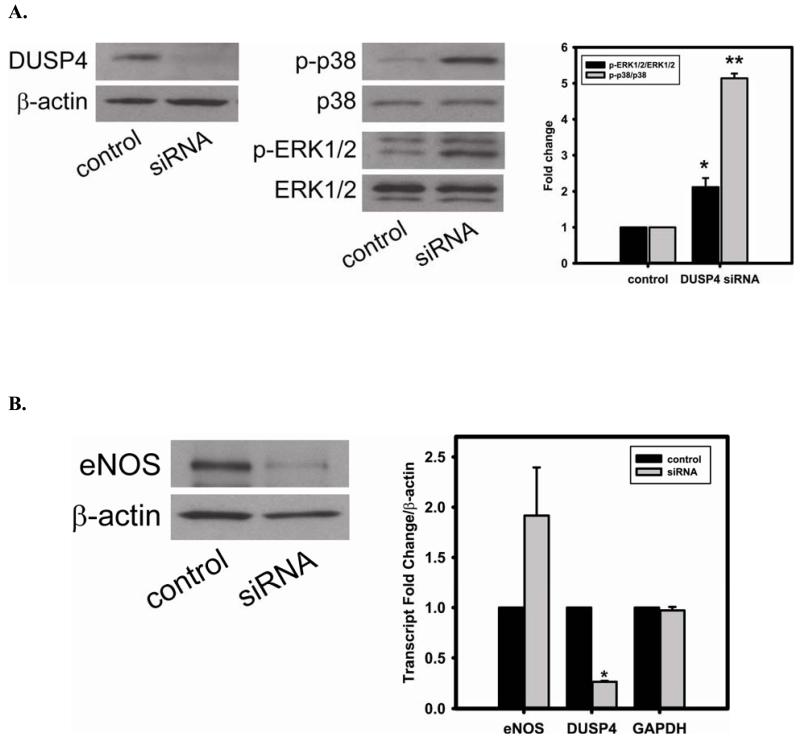
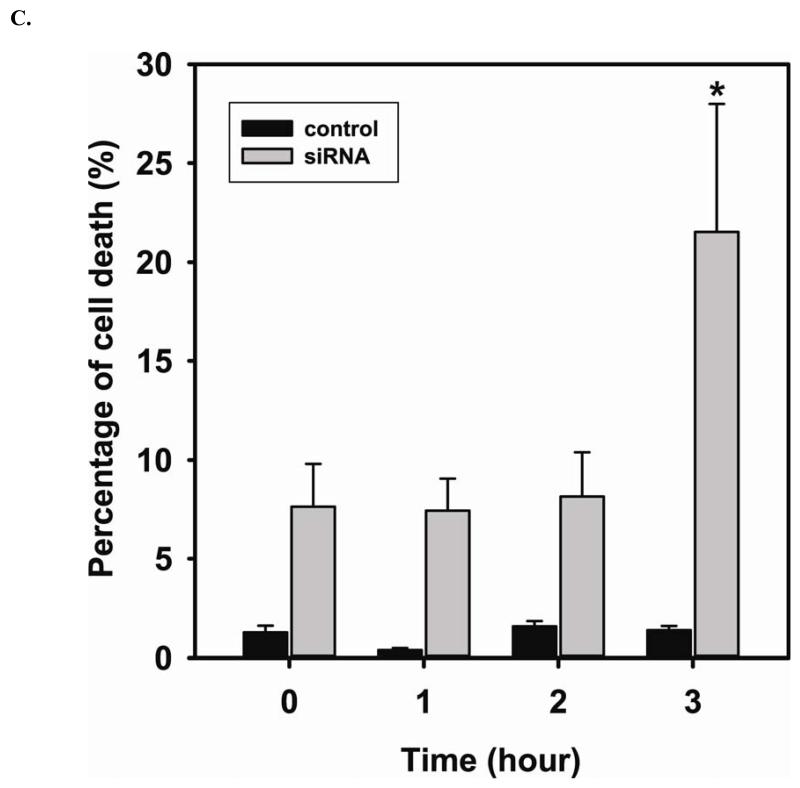
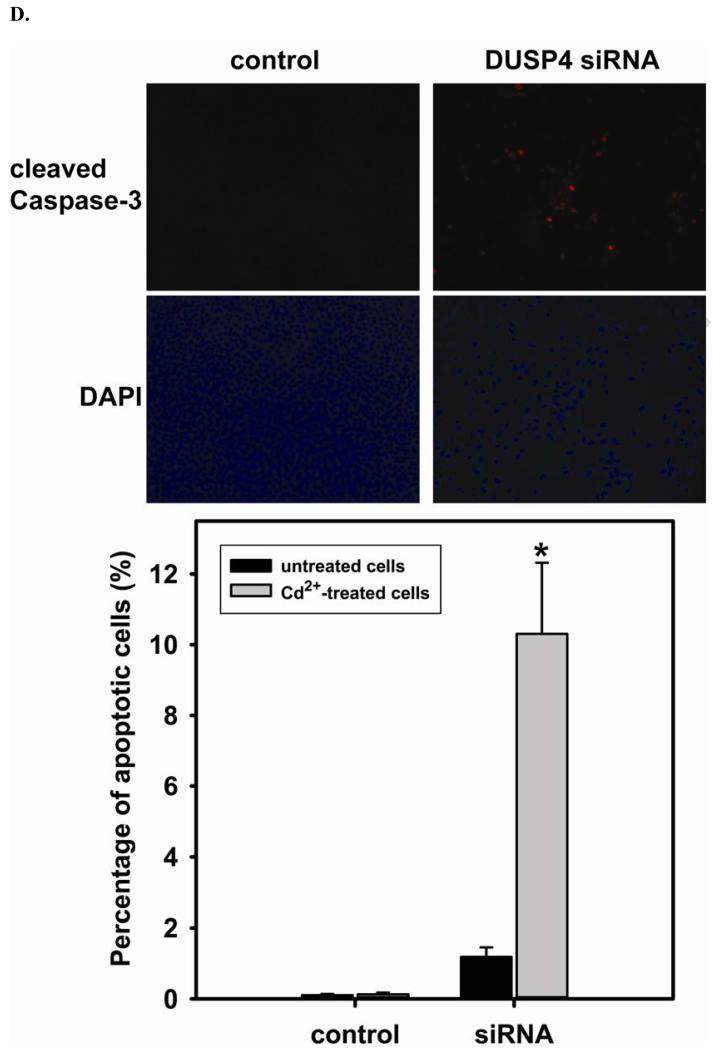
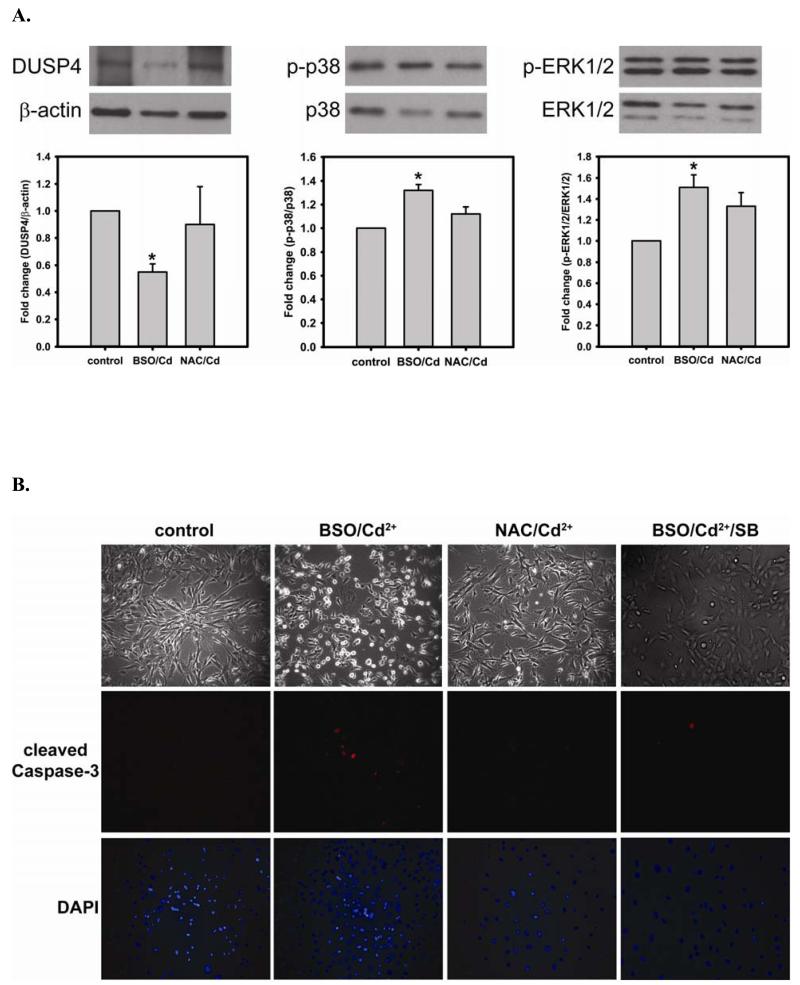
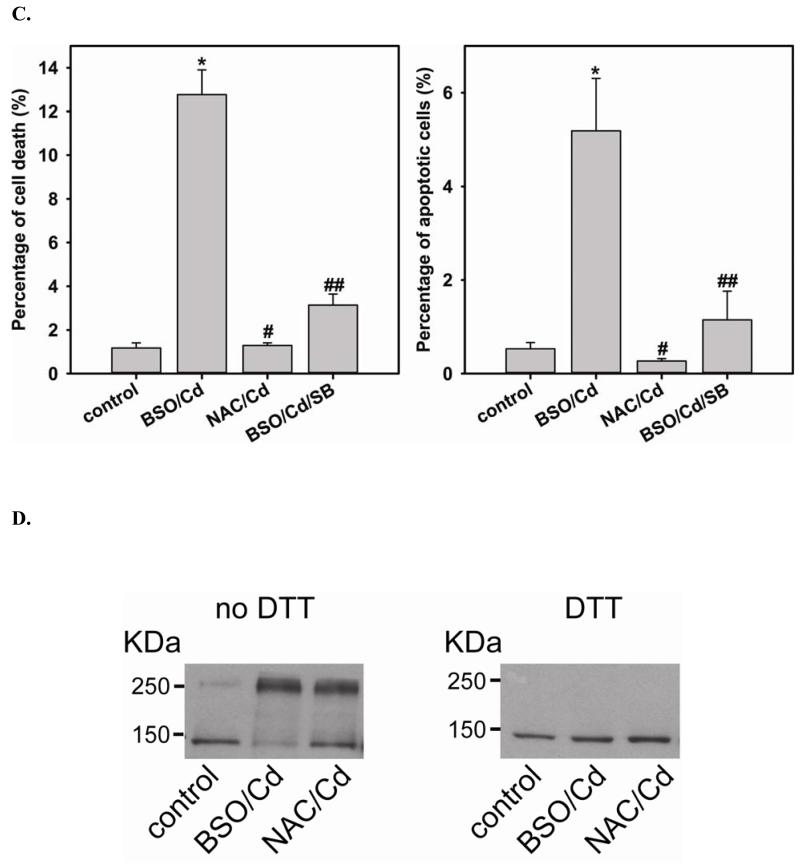
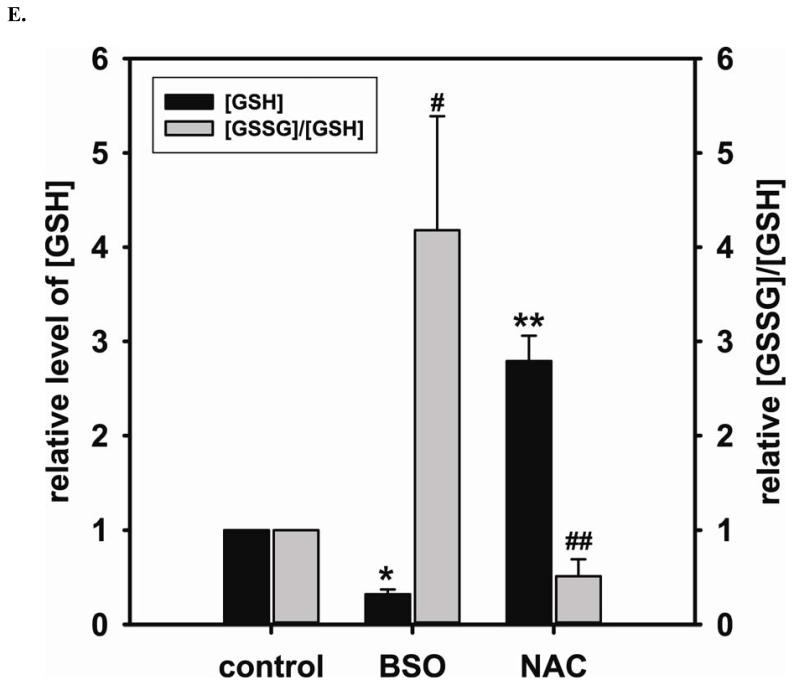
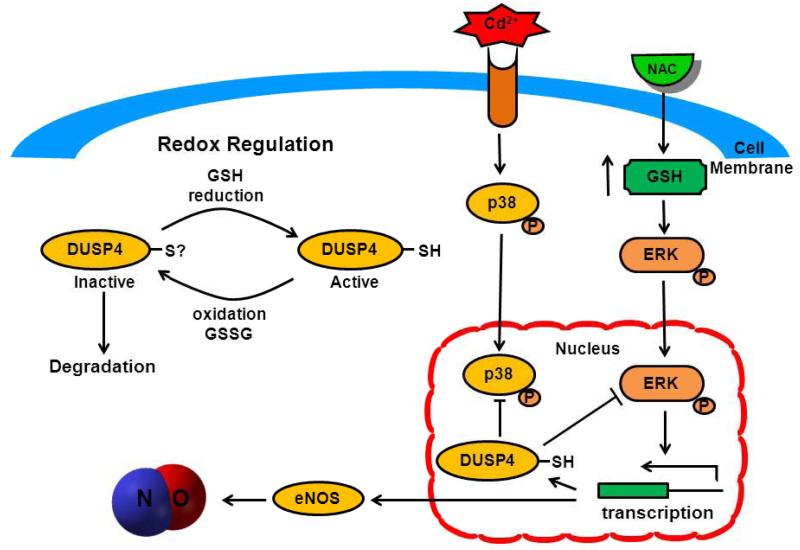
Redox imbalance is a primary cause of endothelial dysfunction (ED). Under oxidant stress, many critical proteins regulating endothelial function undergo oxidative modifications that lead to ED. Cellular levels of glutathione (GSH), the primary reducing source in cells, can significantly regulate cell function via reversible protein thiol modification. N-acetylcysteine (NAC), a precursor for GSH biosynthesis, is beneficial for many vascular diseases; however, the detailed mechanism of these benefits is still not clear. From HPLC analysis, NAC significantly increases both cellular GSH and tetrahydrobiopterin levels. Immunoblotting of endothelial NO synthase (eNOS) and DUSP4, a dual-specificity phosphatase with a cysteine as its active residue, revealed that both enzymes are upregulated by NAC. EPR spin trapping further demonstrated that NAC enhances NO generation from cells. Long-term exposure to Cd(2+) contributes to DUSP4 degradation and the uncontrolled activation of p38 and ERK1/2, leading to apoptosis. Treatment with NAC prevents DUSP4 degradation and protects cells against Cd(2+)-induced apoptosis. Moreover, the increased DUSP4 expression can redox-regulate the p38 and ERK1/2 pathways from hyperactivation, providing a survival mechanism against the toxicity of Cd(2+). DUSP4 gene knockdown further supports the hypothesis that DUSP4 is an antioxidant gene, critical in the modulation of eNOS expression, and thus protects against Cd(2+)-induced stress. Depletion of intracellular GSH by buthionine sulfoximine makes cells more susceptible to Cd(2+)-induced apoptosis. Pretreatment with NAC prevents p38 overactivation and thus protects the endothelium from this oxidative stress. Therefore, the identification of DUSP4 activation by NAC provides a novel target for future drug design.

Keywords: DUSP4; Endothelial dysfunction; Free radicals; MAP kinases; N-acetylcysteine; Nitric oxide synthase; Phosphatase; Reactive oxygen species; Redox signaling.


Figures

FIGURE 1
FIGURE 1. NAC treatment enhances endothelial cell NO production
A and B. NO generation from BAECs was measured by EPR spin-trapping using Fe2+-MGD. NAC treatment increases NO generation in a dose-dependent fashion. When cells are treated with 5 mM NAC, the level of NO generation from cells is increased by two-fold compared to untreated. 1 mM L-NAME is used to inhibit intracellular eNOS activity, and it is used as the zero point. Data are expressed as mean ± SEM (P < 0.05 vs. control), n=3.
FIGURE 2
FIGURE 2. The beneficial effects of NAC treatment in BAECs
NAC (5 mM) treatment enhances NO generation from cells correlates with an increase in GSH and BH4, a critical cofactor of eNOS. A. 5 mM NAC treatment increases the level of GSH (2.7 ± 0.27 fold compared to the untreated cells (2.06 ± 0.68 nmol/mg protein)), and decreases [GSSG]/[GSH] ratio (0.51 ± 0.18 fold compared to the untreated cells) determined by HPLC (* P < 0.001 versus control and ** P < 0.05 versus control). B. 5 mM NAC treatment increases the level of BH4 (2.86 ± 0.27 fold compared to the untreated cells (11.20 ± 3.02 nmol/mg protein)) and decreases the ratio of [BH2]/[BH4] (0.57 ± 0.10 fold compared to the untreated cells) determined by HPLC. (* P < 0.001 versus control and ** P < 0.05 versus control) C. Left: Upper panel is immunoblot of eNOS. Lower panel is immunoblot of GAPDH as an internal standard. Right: Upper panel is immunoblot of GCH1. Lower panel is immunoblot of GAPDH as an internal standard. NAC treatment up-regulates eNOS expression, but not GCH1, as determined via immunoblotting analysis. 5 mM NAC increases eNOS expression by 1.43 ± 0.16 fold compared to the untreated cells (* P < 0.001 vs. control). D. Relative gene quantification of transcripts for eNOS and GCH1 are up-regulated by NAC treatment of BAECs. Using -actin as the reference gene, and normalizing data to the control cells, relative mRNA for eNOS and GCH1 are all increased by 5 mM NAC treatment (3.21 ± 0.91 fold and 2.35 ± 0.33 fold n ≥ 3;* and ** P < 0.05 versus control, respectively). Data are expressed as mean ± SEM, n ≥ 3.
FIGURE 3
FIGURE 3. Long-term exposure to Cd2+ leads to the degradation of eNOS and DUSP4 while NAC treatment promotes their transcription and prevents protein degradation, providing a protective effect in BAECs
A. NAC treatment protects endothelial cells from Cd2+-induced oxidative stress via the increase intracellular GSH and the decrease in [GSSG]/[GSH] ratio. The intracellular GSH and the ratio of [GSSG]/[GSH] are determined by HPLC. Long-term Cd2+ exposure dramatically increased intracellular [GSSG]/[GSH] ratio. NAC treatment reversed this oxidative stress. Data are expressed as mean ± SEM, n ≥ 3; P < 0.05 versus control. B. Upper panel is the immunoblotting against eNOS. Lower panel is the immunoblotting for GAPDH, the loading control. Densitometric analysis of the immunoblots reveals that long-term exposure to 100 μM Cd2+ leads to eNOS degradation (0.38 ± 0.05 fold change versus control; ** P < 0.001). NAC treatment prevents this Cd2+-induced eNOS degradation. C. NAC increases eNOS transcription. Overnight treatment with NAC leads to a significant increase in eNOS transcription (3.21 ± 0.91 fold increase versus control; * P < 0.05), and NAC co-treatment with Cd2+ (3.09 ± 0.98 fold versus control; # P < 0.05) was able to rescue the Cd2+-induced degradation in eNOS mRNA (0.72 ± 0.12 fold of control; ** P < 0.01). D. Upper panel is the immunoblotting against DUSP4. Lower panel is the immunoblotting for β-actin, the loading control. Long-term exposure to 100 μM Cd2+ leads to DUSP4 degradation (0.36 ± 0.09 fold change versus control; ** P < 0.05). NAC treatment reverses this Cd2+-induced degradation. All experiments were performed at least in triplicate. E. NAC treatment promotes DUSP4 transcription in endothelial cells. The effect of NAC/Cd2+ treatment on DUSP4 transcription closely mirrored that seen in the protein blotting. NAC doubled DUSP4 mRNA (2.08 ± 0.35 fold versus control; * P < 0.01) whereas Cd2+ less than halved it (0.33 ± 0.08 fold; ** P < 0.001). However, unlike the protein effect, co-treatment with NAC and Cd2+ only returned DUSP4 mRNA to control level. F. Measurement of superoxide from endothelial cells. Cd2+ exposure induced cellular superoxide generation (2.04 ± 0.30 fold versus control; * P < 0.05); however, NAC treatment did not diminish Cd2+-induced superoxide generation (2.24 ± 0.17 fold versus control; ** P< 0.005).
FIGURE 4
FIGURE 4. NAC treatment prevents Cd2+-induced hyper-phosphorylation of p38 and ERK1/2 in BAECs
A. Upper panel is the immunoblotting against p-p38. Lower panel is the immunoblotting for p38. The ratio of p-p38/p38 is used to determine the extent of p38 phosphorylation. Cell exposure to 100 μM Cd2+ leads to the hyper-phosphorylation of p38. Co-treatment with 5 mM NAC reverses the phosphorylation of p38. * versus control; P < 0.05, and ** versus Cd2+ treatment; P < 0.05. B. Upper panel is the immunoblotting against p-ERK1/2. Lower panel is the immunoblotting for ERK1/2. The ratio of p-ERK1/2/ERK1/2 is used to determine the extent of ERK1/2 phosphorylation. 5 mM NAC treatment significantly enhances the phosphorylation of ERK1/2. With exposure to 100 μM Cd2+, the phosphorylation of ERK is further increased. Treatment with 5 mM NAC reverses the Cd2+-induced ERK1/2 phosphorylation. * and ** versus control; P < 0.05, and # versus Cd2+ treatment; P < 0.01. Data were expressed as mean ± SEM, n=3. C. Subcellular fractionation. NAC promotes DUSP4 expression in the nucleus, where it can redox regulate p38 and ERK1/2 signaling and serve as a protective mechanism. Left are immunoblots of nuclear fraction, and right are immunoblots of cytoplasmic fraction.
FIGURE 5
FIGURE 5. DUSP4-dependent eNOS expression, and the modulation of p38 and ERK1/2 signal cascades in RAECs
A. DUSP4 gene silencing. Left: The efficiency of DUSP4 gene silencing is greater than 80% as determined by immunoblotting against DUSP4, with β-actin as a loading control. Middle: DUSP4 gene silencing contributes to the over-activation of both p38 (upper panel) and ERK1/2 (lower panel). Right: Fold change of the ratio of p-ERK1/2/ERK1/2 (2.12 ± 0.25 fold versus control; * P < 0.05) and p-p38/p38 (5.14 ± 0.13 fold versus control; ** P < 0.0001). B. DUSP4 gene silencing leads to a decrease in eNOS expression (0.55 ± 0.12 fold versus control; P < 0.05) via the translational modulation. Left: immunoblotting of eNOS and β-actin as a loading control. Right: Quantitative mRNA analysis of eNOS, DUSP4, and GAPDH using β-actin as an internal control. DUSP4 siRNA only affects DUSP4 gene expression (0.27 ± 0.01 fold versus control; * P < 0.0001), but not eNOS or GAPDH. C. Time course of cell death during 3 hr Cd2+ exposure. Rat endothelial cells with DUSP4 knockdown are more susceptible to Cd2+-induced death. Greater cell death is seen in cells with DUSP4 gene silencing compared to control cells after 3 hr Cd2+ exposure (21.54% ± 6.46% versus control; * P < 0.05). D. Immunostaining against cleaved caspase-3. Rat endothelial cells with DUSP4 knockdown are susceptible to Cd2+-induced apoptosis. More cleaved caspase-3 positive is seen in cells with DUSP4 gene silencing compared to control cells after 3 hr Cd2+ exposure (10.31% ± 2.01% versus control; * P < 0.05).
FIGURE 6
FIGURE 6. Intracellular GSH is important for DUSP4 stability and activity, and protects BAECs against short-term Cd2+-induced apoptosis
A. Left: Immunoblots of DUSP4 and β-actin as a loading control. Depletion of GSH by BSO increases the Cd2+-induced DUSP4 degradation (0.55 ± 0.06 fold versus control; * P < 0.005). NAC pre-treatment prevents this. Middle: Immunoblots of p-p38 and p38. Depletion of GSH by BSO leads to the over-activation of p38 (1.32 ± 0.05 fold versus control; * P < 0.005). Right: Immunoblots of p-ERK1/2 and ERK1/2. Depletion of GSH by BSO also leads to the over-activation of ERK1/2 (1.51 ± 0.12 fold versus control; * P < 0.05). B. Upper panel is the live cell image using Zeiss Axiovert 135 microscope. When intracellular GSH is depleted by BSO, cells become hyper-sensitive to 2hr Cd2+-induced death. 5 mM NAC pre-treatment protects cells against Cd2+-induced death. Middle panel is the immunostaining against cleaved caspase-3. GSH depletion increases apoptosis. NAC pre-treatment prevents cells from Cd2+-induced apoptosis. Addition of 10 μ SB 203580, a p38 inhibitor, significantly reverses this Cd2+-induced apoptosis. Lower panel is DAPI nuclear staining. C. Left: Percentage of cell death. NAC pretreatment protects endothelial cells from Cd2+-induced death. Addition of SB 203580 significantly protects cells from this oxidative stress. (12.77% ± 1.13%; * P < 0.001 versus control; 1.28% ± 0.12% and 3.13% ± 0.51%, respectively; # and ## P < 0.001 versus BSO/Cd). Right: Percentage of apoptotic cells. Depletion of GSH by BSO increases apoptosis (5.19% ±1.1%; *P < 0.01, versus control). This process can be reversed by either the pre-treatment of NAC or addition of p38 inhibitor, SB 203580 (0.27% ± 0.05% and 1.15% ± 0.61%; # and ## P < 0.01, versus BSO/Cd). D. Depletion of GSH by BSO increases cellular oxidative stress contributing to eNOS inter-disulfide bond formation. Left: Non-reduced immnuoblotting against eNOS shows that BSO increases eNOS dimerization via inter-disulfide bond formation, and NAC pre-treatment prevents this thiol oxidation. Right: Incubation with DDT shows eNOS is in its monomer form. E. Cellular level of GSSG and GSH measured by HPLC. BSO inhibits GSH synthesis (0.32 ± 0.05 fold versus control, * P < 0.001), and enhances intracellular [GSSG]/[GSH] ratio (4.18 ± 1.21 fold versus control, # P < 0.05). NAC promotes GSH synthesis (2.79 ± 0.27 fold versus control, ** P < 0.001), and lowers the ratio of [GSSG]/[GSH] (0.51 ± 0.18 fold versus control, ## P < 0.05).
FIGURE 7
FIGURE 7. Mechanism of the beneficial effects of NAC treatment
ERK1/2 activation by NAC promotes transcription leading to the overexpression of DUSP4 and eNOS. NAC also enhances intracellular GSH, which can maintain eNOS in its reduced state and DUSP4 in its active form, and prevent BH4 from oxidation. Therefore, NAC treatment increases NO generation from cells providing a beneficial effect. The increase in DUSP4 expression actively regulates ERK1/2 signaling, thus prevents it from over-activation. Cd2+ induces oxidative stress and with the increase in cellular level of GSSG, which can contribute to protein oxidative modification and degradation. The degradation of DUSP4 leads to the hyper-activation of p38 and ERK1/2, which ultimately induces apoptosis.

References

    1. Forstermann U. Nitric oxide and oxidative stress in vascular disease. Pflugers Archiv : European journal of physiology. 2010;459:32–939. - PubMed
    1. Xiong Y, Uys JD, Tew KD, Townsend DM. S-glutathionylation: from molecular mechanisms to health outcomes. Antioxidants & redox signaling. 2011;15:32–270. - PMC - PubMed
    1. Sabens Liedhegner EA, Gao XH, Mieyal JJ. Mechanisms of altered redox regulation in neurodegenerative diseases--focus on S--glutathionylation. Antioxidants & redox signaling. 2012;16:32–566. - PMC - PubMed
    1. Zweier JL, Chen CA, Druhan LJ. S-glutathionylation reshapes our understanding of endothelial nitric oxide synthase uncoupling and nitric oxide/reactive oxygen species-mediated signaling. Antioxidants & redox signaling. 2011;14:32–1775. - PMC - PubMed
    1. Schafer FQ, Buettner GR. Redox environment of the cell as viewed through the redox state of the glutathione disulfide/glutathione couple. Free Radic Biol Med. 2001;30:1191–1212. - PubMed

Publication types

MeSH terms

LinkOut - more resources