. 2014 Aug;15(8):767-76.
doi: 10.1038/ni.2928. Epub 2014 Jun 29.

Id2 and Id3 maintain the regulatory T cell pool to suppress inflammatory disease

Affiliations

Id2 and Id3 maintain the regulatory T cell pool to suppress inflammatory disease

Masaki Miyazaki et al. Nat Immunol. 2014 Aug.

Abstract

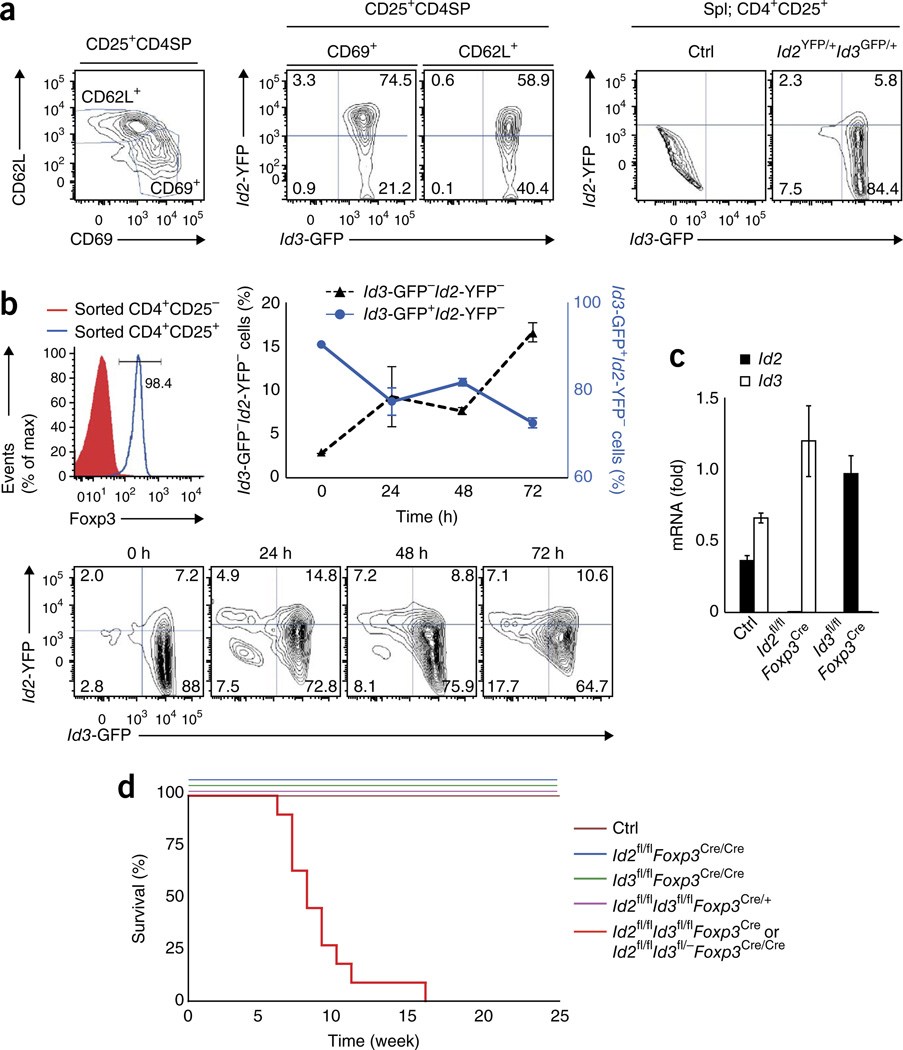
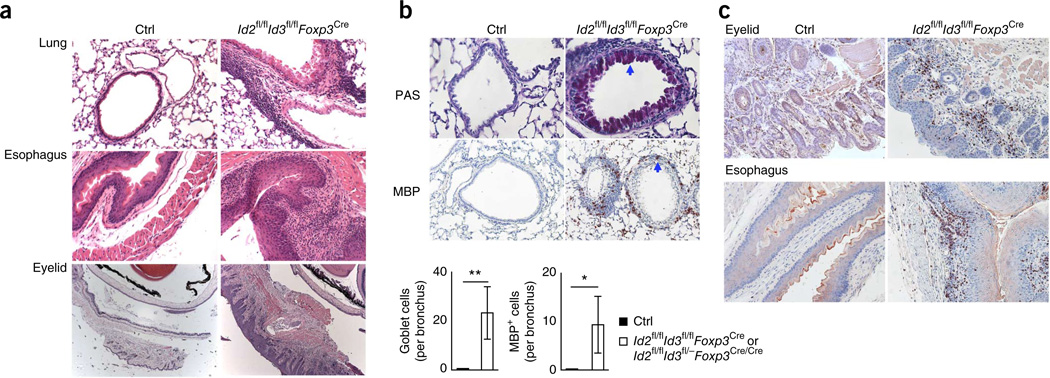
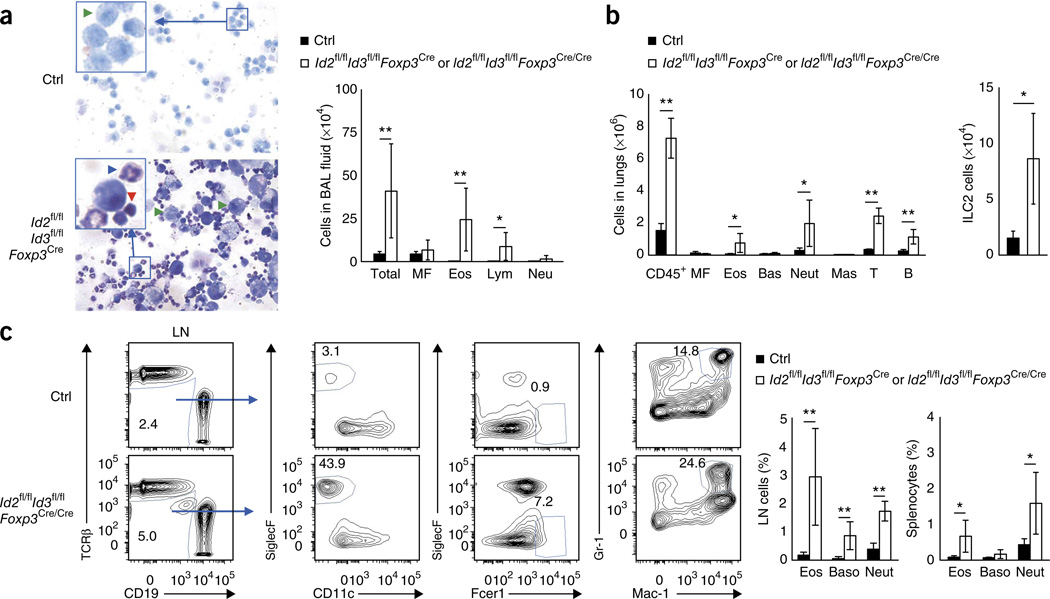
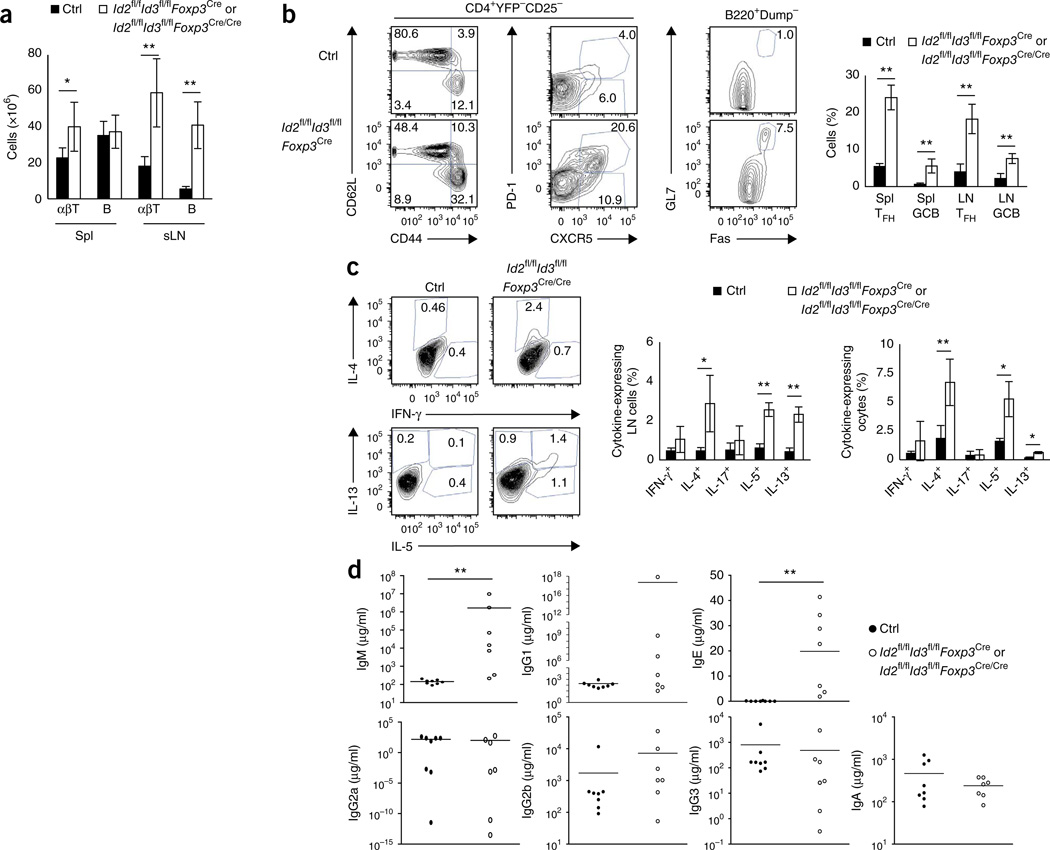
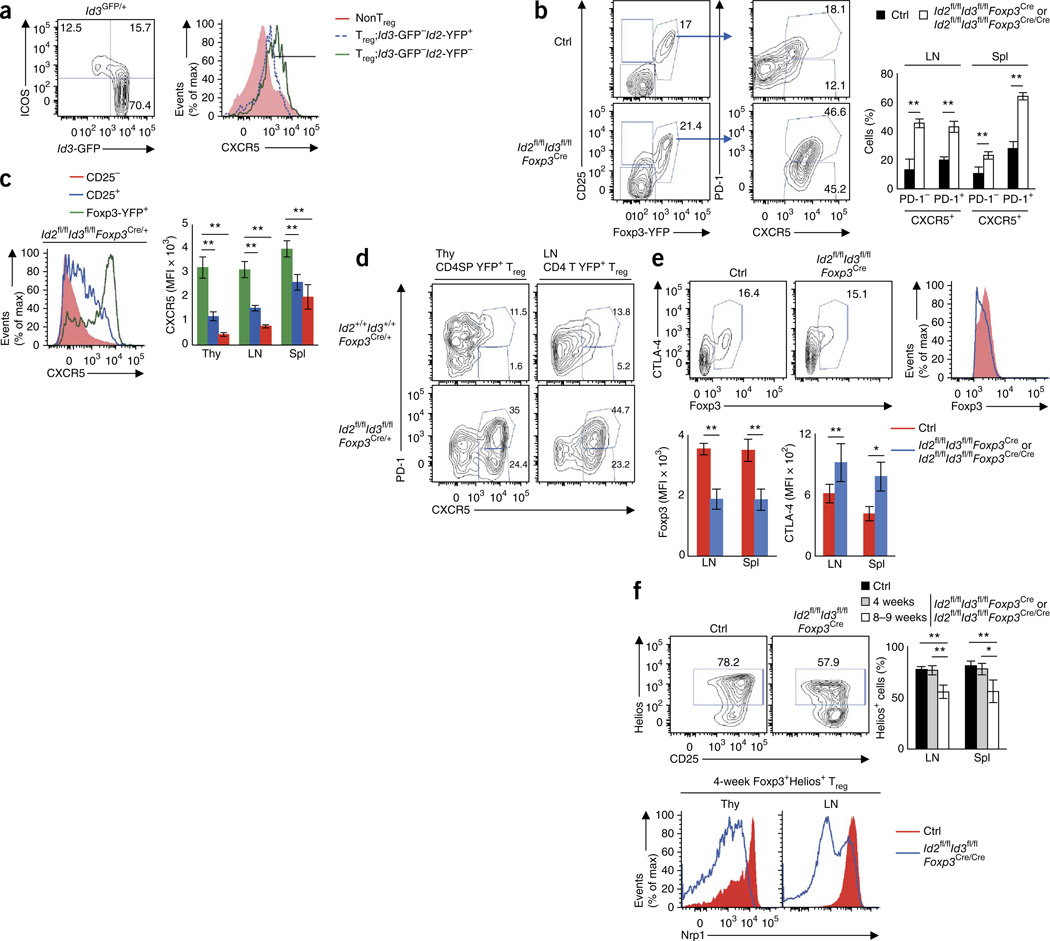
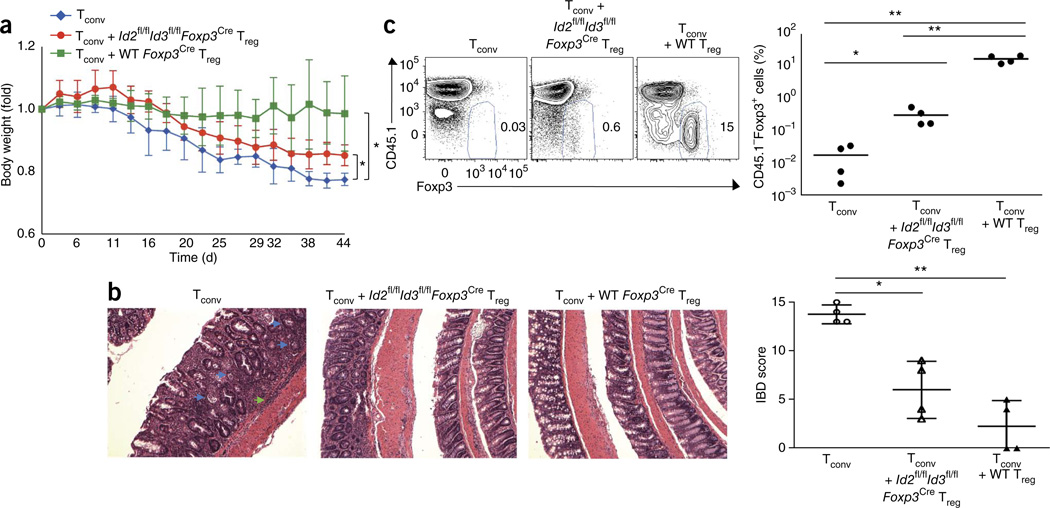
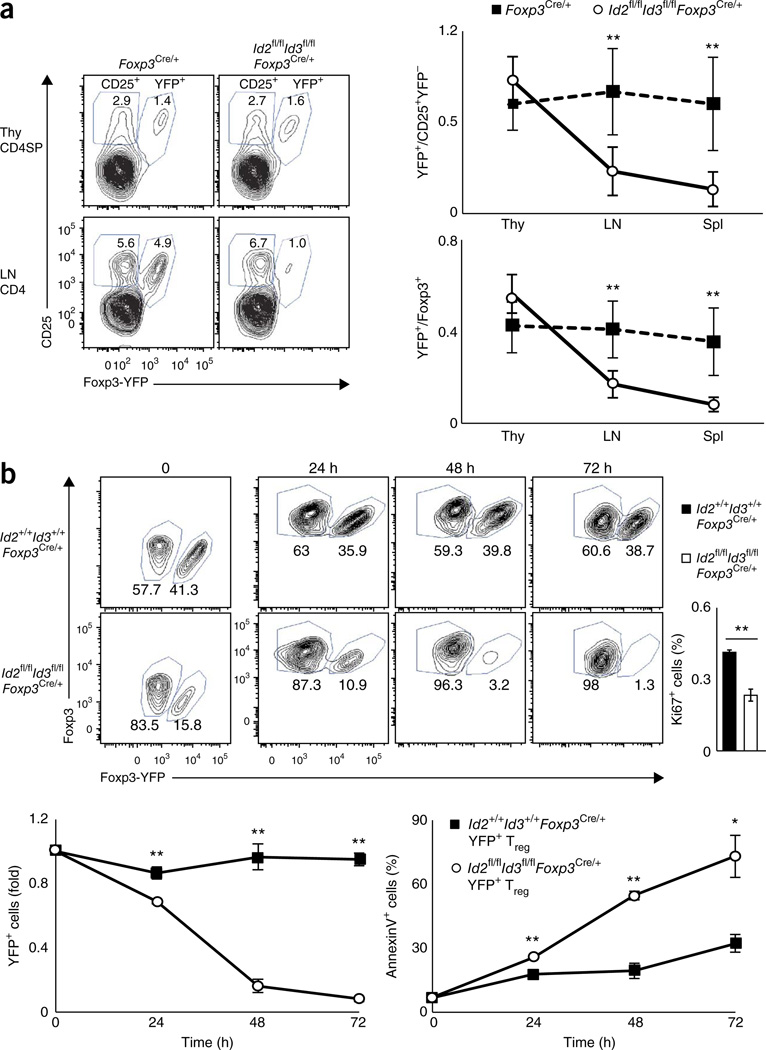
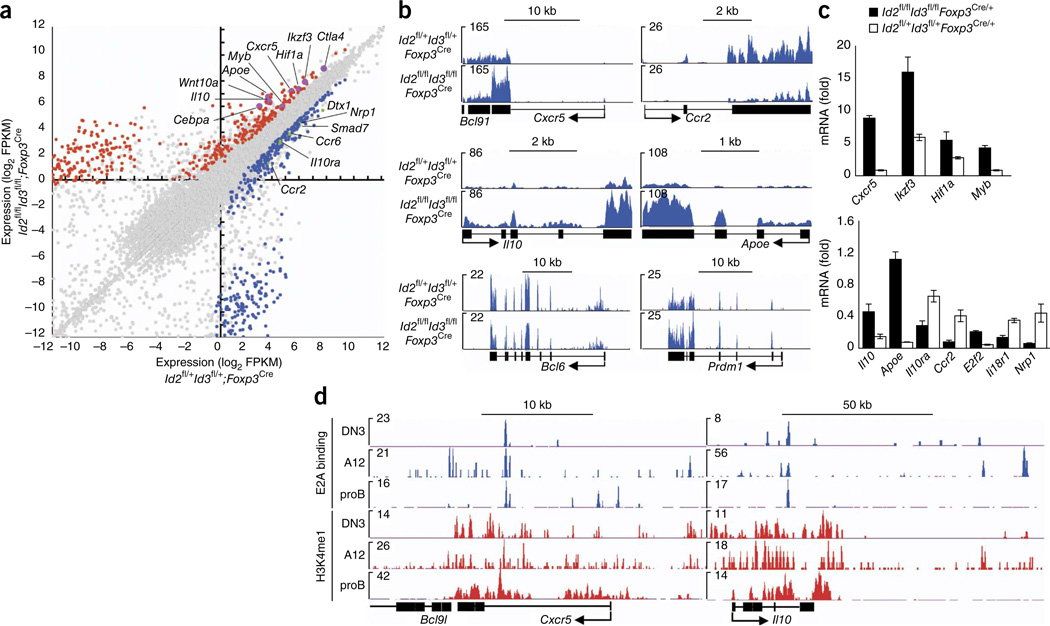
Regulatory T (Treg) cells suppress the development of inflammatory disease, but our knowledge of transcriptional regulators that control this function remains incomplete. Here we show that expression of Id2 and Id3 in Treg cells was required to suppress development of fatal inflammatory disease. We found that T cell antigen receptor (TCR)-driven signaling initially decreased the abundance of Id3, which led to the activation of a follicular regulatory T (TFR) cell-specific transcription signature. However, sustained lower abundance of Id2 and Id3 interfered with proper development of TFR cells. Depletion of Id2 and Id3 expression in Treg cells resulted in compromised maintenance and localization of the Treg cell population. Thus, Id2 and Id3 enforce TFR cell checkpoints and control the maintenance and homing of Treg cells.


Figures

Figure 1
Figure 1
Ablation of Id2 and Id3 expression in Treg cells leads to the early onset of fatal inflammatory disease. (a) Flow cytometric analysis of CD69 versus CD62L expression gated on the CD4+CD25+ Treg cell population derived from the thymus (CD4+CD25+CD8TCRβhi (left). CD4SP, CD4+CD8. GFP versus YFP expression, gated on CD69+CD62L or CD69CD62L+ Treg cells derived from the thymus (middle). GFP versus YFP expression in CD4+CD25+ Treg cells isolated from the spleens (Spl) of control and Id2YFP/+Id3GFP/+ mice (right). Numbers in quadrants indicate percent cells in each compartment. (b) Flow cytometric analysis of Foxp3 expression on sorted CD4+CD25+ and CD4+CD25 T cells (left; number indicates the percentage of Foxp3+ cells gated on the CD4+CD25+ T cells); sorted CD4+CD25+ Treg cells from Id2YFP/+Id3GFP/+ mouse (CD45.2) were cocultured with CD4+CD25 T cells (CD45.1) and stimulated with anti-CD3ε plus anti-CD28 in the presence of T cell–depleted splenocytes (APCs). Flow cytometric analysis of GFP versus YFP expression gated on CD45.2+CD45.1CD4+TCRβ+CD25+ cells for the indicated time points (bottom). Percentage of Id3-GFP+Id2-YFP cells and Id3-GFPId2-YFPcells (middle). (c) Quantitative real-time PCR analysis of Id2 and Id3 transcript levels in sorted CD4+TCRβ+CD25+YFP+ Treg cells derived from the lymph nodes of Id2+/+Id3+/+Foxp3Cre (Ctrl), Id2fl/flFoxp3Cre or Id3fl/flFoxp3Cre mice. (d) Survival plot of Id2fl/flId3fl/flFoxp3Cre and Id2fl/flId3fl/−Foxp3Cre/CreId2fl/flFoxp3Cre/CreId3fl/flFoxp3Cre/CreId2fl/flId3fl/flFoxp3Cre/+ and littermate control (Ctrl) mice, monitored during a 25-week period. Data are representative of two experiments (a,b; error bars in b, s.d.; n = 3 technical replicates), one experiment (c; error bars, s.d.; n = 3 technical replicates) and one experiment (d; n = 11 independent biological replicates per group).
Figure 2
Figure 2
Spontaneous inflammation in the lung, eyelid, skin and esophagus in mice depleted for the expression of Id2 and Id3 in Treg cells. (a) Hematoxylin and eosin (H&E) staining of the lung, esophagus and eyelid derived from control (Ctrl; female Id2fl/flId3fl/flFoxp3Cre/+) and Id2fl/flId3fl/flFoxp3Cre mice. Original magnification: ×200 (lung), ×200 (esophagus) and ×50 (eyelid). (b) Periodic acid Schiff (PAS) staining and MBP immunostaining of lungs of indicated genotypes (top; arrows indicate muous-producing goblet cell (PAS staining) and MBP-positive eosinophil). Original magnification: ×400 (PAS) and ×200 (MBP). Quantification of PAS-stained epithelial cells per bronchus or MBP-positive eosinophils in peribronchial area (bottom). (c) MBP staining of eyelid and esophagus. Original magnification: ×200 (eyelid) and ×200 (esophagus). Data are representative of six experiments (a), two experiments (b; mean ± s.d. (n = 4 biological replicates) and two experiments (c). *P < 0.05, **P < 0.01 (two-tailed unpaired Student’s t test).
Figure 3
Figure 3
TH2 cell–mediated inflammation in the lungs of mice depleted for Id2 and Id3 expression in Treg cells. (a) May-Giemsa staining images of cells (left) and cell numbers (right) in BAL fluid derived from 6–8-week-old control (Ctrl) or Id2fl/flId3fl/flFoxp3Cre mice (left). Green, red and blue arrowheads indicate macrophages (MF), lymphocytes (Lym) and eosinophils (Eos), respectively; Neu, neutrophil. Insets show magnification of boxed areas. Original magnification, ×40 (×120 in insets). (b) Numbers of hematopoietic cells (CD45+), macrophages (MF), eosinophils (Eos), basophils (Bas), neutrophils (Neu), mast cells (Mas), T cells (T) and B cells (B) isolated from the left lobes of the lungs derived from Id2fl/flId3fl/flFoxp3Cre mice (left). Numbers of type 2 innate lymphoid cells (ILC2; CD45+LineageCD25+IL7R+Sca1hiThy1.2hi) isolated from the left lobes of the lungs derived from Id2fl/flId3fl/flFoxp3Cre mice (right). (c) Flow cytometric analysis of CD19 versus TCRβ expression of cells derived from the LNs isolated from 6–8-week-old control (Id2fl/flId3fl/flFoxp3Cre/+) or Id2fl/flId3fl/flFoxp3Cre/Cre mice. Adjacent panels indicate CD11c versus SiglecF, Fcer1 versus SiglecF and Mac-1 versus Gr-1 expression, gated on the TCRβCD19 compartment derived from 6–8-week-old control (Id2fl/flId3fl/flFoxp3Cre/+) or Id2fl/flId3fl/flFoxp3Cre/Cre lymphocytes isolated from subcutaneous LNs. Numbers in plots indicate percent CD19TCRβ, CD11cSiglecF+, Fcer1+SiglecF and Mac-1+Gr-1+ cells. Right, percentages of eosinophils (SiglecF+CD11c), basophils (Baso; Fcer1hiSiglecF) and neutrophils (Neut; Mac-1hiGr-1hi) in subcutaneous LN cells and splenocytes. Data are representative of four experiments (a,c; mean ± s.d.; in a, n = 8 independent biological replicates; in b, control n = 5, Id2fl/flId3fl/flFoxp3Cren = 4 independent biological replicates; in c, control n = 6, Id2fl/flId3fl/flFoxp3Cren = 9 independent biological replicates). *P < 0.05, **P < 0.01 (two-tailed unpaired Student’s t test).
Figure 4
Figure 4
Spontaneous germinal center formation and TH2 cell-mediated inflammation in mice depleted for the expression of Id2 and Id3 in Treg cells. (a) αβ T cell (αβT) and B cell numbers for spleen (Spl) and subcutaneous LN (sLN) isolated from 8-week-old littermate control and Id2fl/flId3fl/flFoxp3Cre mice. (b) Flow cytometric analysis of splenocytes derived from 8-week-old littermate control (Id2fl/+Id3fl/+Foxp3Cre) and Id2fl/flId3fl/flFoxp3Cre mice, showing expression of CD44 versus CD62L and CXCR5 versus PD-1, gated on the CD4+TCR[3+YFPCD25 population (left). Frequency of germinal center B cells in 8-week-old littermate control (Id2fl/+Id3fl/+Foxp3Cre) and Id2fl/flId3fl/flFoxp3Cre mice (middle). Numbers in quadrants and gates indicate percent cells in each compartment. Frequencies of TFH (CXCR5hiPD-1hi) cells in the CD4+ T cell compartment and GC B (FashiGL7hi) cells (GCB) in the B cell compartment (right). (c) Cytokine expression in CD4+ T cell derived from littermate control (Id2fl/flId3fl/flFoxp3Cre/+) and Id2fl/flId3fl/flFoxp3Cre/Cre mice (left) Percentages of CD4+ T cells producing IL-4, L-5, IL-13, IFN-γ and IL-17 in 7–9-week- old mice for the indicated genotypes (right). (d) Enzyme-linked immunosorbent assay (ELISA) of IgM, IgG1, IgG2a, IgG2b, IgG3, IgA and IgE in serum derived from 6–9-week-old mice for the indicated genotypes. Data are representative of four experiments (a; mean ± s.d.; n = 8 biological replicates), | three independent experiments (b; mean ± s.d.; control n = 4, Id2fl/flId3fl/flFoxp3Cre n = 5 biological replicates), two experiments (c; mean ± s.d.; n = 4 biological replicates), one experiment (d; mean ± s.d.; control n = 8, Id2fl/flId3fl/flFoxp3Cren = 7 biological replicates) *P < 0.05, **P < 0.01 (two-tailed unpaired Student’s t test).
Figure 5
Figure 5
Depletion of Id2 and Id3 expression in Treg cells modulates the expression of CXCR5, Foxp3 and Nrp1. (a) Flow cytometric analysis of Id3-GFP versus ICOS, gated on the CD4+CD25+ Treg cell compartment derived from from Id3gfp/+ splenocytes (left). Numbers in quadrants indicate percent cells in each compartment. Expression of CXCR5 in the Treg compartments as characterized by the expression of Id2 and Id3 (right). (b) Flow cytometric analysis of Treg cells (Foxp3-YFP+CD25+CD4) derived from LNs isolated from 8-week-old control (Id2fl/+Id3fl/+Foxp3Cre) and Id2fl/flId3fl/flFoxp3Cre mice for indicated cell surface markers. Numbers in plots indicate percent Foxp3-YFP+CD25+, CXCR5+PD-1+ and CXCR5+PD-1 cells. Spl, spleen. (c) CXCR5 expression patterns for YFP+Treg, CD25+YFPTreg and CD25non-Treg CD4+CD8 thymocytes derived from heterozygous female Id2fl/flId3fl/flFoxp3Cre/+ mice (left). CXCR5 expression derived from Id2fl/flId3fl/flFoxp3Cre/+ mice (bottom). MFI, mean fluorescence intensity. (d) CXCR5 and PD-1 expression in Treg cells derived from the thymus and LNs isolated from control Id2+/+Id3+/+Foxp3Cre/+ and Id2fl/flId3fl/flFoxp3Cre/+ mice. Numbers in plots indicate percent CXCR5+PD-1+ and CXCR5+PD-1 cells. (e) Flow cytometric analysis for Foxp3 and CTLA-4 expression in CD4 T cells derived from littermate control and Id2fl/flId3fl/flFoxp3Cre mice. Numbers in plots indicate percent Foxp3+ cells. (f) Helios and CD25 expression (top) and Nrp1 (bottom) in Foxp3+ or Foxp3+Helios+ Treg cells derived from 8-week-old control and Id2fl/flId3fl/flFoxp3Cre LNs and thymi. Numbers in plots indicate percent Helios+ cells. Percentages of Helios+ cells in Foxp3+ Treg cells isolated from control, 4-week-old or 8–9-week-old Id2fl/flId3fl/flFoxp3Cre mice (right). Data are representative of two experiments (a), three independent experiments (b; mean ± s.d.; control n = 3, Id2fl/flId3fl/flFoxp3Cren = 5 biological replicates), two experiments (c; mean ± s.d.; n = 3 biological replicates), three experiments (d), three (Foxp3) and five (CTLA-4) experiments (e; mean ± s.d.; Foxp3 n = 3, CTLA-4 control n = 7, Id2fl/flId3fl/flFoxp3Cren = 9 biological replicates), and three experiments (f; mean ± s.d.; n = 4 biological replicates). *P < 0.05, **P < 0.01 (two-tailed unpaired Student’s t test).
Figure 6
Figure 6
Impaired homeostasis of Treg cells deleted for Id2 and Id3 expression after transfer into Rag1−/− mice. (a) Body weight in indicated populations of mice after CD4+CD25CD45RBhi T cell (Tconv) from CD45.1 mice were intravenously injected into Rag1−/− recipient mice with or without CD4+CD25+Foxp3-YFP+ T cell (Treg) from 4-week-old Id2fl/flId3fl/flFoxp3Cre or wild-type Foxp3Cre mice (CD45.2) (n = 4 each group). WT, wild type. (b) H&E staining of large intestine (left). Blue and green arrowheads indicate crypt abscess and infiltration of inflammatory cells in the submucosal muscle layer, respectively. IBD score50 in large intestine on day 44 after transfer (right). Original magnification, ×100 (c) Flow cytometric analysis of Foxp3 and CD45.1 expression gated on CD4+TCRβ+ cells in mesenteric LNs (left) and analysis of CD45.1Foxp3+ cells (right). Data are representative of one experiment (a–c; error bars, s.d.; n = 4 independent biological replicates). *P < 0.05, **P < 0.01 (two-tailed unpaired Student’s t test).
Figure 7
Figure 7
Id2 and Id3 modulate the homeostasis and survival of Treg cells. (a) Flow cytometric analysis for YFP and CD25 expression on cells isolated from thymocytes (Thy) and LNs (LN) derived from Id2+/+Id3+/+Foxp3Cre/+ or Id2fl/flId3fl/flFoxp3Cre/+ mice (left; cells were gated on the CD4+CD8TCRβhi, CD4+CD8 or CD4+ populations). Numbers in plots indicate percent YFP+CD25+ and YFPCD25+ cells. Ratios of YFP+ Treg cells versus CD25+YFPTreg cells and YFP+Foxp3+ Treg versus Foxp3+ Treg cells in indicated tissues (right). (b) Flow cytometric analysis of the Foxp3+CD4+ population in splenocytes derived from heterozygous female Id2+/+Id3+/+Foxp3Cre/+ or Id2fl/flId3fl/flFoxp3Cre/+ mice cultured and stimulated with anti-CD3ε plus anti-CD28 antibodies in the presence of human IL-2 (top left). Numbers indicate the fraction of YFP+Foxp3+ and YFPFoxp3+ cells. Percentages of Ki67+ cells in the YFP+ Treg cell populations analyzed 24 h after stimulation for the indicated genotypes (top right). Ratios of YFP+ cells for the indicated time points as compared to the zero time point (bottom left). Percentages of annexin-V+ cells gated on the YFP+ Treg cell population (right). Data are representative of three independent experiments (a; mean ± s.d.; Id2+/+Id3+/+Foxp3cre/+n = 5, Id2fl/flId3fl/flFoxp3cre/+n = 7 biological replicates) and one experiment (b; mean ± s.d.; n = 3 technical replicates). *P < 0.05, **P < 0.01 (two-tailed unpaired Student’s t test).
Figure 8
Figure 8
Unique patterns of gene expression in Treg cells depleted for Id2 and Id3. (a) RNA-seq analysis of mRNA expression in sorted Treg cells isolated from Id2fl/+Id3fl/+Foxp3Cre versus Id2fl/flId3fl/flFoxp3Cre mice (log2; FPKM values for RefSeq genes). Points represent genes upregulated in Id2fl/flId3fl/flFoxp3Cre Treg cells > twofold (red; P < 0.05 (calculated by Cuffdiff)), genes downregulated in Id2fl/flId3fl/flFoxp3Cre Treg cells > twofold (blue; P < 0.05) and not significantly changed (gray) as compared to control cells. Selected genes are labeled. (b) RNA-seq analysis at Cxcr5, Ccr2, Il10, Apoe, Bcl6 and Prdm1 loci, presented in reads per million reads aligned (RPM). Arrows indicate transcription start site and direction of transcription. (c) Quantitative real-time PCR analysis of genes in sorted Foxp3-YFP+ Treg cells derived from LNs isolated from heterozygous female Id2+/+Id3+/+Foxp3Cre/+ or Id2fl/flId3fl/flFoxp3Cre/+ mice, presented normalized by the abundance of Hprt1 transcript. (d) E2A occupancy (E2A binding) and deposition of H3K4me1 across the Cxcr5 and Il10 loci in DN3, A12 and proB cells. Numbers in plots indicate total tags observed. DN3 cells; Rag2−/− thymocytes, A12 cells; E2a/ E47-reconstituted T cell line, pro-B cells; Rag2−/− bone marrow B cells. Arrows indicate transcriptional start site and direction of transcription. Data are representative of three experiments (a,b), one experiment (c; mean ± s.d.; n = 3 technical replicates) and one experiment (d).

Similar articles

Cited by

References

    1. Josefowicz SZ, Lu LF, Rudensky AY. Regulatory T cells: mechanisms of differentiation and function. Annu. Rev. Immunol. 2012;30:531–564. - PMC - PubMed
    1. Sakaguchi S, Yamaguchi T, Nomura T, Ono M. Regulatory T cells and immune tolerance. Cell. 2008;133:775–787. - PubMed
    1. Vignali DAA, Collison LW, Workman CJ. How regulatory T cells work. Nat. Rev. Immunol. 2008;8:523–532. - PMC - PubMed
    1. Locksley RM. Asthma and allergic inflammation. Cell. 2010;140:777–783. - PMC - PubMed
    1. Rothenberg ME, Hogan SP. The eosinophil. Annu. Rev. Immunol. 2006;24:147–174. - PubMed

Publication types

MeSH terms

Associated data