. 2014 Aug;15(8):749-757.
doi: 10.1038/ni.2936. Epub 2014 Jun 29.

The metabolic checkpoint kinase mTOR is essential for IL-15 signaling during the development and activation of NK cells

Affiliations

The metabolic checkpoint kinase mTOR is essential for IL-15 signaling during the development and activation of NK cells

Antoine Marçais et al. Nat Immunol. 2014 Aug.

Abstract

Interleukin 15 (IL-15) controls both the homeostasis and the peripheral activation of natural killer (NK) cells. The molecular basis for this duality of action remains unknown. Here we found that the metabolic checkpoint kinase mTOR was activated and boosted bioenergetic metabolism after exposure of NK cells to high concentrations of IL-15, whereas low doses of IL-15 triggered only phosphorylation of the transcription factor STAT5. mTOR stimulated the growth and nutrient uptake of NK cells and positively fed back on the receptor for IL-15. This process was essential for sustaining NK cell proliferation during development and the acquisition of cytolytic potential during inflammation or viral infection. The mTORC1 inhibitor rapamycin inhibited NK cell cytotoxicity both in mice and humans; this probably contributes to the immunosuppressive activity of this drug in different clinical settings.


Figures
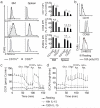
Figure 1
Figure 1
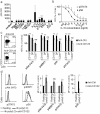
NK cell metabolism is regulated developmentally and following activation (a) Representative flow cytometric analyses of the expression of CD71 and CD98 or the amount of 2-NBDG staining from bone marrow (BM) or splenic NK CD11blo versus CD27lo subsets as indicated. The bar graph shows averaged MFI (+/− s.d.) for CD71, CD98 or 2-NBDG of BM and splenic NK cell subsets (n=4 mice in 4 independent experiments, t-test, *p<0.05, **p<0.01, ***p<0.001). MFI were normalized to the CD11blo subset in the BM. (b) Histograms represent CD71, CD98 and 2-NBDG expression on splenic NK cells from control injected or mice injected with poly(I:C) 18 h before, one representative experiment out of 3 is shown. (c and d) Primary NK cells were stimulated or not with IL-15 for 18 h or 120 h and NK cell metabolism was analyzed. OXPHOS (OCR for O2 Consumption Rate) (c) and Aerobic Glycolysis (ECAR for ExtraCellular Acidification Rate) (d) were analyzed in real time after injection of Glucose 25 mM, Oligomycin 1 μM, FCCP 1.5 M + pyruvate 1 mM and Actimycin A 1 μM + Rotenone 0.1 μM as indicated. Curves represent the average of 3 independent mice performed in triplicate (2 independent experiments).
Figure 2
Figure 2
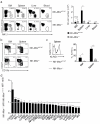
mTOR activity decreases as differentiation progresses and is upregulated upon activation (a) Phosphorylation of different proteins in BM NK cell subsets as defined by the expression of CD27 and CD11b, one representative experiment out of 4 is shown. The bar graph shows averaged phosphoproteins MFI (+/− s.d.) of BM and splenic NK cell subsets (n=4 mice in 4 independent experiments). MFI is normalized to the CD11blo subset. (b) Phosphorylation of different proteins in splenic NK cells from control or mice injected with poly(I:C) 18 h before, one representative experiment out of 3 is shown. The bar graph shows averaged phosphoproteins MFI (+/− s.d.) (n=3 mice in 3 independent experiments). Fold change (FC) in MFI is obtained by normalizing the activated to the resting population. (t-test, *p<0.05, **p<0.01, ***p<0.001, ns = non significant).
Figure 3
Figure 3
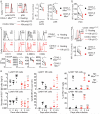
mTOR activity is primarily under IL-15 control. (a) Splenocytes were cultured for 1 h on plates coated with the indicated antagonistic antibodies or with the indicated cytokine. Cells were subsequently stained and the averaged MFI (+/− s.d.) of intracellular pS6 in NK cells is shown (n=4 independent experiments using 1 mouse each time). (b) Splenocytes were cultured with graded concentrations of IL-15 for 1 h. Cells were stained and the averaged MFI of intracellular pS6 and pSTAT5 in NK cells are given as percentage of the maximal response (+/− s.d.) (n=3 independent experiments using 1 mouse each time). (c) Freshly isolated BM cells of control or anti-CD122 injected mice were stained and analyzed by flow cytometry. The amount of pS6 as a function of CD27 expression in one representative experiment out of 3 is shown. The bar graph shows averaged phosphoproteins MFI of BM NK cells from control of anti-CD122 treated mice (n=3 mice in 3 independent experiments). MFI is normalized to the CD11blo subset. (d) Histograms represent phosphorylation of different proteins in splenic NK cells from control or poly(I:C) injected mice 4 h before, with or without anti-CD122, one representative experiment out of 3 is shown. The bar graph shows averaged phosphoproteins MFI (+/− s.d.) (average of n=3 mice in 3 independent experiments). Fold change (FC) in MFI is obtained by normalizing the activated to the resting population. (t-test, *p<0.05, **p<0.01, ***p<0.001, ns = non significant).
Figure 4
Figure 4
mTOR controls NK cell maturation and homeostasis. (a) Single cell suspension from various organs of NK-MtorWT/WT (NKp46ICre) and NK-Mtor−/− (NKp46ICreMtorlox/lox) mice were stained for NK1.1, CD3 and CD19. Representative flow cytometric analyzes out of 3 experiments are shown. Cell suspensions were numerated and the number of NK cell calculated. The bar graph shows the average number (+/− s.d.) of NK cells in BM, Spleen, Liver and Blood of NK-MtorWT/WT and NK-Mtor−/− mice (average of n=3 mice in 3 independent experiments). (b) Representative flow cytometric analysis showing CD27 and CD11b expression on gated NK cells from the BM and Spleen of NK-MtorWT/WT and NK-Mtor−/− mice . More than 10 experiments showed the same profile. (c) Representative histograms show KLRG1 expression on splenic NK cells of NK-MtorWT/WT and NK-Mtor−/− mice . The bar graph shows the average percentage (+/− s.d.) of KLRG1 positive cells among BM and Spleen NK cells (n=4 mice in 3 independent experiments). (d) MFI of the indicated marker was measured on spleen CD11b NK cells from NK-MtorWT/WT and NK-Mtor−/− mice. The bar graph shows the average of the ratio of MFIs (+/− s.d.) NK-Mtor−/− over NK-MtorWT/WT NK cells for each marker (n=3 mice in 3 independent experiments). The grey line indicates a ratio of 1. (t-test, *p<0.05, **p<0.01, ***p<0.001).
Figure 5
Figure 5
mTOR is necessary for NK cell optimal fitness, proliferation in the BM and maximal response to IL-15. (a) Flow cytometric analyzes show AnnexinV and 7-AAD staining of splenic NK cells from NK-MtorWT/WT and NK-Mtor−/− mice. One representative experiment out of 3 is shown. The bar graph shows average percentages (+/− s.d.) of viable cells (AnnexinV-7-AAD-) in the different NK cell subsets from NK-MtorWT/WT and NK-Mtor−/− mice (n=3 mice in 3 independent experiments). (b) Flow cytometric analyzes show BrdU staining of CD11blo subset BM NK cells from NK-MtorWT/WT and NK-Mtor−/− mice. One representative experiment out of 3 is shown. The bar graph shows average percentages (+/− s.d.) of BrdU positive cells (n=6 mice in 3 independent experiments). (c) Histograms represent expression of CD122, CD132 and pSTAT5 in CD11blo BM NK cells from NK-MtorWT/WT and NK-Mtor−/− mice. MFI values are indicated. One representative experiment out of 4 with 1 mouse in each is shown. (d) Splenocytes from NK-MtorWT/WT and NK-Mtor−/− mice were cultured with graded concentrations of IL-15 for 1 h. Cells were stained and the averaged MFI (+/− s.d.) of pSTAT5 in NK cells is given as percentage of the maximal response (n=3 independent experiments using 1 mouse in each). (t-test, *p<0.05, **p<0.01, ***p<0.001, ns = non significant).
Figure 6
Figure 6
Defective NK cell activation in the absence of mTOR. (a-d) CD45.1 MtorWT/WT or CD45.2 Mtorlox/lox splenocytes treated in vitro with TATCre were transferred into CD45.1/CD45.2 double positive hosts. 2 days later, mice were injected or not with poly(I:C). Splenic cell suspension were analyzed 18 h later by flow cytometry. (a) Histograms represent phosphorylation of S6 and Akt proteins (one representative experiment out of 3 (t-test, *p<0.05, **p<0.01, ***p<0.001, ns = non significant). independent experiments using 1 mouse in each), numbers indicate the MFI. The scatter plot shows phosphoproteins MFI in NK cells from poly(I:C) injected mice (n=5 mice, 3 independent experiments). MFI is normalized to the resting population. (b) The scatter plot shows FSC MFI in NK cells from poly(I:C) injected mice (n=6 mice, 3 independent experiments). (c) Histograms represent expression of CD71, CD98 and CD69 or the amount of 2-NBDG staining in one experiment out of 3, numbers indicate the MFI. The scatter plot shows MFI in NK cells from poly(I:C) injected mice (n=6 mice, 3 independent experiments). (d) Histograms show intracellular expression of GzmB in one representative experiment out of 3. The scatter plot shows MFI normalized to the resting population (n=5 mice, 3 independent experiments). (a-d) In all scatter plots, lines link the CD45.1 MtorWT/WT and CD45.2 Mtor−/− NK cells co-transferred in the same host. (e) NK-MtorWT/WT and NK-Mtor−/− mice were infected with MCMV and sacrificed at day 0, 2 or 6.5. Expression of intracellular Ki67, GzmB and IFN-γ analyzed in Ly49H+ and Ly49H splenic NK cell subsets. The number of Ki67+ NK cells as well as the GzmB MFI (normalized to non-infected mice) and the percentage of IFN-γ+ NK cells in each subset is shown (average +/− SD, dots represent individual mice, statistical comparisons have been made between NK-MtorWT/WT and NK-Mtor−/− NK cells for each time point). Ki67+ NK cell proliferation is indicated. Results are from more than at least 6 mice, 4 independent experiments. (t-test, *p<0.05, **p<0.01, ns = non significant).
Figure 7
Figure 7
Acute mTOR inhibition abrogates inflammation induced priming. (a) Splenocytes were cultured for 14 h in the presence of IL-15 at 100 ng/mL with or without mTOR inhibitors as indicated. Cells were then stained and analyzed by flow cytometry. The bar graphs show the averaged MFI (+/− s.d.) for pS6 and GzmB in gated NK cells (n=5 independent experiments with 1 mouse in each). (b) Rapamycin treated or non-treated mice were injected with poly(I:C) and sacrificed 18h later. Splenocytes were analyzed by flow cytometry. The graphs show the averaged MFI for pS6 and GzmB in gated NK cells. Each dot represents a single mouse, bars indicate average and SD (n=9 mice in 4 independent experiments for poly(I:C) and 18 mice in 4 independent experiments for Rapa+poly(I:C)). The MFI was normalized to control non-poly(I:C) injected mice. (c) In vivo cytotoxicity toward missing-self targets was assessed as described in the Experimental Procedures section. The percentage of remaining cells was calculated and is shown. Each dot represents a single mouse, bars indicate average and SD (n=9 mice in 4 independent experiments for poly(I:C) and 18 mice in 4 independent experiments for Rapa+poly(I:C)). (d) Human PBMCs were cultured for 36h as indicated. Cells were then stained and analyzed by flow cytometry. The bar graphs show the averaged MFI for pS6 and GzmB in gated NK cells (n=9 individual donors in 3 independent experiments, paired t-test, *p<0.05, **p<0.01).

Comment in

References

    1. Vivier E, Tomasello E, Baratin M, Walzer T, Ugolini S. Functions of natural killer cells. Nat. Immunol. 2008;9:503–510. - PubMed
    1. Spits H, et al. Innate lymphoid cells--a proposal for uniform nomenclature. Nat. Rev. Immunol. 2013;13:145–149. - PubMed
    1. Walzer T, et al. Natural killer cell trafficking in vivo requires a dedicated sphingosine 1-phosphate receptor. Nat. Immunol. 2007;8:1337–1344. - PubMed
    1. Luci C, et al. Influence of the transcription factor RORgammat on the development of NKp46+ cell populations in gut and skin. Nat. Immunol. 2009;10:75–82. - PubMed
    1. Sanos SL, et al. RORγt and commensal microflora are required for the differentiation of mucosal interleukin 22-producing NKp46+ cells. Nat. Immunol. 2009;10:83–91. - PMC - PubMed

Publication types

MeSH terms