. 2015 Jan;20(1):37-46.
doi: 10.1007/s12192-014-0523-6. Epub 2014 Jun 29.

Upregulation of heat shock proteins and the promotion of damage-associated molecular pattern signals in a colorectal cancer model by modulated electrohyperthermia

Affiliations

Upregulation of heat shock proteins and the promotion of damage-associated molecular pattern signals in a colorectal cancer model by modulated electrohyperthermia

Gabor Andocs et al. Cell Stress Chaperones. 2015 Jan.

Abstract

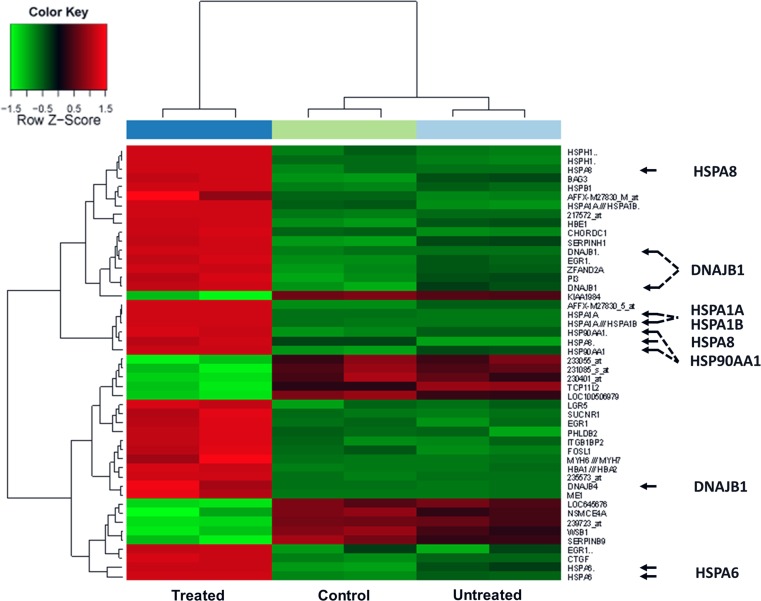
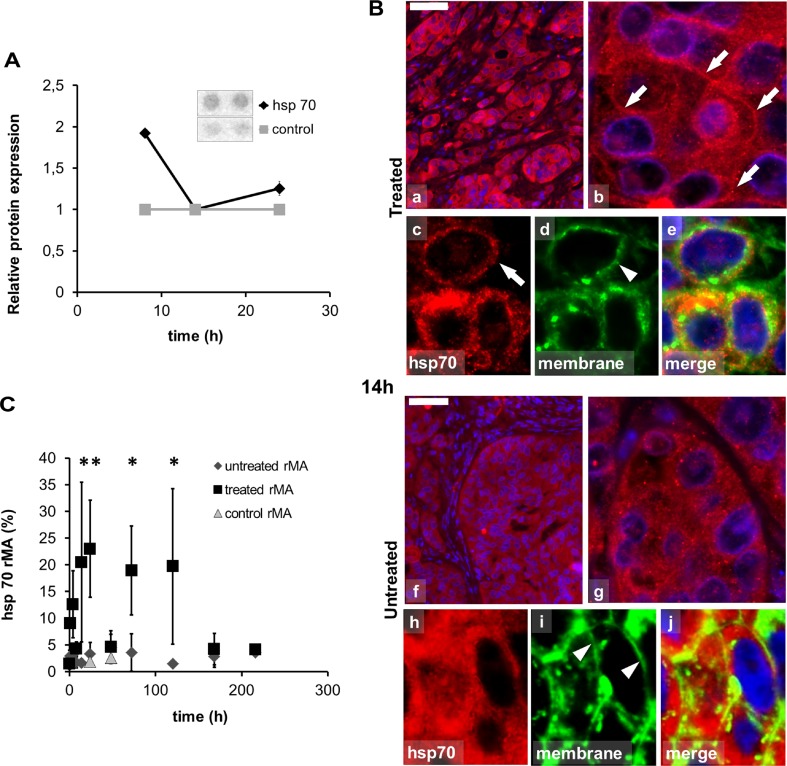
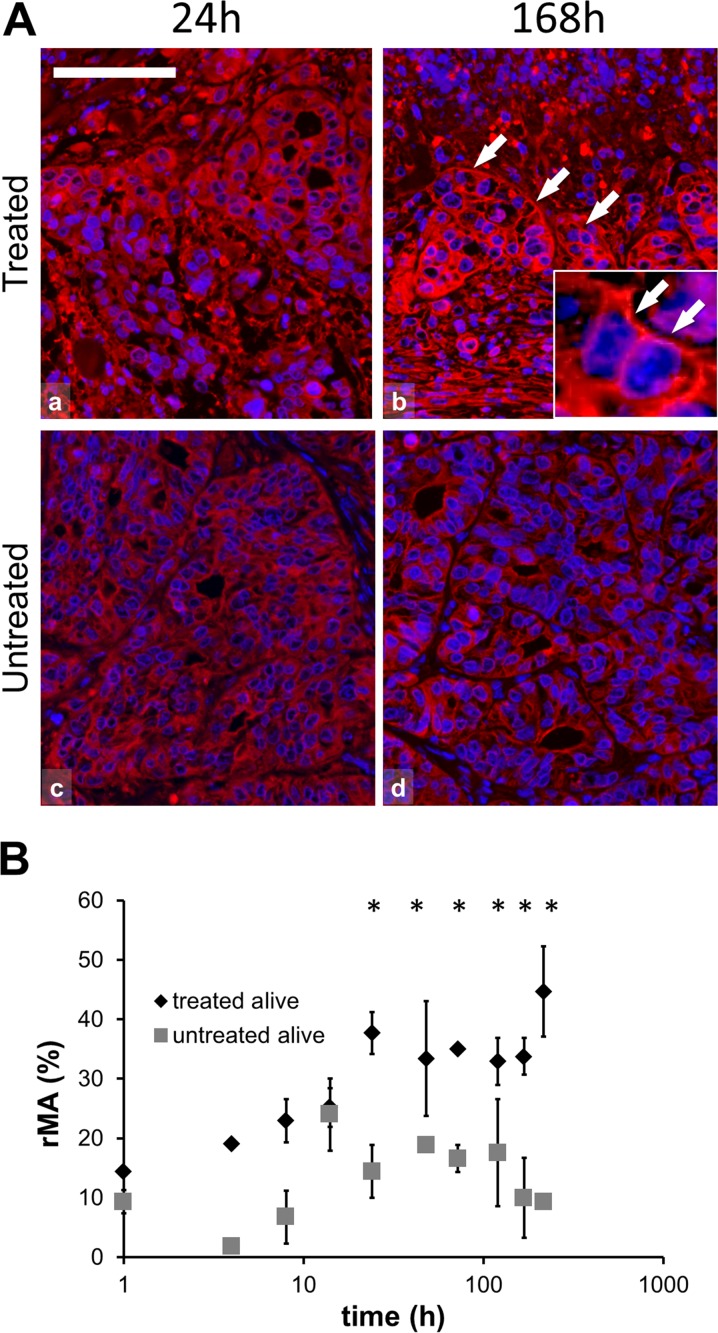
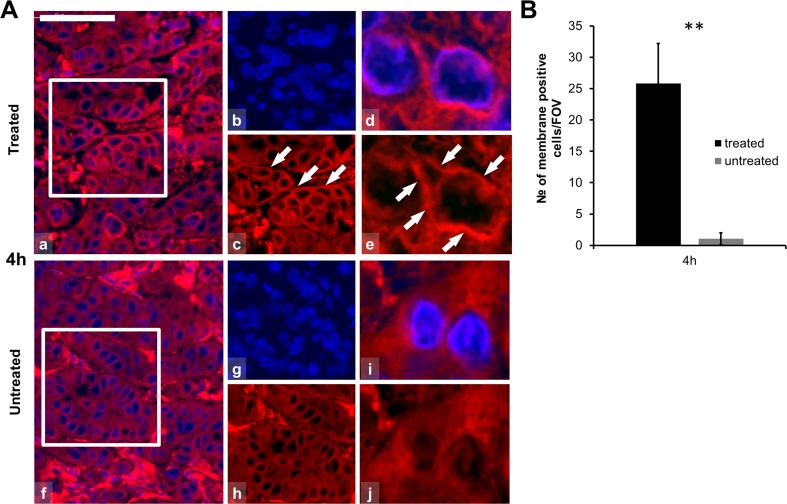
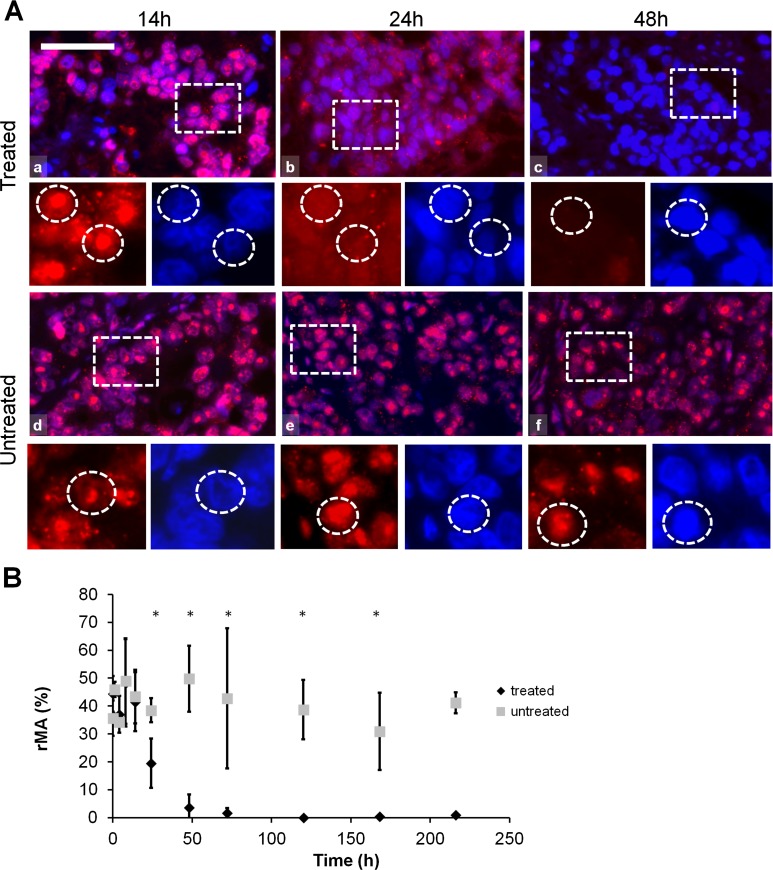
In modulated electrohyperthermia (mEHT) the enrichment of electric field and the concomitant heat can selectively induce cell death in malignant tumors as a result of elevated glycolysis, lactate production (Warburg effect), and reduced electric impedance in cancer compared to normal tissues. Earlier, we showed in HT29 colorectal cancer xenografts that the mEHT-provoked programmed cell death was dominantly caspase independent and driven by apoptosis inducing factor activation. Using this model here, we studied the mEHT-related cell stress 0-, 1-, 4-, 8-, 14-, 24-, 48-, 72-, 120-, 168- and 216-h post-treatment by focusing on damage-associated molecular pattern (DAMP) signals. Significant cell death response upon mEHT treatment was accompanied by the early upregulation (4-h post-treatment) of heat shock protein (Hsp70 and Hsp90) mRNA levels. In situ, the treatment resulted in spatiotemporal occurrence of a DAMP protein signal sequence featured by the significant cytoplasmic to cell membrane translocation of calreticulin at 4 h, Hsp70 between 14 and 24 h and Hsp90 between 24- and 216-h post-treatment. The release of high-mobility group box1 protein (HMGB1) from tumor cell nuclei from 24-h post-treatment and its clearance from tumor cells by 48 h was also detected. Our results suggest that mEHT treatment can induce a DAMP-related signal sequence in colorectal cancer xenografts that may be relevant for promoting immunological cell death response, which need to be further tested in immune-competent animals.


Figures

Fig. 1
Fig. 1
Heat map on gene expression summarizing transcripts showing significantly differential expression 4 h after mEHT treatment of HT29 colon cancer xenografts. Arrows highlight the elevated expression (red boxes) of heat shock protein genes from the Hsp70, Hsp40, Hsp90, and Hsp60 families in the treated samples (left column) compared either to sham treated (middle) and untreated samples (right)
Fig. 2
Fig. 2
Abundance and localization of heat shock protein 70 (Hsp70) in colorectal cancer xenografts measured with apoptosis protein array and immunofluorescence (Alexa 564, red). a Pooled tissue samples reveal elevated Hsp70 levels in apoptosis protein array at 8 h with no change at 14 and 24 h due to inhomogeneity of the tissue at these time points. b Hsp70 immunofluorescence (Alexa 564, red), in 14-h post-mEHT treated (ae) and untreated (fj) tumor cells also immunoreacted with wheat germ agglutinin (Alexa 488, green) and DAPI to stain nuclei. In 14 h post-mEHT-treated tumor cells Hsp70 immunofluorescence is predominately in cell membranes (arrows) as indicated by the wheat germ agglutinin reactivity (arrowheads). In the untreated tumor cells Hsp70 immunofluorescence is predominately cytoplasmic. Scale bar = 80 μm in a and f, 10 μm in b and g, and 5 μm in c, d, e, h, i, and j. c Semi-quantitative image analysis of immunofluorescence confirms significant elevation of Hsp70 levels both between 14–24 h and 72–120 h post-treatment (*p < 0.05) with a decline at 48 h (rMA relative mask area)
Fig. 3
Fig. 3
Hsp90 immunofluorescence (Alexa 564, red) and semi-quantitative analysis of heat shock protein 90 (Hsp90) in post-mEHT treated and untreated colorectal cancer xenografts. a Hsp90 immunofluorescence is predominately cytoplasmic at 24 h (a) and associated with cell membranes at 168 h post-mEHT (b; arrows), and as shown in the inset. Hsp90 immunofluorescence is less apparent at 24 h (c) and at 168 h (d) in untreated tumor cells. Cell nuclei are stained blue (DAPI). Scale bar = 60 μm in all and 20 μm in the inset. b Graph showing significant increase of Hsp90 protein between 24 and 216 h in the treated compared to the untreated tumor cells in the morphologically intact tumor areas (*p < 0.05) (rMA relative mask area)
Fig. 4
Fig. 4
Calreticulin immunofluorescence (Alexa 564, red) and semi-quantitative analysis of calreticulin in post-mEHT treated and untreated colorectal cancer xenografts. a Calreticulin immunofluorescence is localized to the cell membranes 4 h post-mEHT (arrows; ae) before any morphological or molecular sign of programmed cell death. Calreticulin immunofluorescence is diffuse and cytoplasmic in untreated tumor cells (fj). Cells nuclei are stained blue (DAPI). Scale bar = 60 μm in a, b, c, f, g, and h and 10 μm in d, e, i, and j. b Graph showing the mean number of cytoplasmic membrane positive cells counted at ×100 magnification in 10 fields of views (FOV) of five parallel samples. Elevation of calreticulin cell membrane immunofluorescence is highly significant (**p < 0.01) in 4 h post-mEHT treated compared to untreated tumor cells (FOV field of view)
Fig. 5
Fig. 5
HMGB1 immunofluorescence (Alexa 564, red) and semi-quantitative analysis of HMGB1 post-mEHT treated and untreated colorectal cancer xenografts. a HMGB1 immunofluorescence shows normal nuclear localization up to 14 h post-mEHT treated (a) and untreated (d) tumor cells. HMGB1 immunofluorescence is diffuse and diminished in 24 h and not evident in 48 h post-mEHT treated (b and c, respectively) tumor cells but not changed in 24 and 48 h untreated (e and f, respectively) tumor cells. Boxes show the location of the high-magnification insets. Circles in the insets show the location of nuclei. Scale bar = 60 μm in a, b, c, d, e and f, and 25 μm in all insets. b Semi-quantitative analysis highlights significant reduction of HMGB1 immunofluorescence between 48 and 216 h post-mEHT treated compared to untreated tumor cells (*p < 0.05) (rMA relative mask area)

Similar articles

Cited by

References

    1. Andocs G, Renner H, Balogh L, Fonyad L, Jakab C, Szasz A. Strong synergy of heat and modulated electromagnetic field in tumor cell killing. Strahlenther Onkol Organ Dtsch Rontgengesellschaft. 2009;185:120–126. doi: 10.1007/s00066-009-1903-1. - DOI - PubMed
    1. Andocs G, Szasz O, Szasz A. Oncothermia treatment of cancer: from the laboratory to clinic. Electromagn Biol Med. 2009;28:148–165. doi: 10.1080/15368370902724633. - DOI - PubMed
    1. Balogh G, et al. Key role of lipids in heat stress management. FEBS Lett. 2013;587:1970–1980. doi: 10.1016/j.febslet.2013.05.016. - DOI - PubMed
    1. Blad B, Baldetorp B. Impedance spectra of tumour tissue in comparison with normal tissue. A possible clinical application for electrical impedance tomography. Physiol Meas. 1996;17:A105–A115. doi: 10.1088/0967-3334/17/4A/015. - DOI - PubMed
    1. Blad B, Wendel P, Jonsson M, Lindstrom K. An electrical impedance index to distinguish between normal and cancerous tissues. J Med Eng Technol. 1999;23:57–62. doi: 10.1080/030919099294294. - DOI - PubMed

Publication types