. 2014 Aug;20(8):886-96.
doi: 10.1038/nm.3639. Epub 2014 Jun 29.

GABA from reactive astrocytes impairs memory in mouse models of Alzheimer's disease

Affiliations

GABA from reactive astrocytes impairs memory in mouse models of Alzheimer's disease

Seonmi Jo et al. Nat Med. 2014 Aug.

Abstract

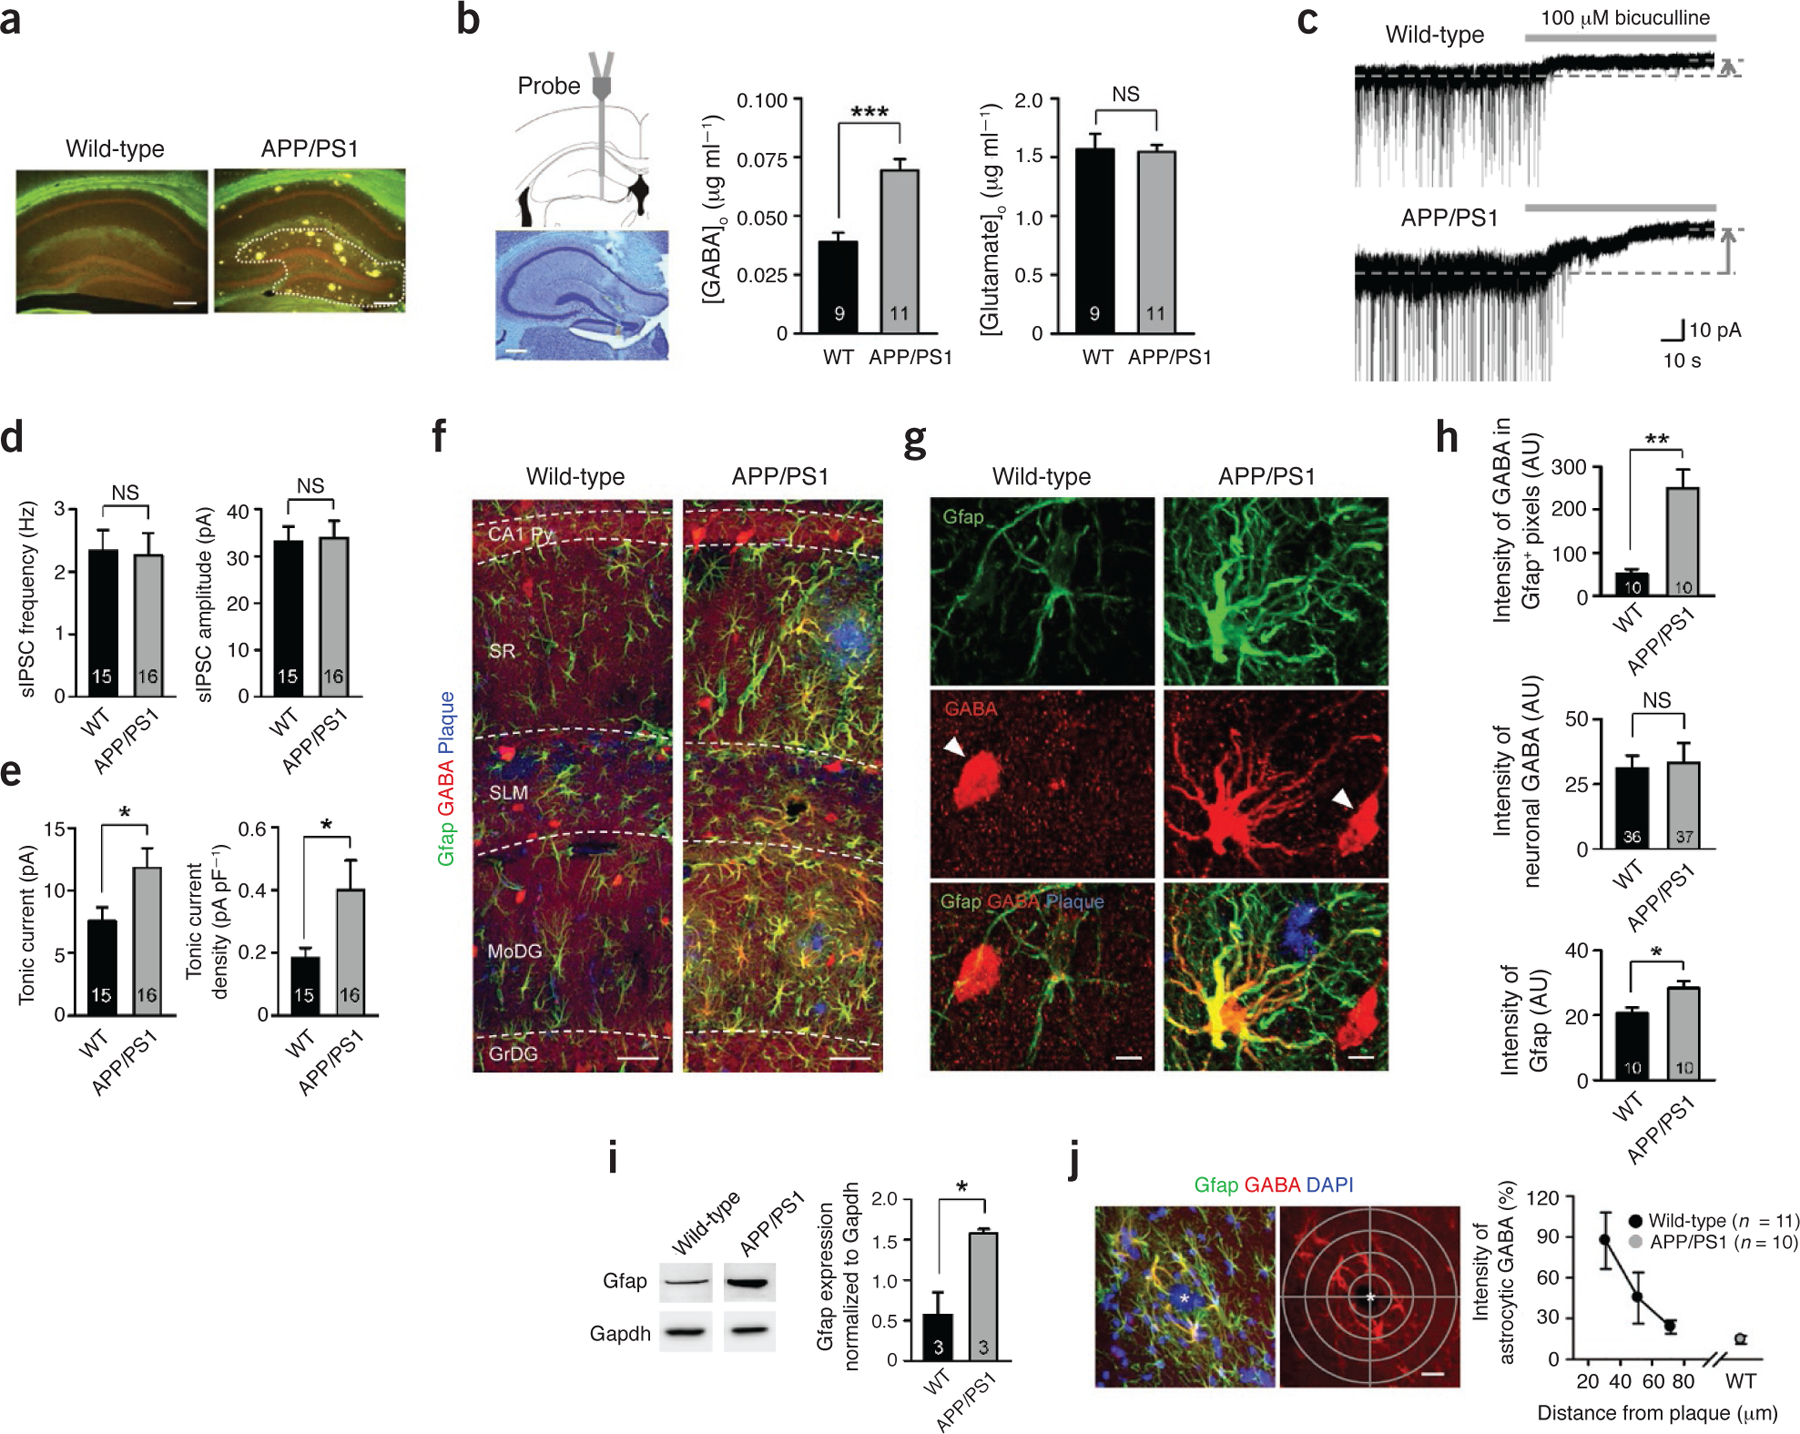
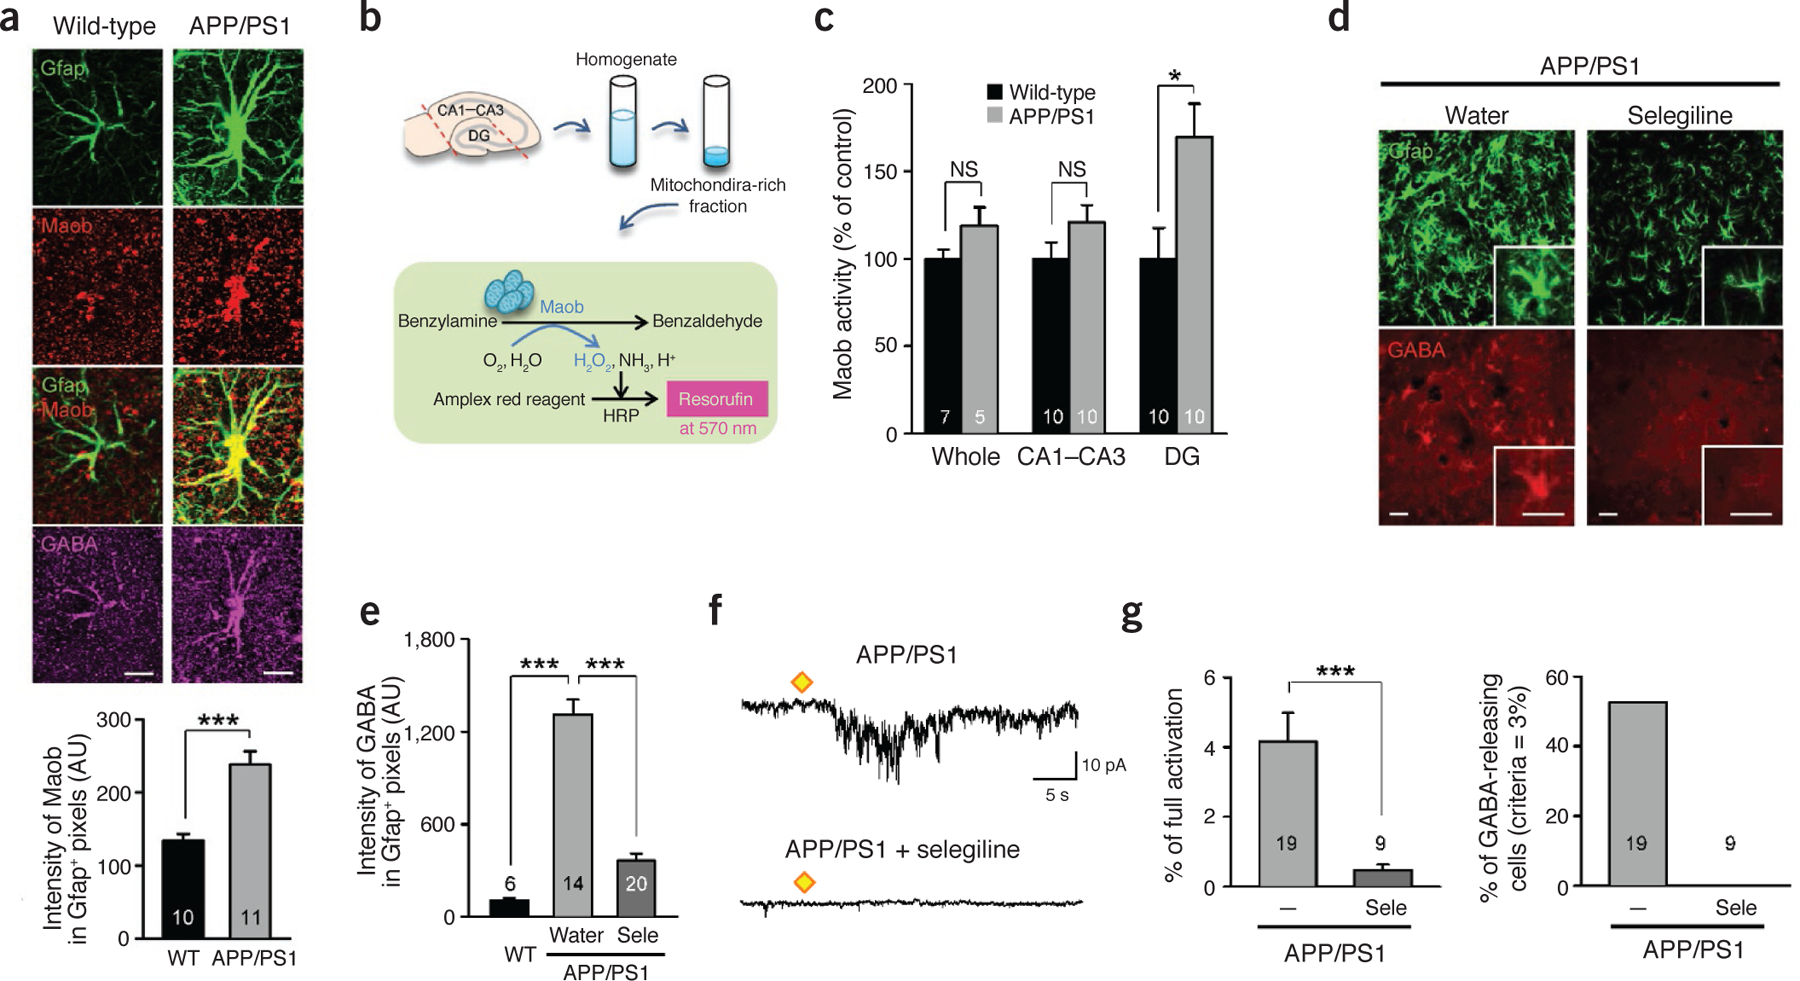
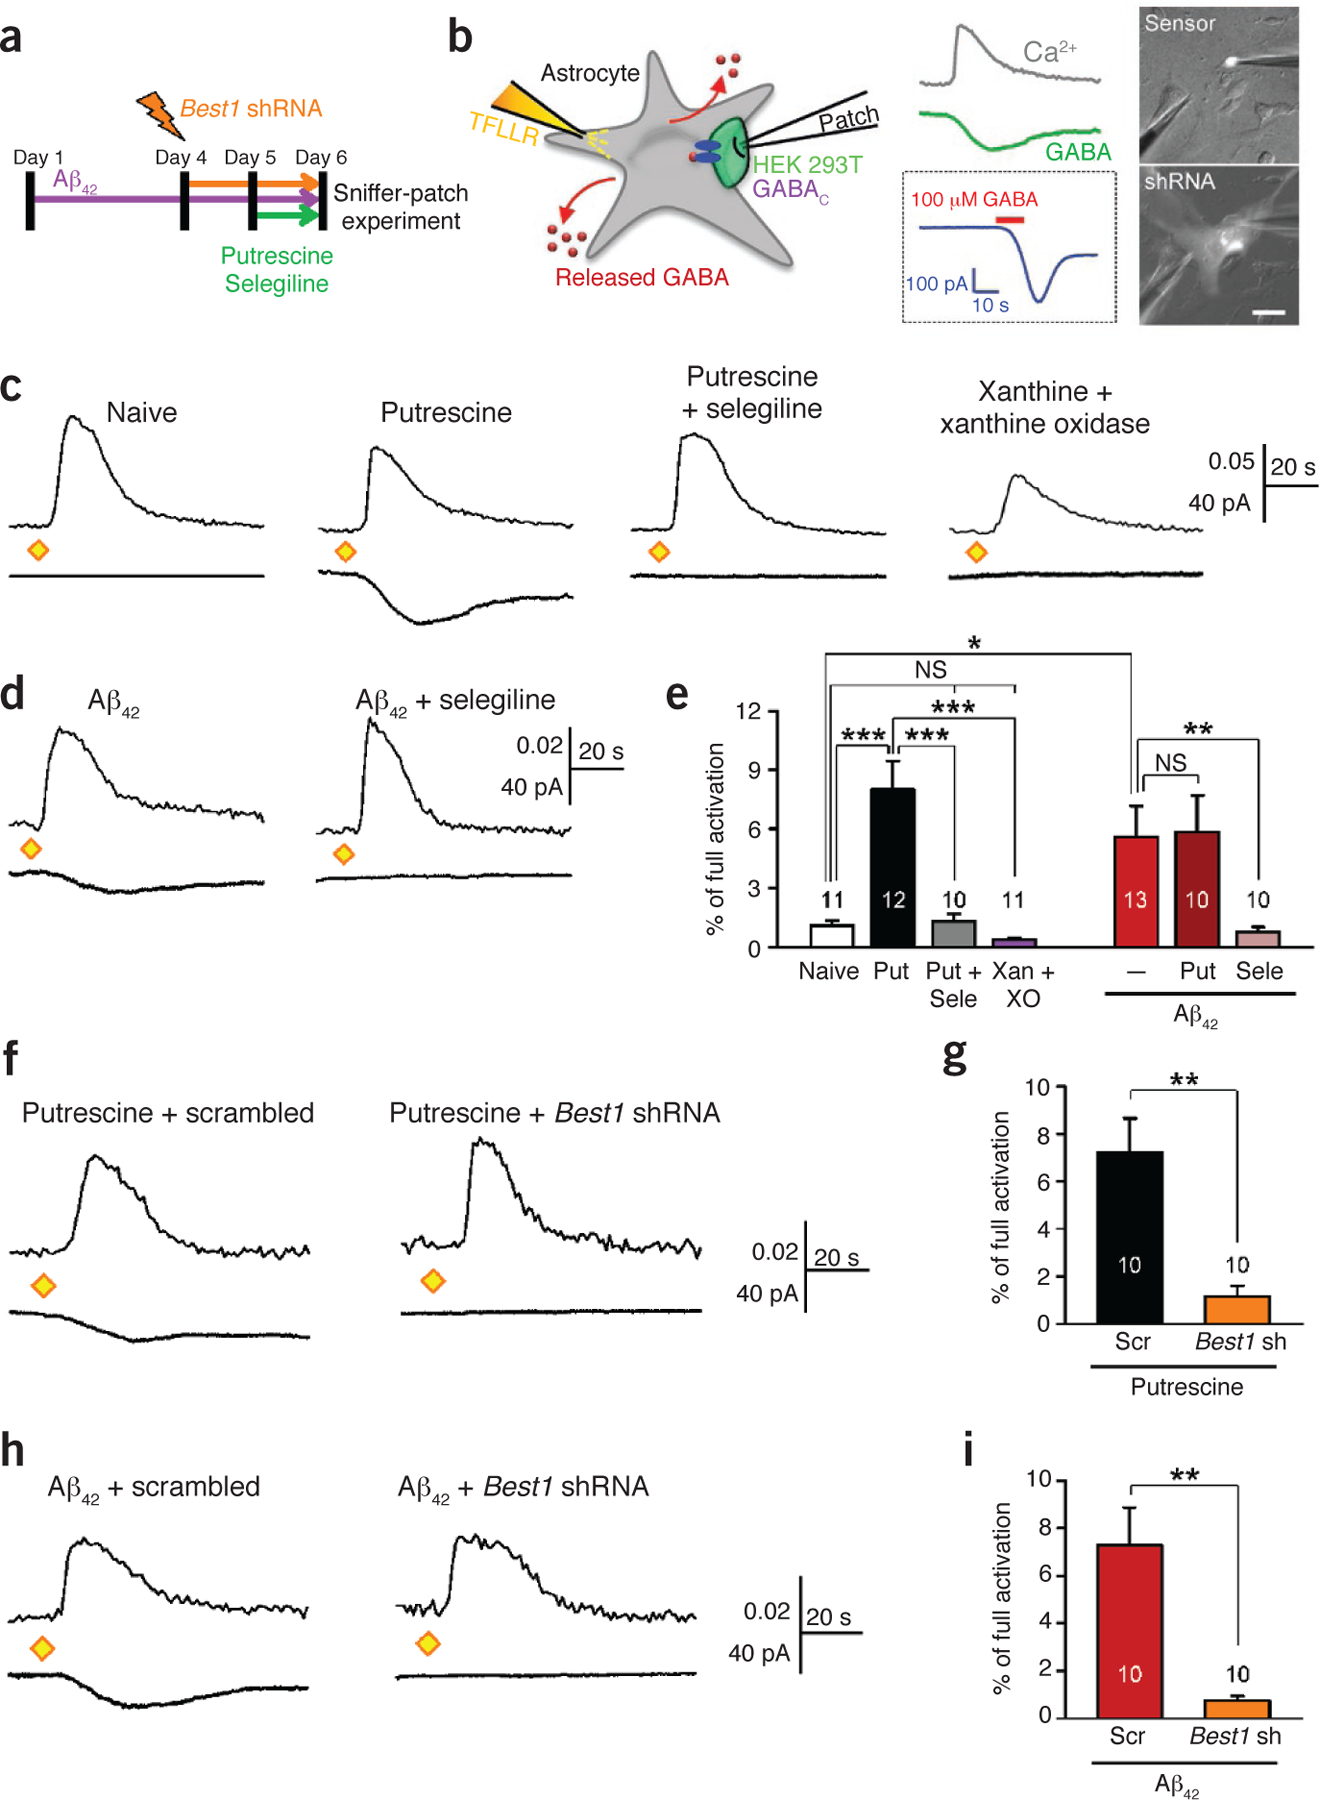
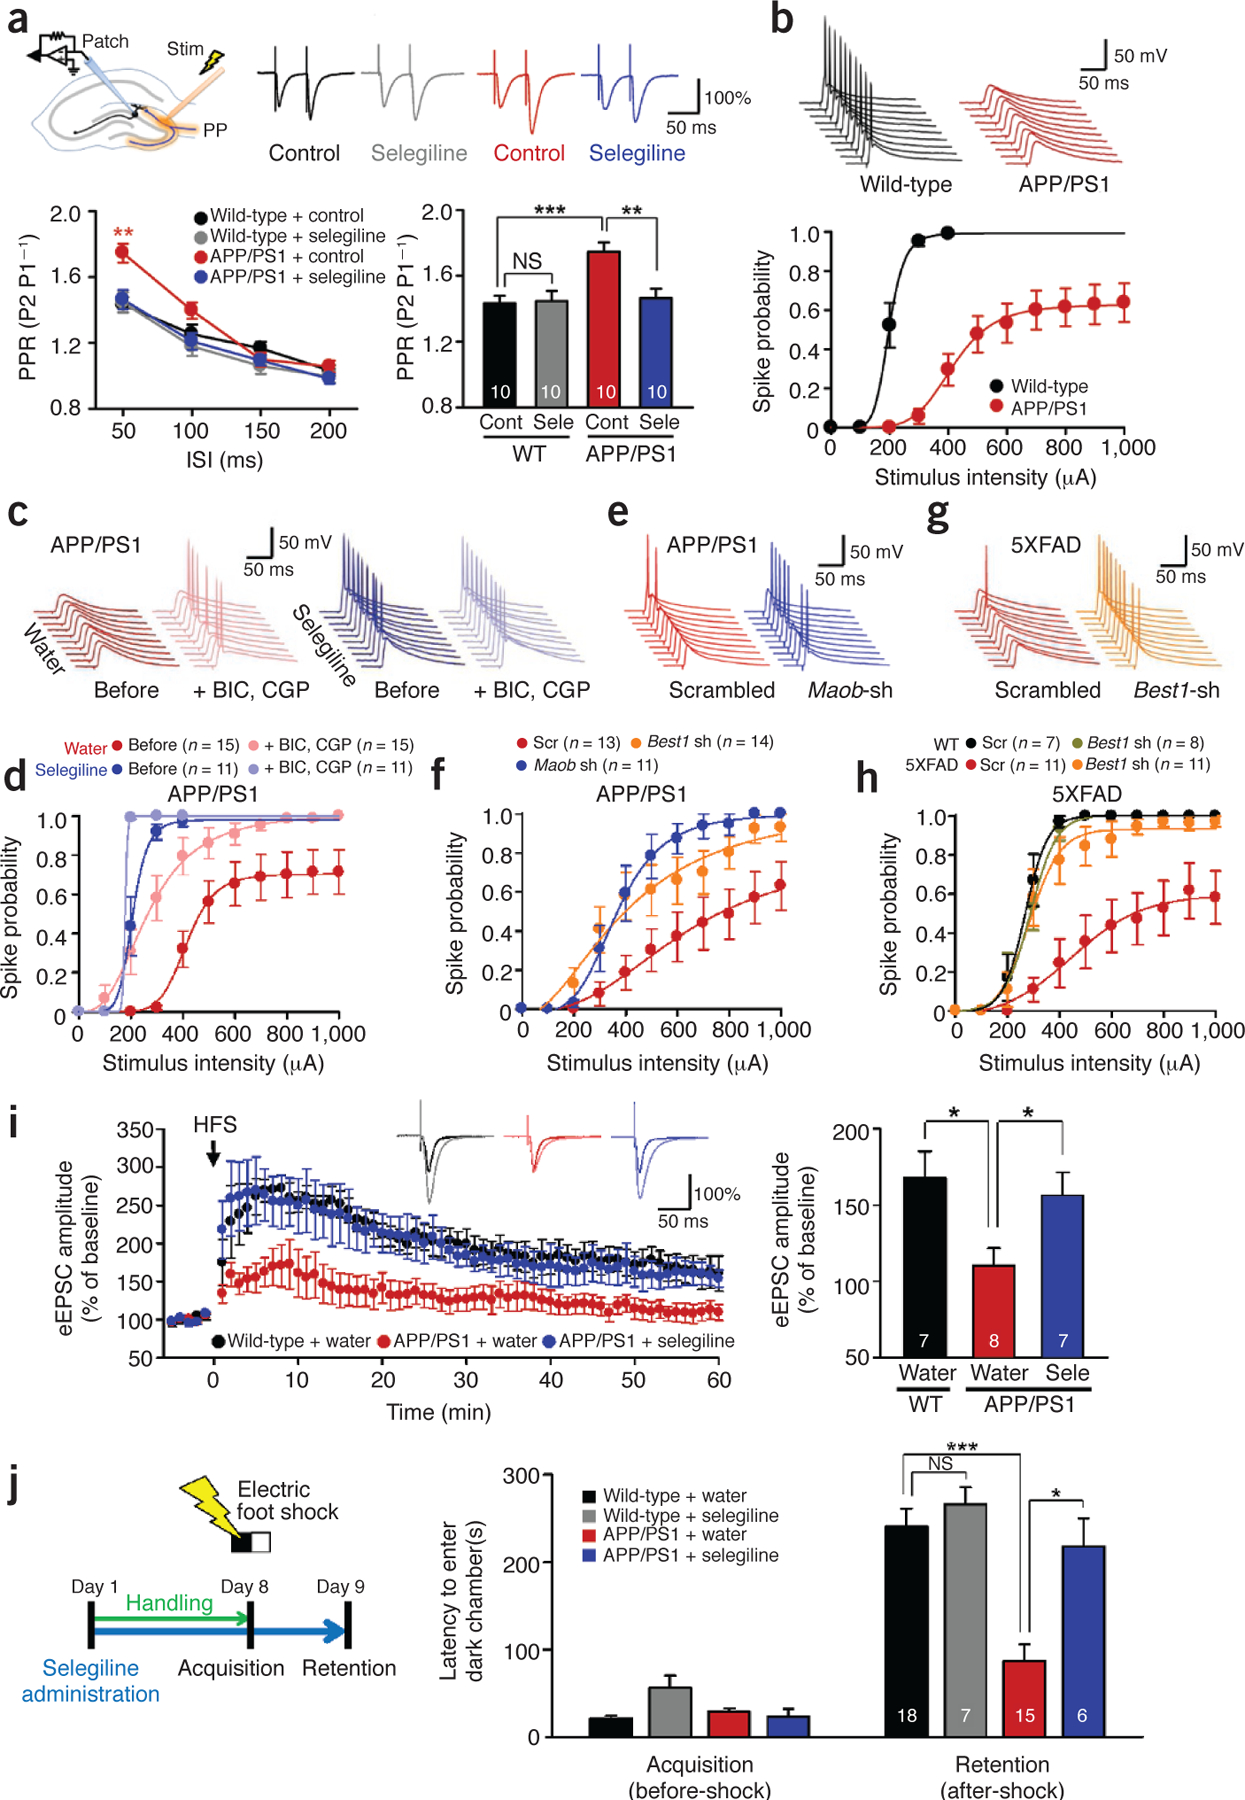
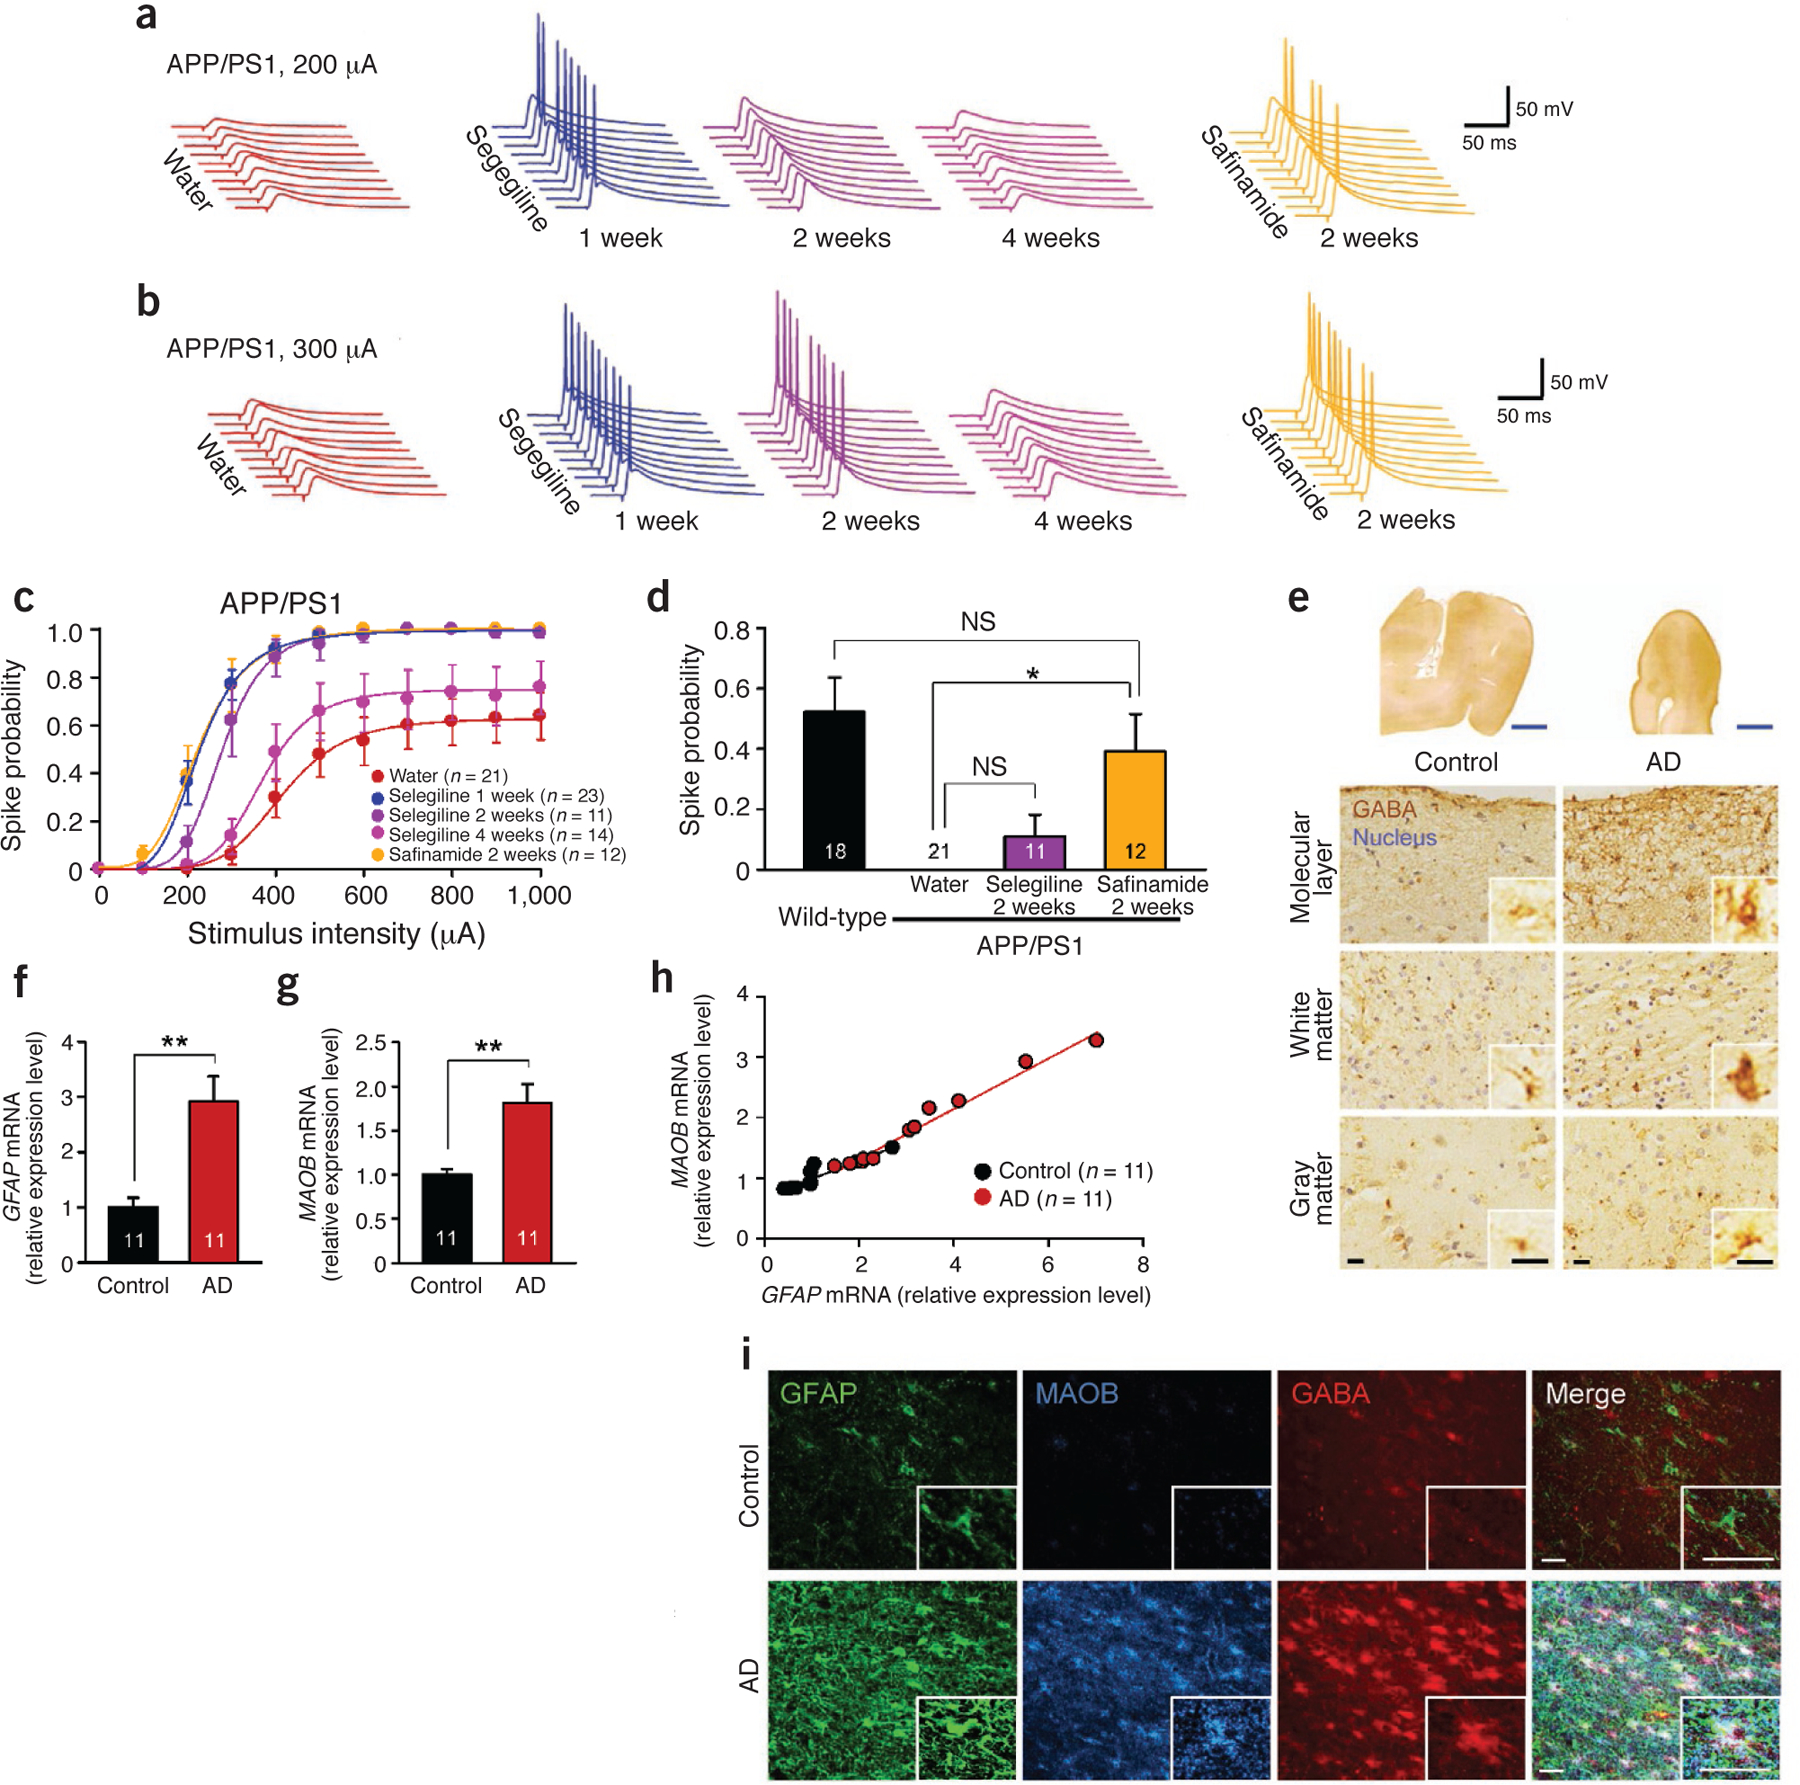
In Alzheimer's disease (AD), memory impairment is the most prominent feature that afflicts patients and their families. Although reactive astrocytes have been observed around amyloid plaques since the disease was first described, their role in memory impairment has been poorly understood. Here, we show that reactive astrocytes aberrantly and abundantly produce the inhibitory gliotransmitter GABA by monoamine oxidase-B (Maob) and abnormally release GABA through the bestrophin 1 channel. In the dentate gyrus of mouse models of AD, the released GABA reduces spike probability of granule cells by acting on presynaptic GABA receptors. Suppressing GABA production or release from reactive astrocytes fully restores the impaired spike probability, synaptic plasticity, and learning and memory in the mice. In the postmortem brain of individuals with AD, astrocytic GABA and MAOB are significantly upregulated. We propose that selective inhibition of astrocytic GABA synthesis or release may serve as an effective therapeutic strategy for treating memory impairment in AD.


Conflict of interest statement

COMPETING FINANCIAL INTERESTS

The authors declare no competing financial interests.

Figures

Figure 1
Figure 1
Increased tonic GABA release and GABA immunoreactivity in reactive astrocytes. (a) Thioflavin-S staining of amyloid plaques (yellowish green) in the hippocampus. Dotted line indicates DG (n ≥ 10 for each group; males at 10 months of age; scale bar, 200 μm). (b) In vivo microdialysis (males at 10–11 months of age). Left, validation of microdialyzed sites by cresyl violet staining (scale bar, 200 μm). Middle, GABA levels in dialysate measured by HPLC. ***P < 0.001 (Student’s t-test). Right, glutamate levels. NS, P > 0.05 (Student’s t-test). [GABA]o or [Glutamate]o, the concentrations of GABA or glutamate in outer space of cells. WT, wild type. (c) Representative trace of GABAA receptor–mediated current recorded from granule cells of the DG (n = 4 for WT; n = 7 for APP/PS1; both sexes at 8.5–13 months of age). Dashed lines and arrows indicate baseline shift with bicuculline (100 μM) application (gray bar). (d) Left, frequency of sIPSCs before bicuculline application. Right, amplitude of sIPSCs before bicuculline application. (e) Left, amplitude of tonic GABA current. *P < 0.05 (Student’s t-test). Right, density of tonic GABA current measured by dividing current amplitude by membrane capacitance. *P < 0.05 (Student’s t-test). (fh) Immunostaining and quantification of images taken from the molecular layer of DG (n = 5 for each group; both sexes at 8–11 months of age). (f) Representative confocal images of Gfap-, GABA- and thioflavin-S–stained plaques (scale bar, 20 μm). SR, striatum radiatum; SLM, striatum lacunosum moleculare; Py, pyramidal neuron layer; MoDG, molecular layer of dentate gyrus; GrDG, granule cell layer of dentate gyrus. (g) High-magnification images of an astrocyte. Arrowheads indicate GABAergic neurons (scale bar, 5 μm). (h) Top, mean intensity of GABA in GFAP-positive areas. **P < 0.01, *P < 0.05 (Student’s t-test). AU, arbitrary units. Middle, mean intensity of interneuronal GABA. Bottom, mean intensity of Gfap. (i) Left, representative western blots of Gfap in the DG (n = 3 for each group; both sexes at 11–11.5 months of age). Right, quantification of Gfap by densitometry. *P < 0.05 (Student’s t-test). (j) Left, a graticule with 20-μm density (gray) focused at the center of plaque (asterisks) was applied to confocal images (scale bar, 20 μm). Right, normalized intensity of astrocytic GABA according to the distance from the center of a plaque. 0% indicates background intensity, and 100% indicates the mean intensity of neuronal GABA in the same confocal image. Number on each bar refers to the number of mice (b,i), slices (d), images (h top and bottom, j), and cells (h middle) analyzed. n refers to the number of animals studied. Data are means ± s.e.m.
Figure 2
Figure 2
GABA is released from reactive astrocytes via redistributed Best1 channel. (a) Schematic diagram of sniffer-patch technique. Left pipette (yellow): pressure application of TFLLR to astrocyte (gray). Right pipette: recording pipette for HEK 293T cell expressing GABAC (green, sensor cell). (b) Representative trace of sensor current recorded in HEK 293T cell and induced by GABA from an astrocyte of wild-type, APP/PS1 and APP/PS1 with NPPB treatment (50 μM). Diamonds, TFLLR puffing (500 μM, 100 ms, 10 pounds per square inch (p.s.i.)). Inset, full activation of sensor by applying GABA (100 μM, red bar). (c) Left, peak amplitude of GABAC current normalized to full activation. *P < 0.05, ***P < 0.001 (Student’s t-test). Right, percentage of GABA-releasing astrocytes of which peak amplitude measured by sensor cell is higher than 3% of full activation. For b and c, n = 2 for WT; n = 4 for APP/PS1; n = 2 for APP/PS1 + NPPB; males at 8–18 months of age. (d) Quantitative real-time PCR (n = 5 for wild-type; n = 3 for APP/PS1; both sexes at 11–11.5 months of age). Relative expression level of Best1 mRNA in DG. (e) Immunostaining and quantification of Best1 in the molecular layer of DG (both sexes at 9 months of age; scale bar, 10 μm). Top, representative confocal images of an astrocyte. Bottom, percentage of Best1-positive areas in cell body and process or in microdomain over total area. **P < 0.01 (Student’s t-test). (f) Immunogold electron microscopy of Best1 in the molecular layer of DG (males at 12 months of age). Top, representative images of Best1 labeling (black dots indicated by arrowheads) in DAB-stained astrocytes (outlined with dashed lines). Pre, presynaptic terminal; Post, postsynapse; scale bar, 300 nm. Bottom left, density of gold particles for Best1 in cell body, process and microdomain. ***P < 0.001 (Student’s t-test). Bottom right, percentage of gold particles for Best1 located on the plasma membrane of cell body, process and microdomain. ***P < 0.001 (Student’s t-test). Number on each bar refers to the number of cells (c,e), mice (d) or images (f) analyzed. n refers to the number of animals studied. Data are means ± s.e.m.
Figure 3
Figure 3
Maob is responsible for GABA production in reactive astrocytes. (a) Immunostaining and quantification of Maob in the molecular layer of DG (females at 10 months of age). Top, representative confocal images of an astrocyte (scale bar, 10 μm). Bottom, mean intensity of Maob in Gfap-positive areas. ***P < 0.001 (Student’s t-test). (b) Reaction diagram of the enzyme activity assay of Maob in the hippocampus. (c) Maob activity normalized to the activity of wild-type mice in the whole hippocampus or subregions (n = 7 for wild-type whole; n = 5 for other groups; For CA1–CA3 and DG groups, left and right hippocampus were analyzed separately; males at 12 months of age). *P < 0.05 (Student’s t-test). (d,e) Immunostaining and quantification of astrocytic GABA after oral administration of selegiline (Sele; 10 mg kg d for 3 d) in APP/PS1 mice (n = 1 for wild-type; n = 3 for APP/PS1 with water; n = 4 for APP/PS1 with Sele; males at 12 months of age). (d) Representative confocal images of Gfap and GABA in the molecular layer of DG. Inset, magnified images. Scale bars, 30 μm for both main images and the insets. (e) Mean intensity of GABA in Gfap-positive areas. ***P < 0.001 (Student’s t-test). (f,g) Measurement of GABA release from acutely dissociated hippocampal astrocytes (n = 4 for APP/PS1; n = 1 for APP/PS1 + selegiline; males at 8–18 months of age). (f) Representative trace of sensor current induced by GABA from an astrocyte of an APP/PS1 mouse and an astrocyte from an APP/PS1 mouse with selegiline treatment (100 nM). Diamonds, TFLLR puffing (500 μM, 100 ms, 10 p.s.i.). The APP/PS1 group is the same group from Figure 2b. (g) Left, peak amplitude of GABAC current normalized to full activation. ***P < 0.001 (Student’s t-test). Right, percentage of GABA-releasing astrocytes of which peak amplitude measured by sensor cell is higher than 3% of full activation. The APP/PS1 group is the same group from Figure 2c. Number on each bar refers to the number of hippocampi (c), images (e) or cells (a,g) analyzed. n refers to the number of animals studied. Data are means ± s.e.m.
Figure 4
Figure 4
Maob-mediated production and Best1-mediated release of GABA in cultured hippocampal astrocytes. (a) Experimental protocol for sniffer-patch technique with cultured astrocytes. Putrescine (180 μM) and selegiline (100 nM) were present in culture medium overnight. Aβ42 (10 μM) was present in culture medium for 5 d. For Best1 knockdown experiments, Best1 shRNA or scrambled shRNA was transfected into astrocytes by electroporation. (b) Left, schematic diagram of sniffer-patch technique. Middle, representative traces recorded. Ca2+ transient recorded from Fura-2–loaded astrocyte (gray trace), whole-cell current recorded from GABAC-expressing sensor cell upon TFLLR pressure application (green trace), and full activation of sensor (blue trace) by applying GABA (100 μM, red bar). Right, fluorescence images for sniffer patch (scale bar, 50 μm). A sensor cell expresses GFP (top), and an astrocyte transfected with shRNA expresses mCherry (bottom). Data are representative of >100 recordings and 10 experiments. (c,d) Representative traces of sensor current induced by GABA from cultured astrocytes treated in naive conditions or with putrescine, putrescine and selegiline, or xanthine (50 μM) and xanthine oxidase (5 mU ml‒1) (c) or with Aβ42 or Aβ42 and selegiline (d). Diamonds, TFLLR puffing (500 μM, 100 ms, 10 p.s.i.). Data are representative of ≥10 recordings and 2 or 3 experiments. (e) Peak amplitude of sensor current normalized to full activation. *P < 0.05, **P < 0.01 (Student’s t-test). ***P < 0.001 (one-way analysis of variance (ANOVA) and Sheffe’s test). XO, xanthine oxidase. (f) Representative trace of sensor current induced by GABA from putrescine-treated astrocytes transfected with scrambled shRNA or Best1 shRNA. Data are representative of ≥10 recordings and 2 experiments. (g) Peak amplitude of GABAC current normalized to full activation. **P < 0.01 (Student’s t-test). (h) Representative trace of sensor current induced by GABA from Aβ42-treated astrocytes transfected with scrambled shRNA or Best1 shRNA. Data are representative of ≥10 recordings and 2 experiments. (i) Peak amplitude of GABAC current normalized to full activation. **P < 0.01 (Student’s t-test). Number on each bar refers to the number of cells recorded. Each cell was recorded once. n = 3 for Naive; n = 4 for Put; n = 1 for Put + Sele; n = 1 for Xan + XO; n = 4 for Aβ42; n = 3 for Aβ42 + Put; n = 2 for Aβ42 + Sele for e and n = 2 for each group in g,i. n indicates the number of animals tested. Data are means ± s.e.m.
Figure 5
Figure 5
Impaired presynaptic release probability, spike probability, synaptic plasticity, and learning and memory are fully rescued by targeting Maob or Best1. (a) PPR of eEPSCs recorded from dentate granule cells in wild-type and APP/PS1 mice with or without pretreatment with selegiline (100 μM) (n = 2 for each group; both sexes at 12–12.5 months of age). Top left, schematic diagram for input-output relationship, PPR, spike probability and LTP experiments in granule cells of DG. Stim, electrical stimulation; PP, perforant path. Top right, representative traces of eEPSCs evoked by paired-pulse stimuli at 300-μA intensity and 50-ms interpulse interval. Data are representative of >10 recordings and 2 experiments. Bottom left, PPR of eEPSCs plotted as a function of interspike intervals (ISIs). P < 0.05 for drug (two-way repeated-measures ANOVA); **P < 0.01 for APP/PS1 + control at 50 ms (one-way ANOVA and Bonferroni’s test). Bottom right, mean PPR measured at 50-ms interspike interval. **P < 0.01, ***P < 0.001 (two-way ANOVA and Bonferroni’s test). (b) Evoked spike probability by electrical stimulation of perforant path (0.1 Hz, 100 μs, 100–1,000 μA) (n = 3 for each group; both sexes at 12–13 months of age). Top, representative traces of evoked EPSPs and action potentials at 300-μA stimulation. Bottom, summary graph of spike probability versus stimulus intensity. (c) Representative trace of evoked EPSPs in the DG granule cells of APP/PS1 mice treated with GABA receptor antagonists (BIC: 10 μM bicuculline, CGP: 5 μM CGP55845) and the Maob inhibitor selegiline (10 mg kg‒1 d‒1 oral administration for 7 d) at 300-μA stimulation (n = 3 for water; n = 2 for selegiline; both sexes at 12–13 months of age). Experiments were repeated more than twice. (d) Summary graph of spike probability of granule cells recorded in Figure 5c versus stimulus intensity. (e) Representative traces of evoked EPSPs in the DG granule cells of APP/PS1 mice injected with scrambled, Best1 or Maob shRNA at 400-mA stimulation (n = 3 for scrambled; n = 2 for Best1 shRNA; n = 2 for Maob shRNA; both sexes at 10–11 months of age). Experiments were repeated more than twice. (f) Summary graph of spike probability of granule cells recorded in Figure 5e versus stimulus intensity. (g) Representative traces of evoked EPSPs in the DG granule cells of 5XFAD mice injected with scrambled or Best1 shRNA at 400-mA stimulation (n = 2 for WT scrambled; n = 2 for WT Best1 shRNA; n = 3 for 5XFAD scrambled; n = 3 for 5XFAD Best1 shRNA; males at 7–8 months of age). (h) Summary graph of spike probability of granule cells recorded in Figure 5g versus stimulus intensity. (i) LTP recorded from dentate granule cells of wild-type and APP/PS1 mice with or without oral administration of selegiline (10 mg kg‒1 d‒1 for 7 d). Left, potentiation of perforant path–evoked eEPSCs induced by high-frequency stimulation (HFS, indicated by arrow) in granule cells. Inset traces, representative traces of eEPSCs during 0.1-Hz frequency transmission before and after the induction of potentiation. Shown are eEPSCs recorded at 60 min after the HFS, normalized to the amplitude of the corresponding response in the baseline. Right, mean amplitudes of eEPSCs recorded from 50 to 60 min after HFS. *P < 0.05 (Student’s t-test) (n = 3 for each group; both sexes at 8.5–9 months of age). (j) Passive avoidance test from wild-type and APP/PS1 mice with or without oral administration of selegiline. Left, experimental protocol for passive avoidance test. Right, latency to enter dark chamber during passive avoidance test for wild-type and APP/PS1 mice with or without oral administration of selegiline (10 mg kg‒1 d‒1 for 7 d, both sexes at 10–12 months of age). Two-way repeated-measures ANOVA revealed significant effects for the genotype (F(1,42) = 18.630, P = 0.000), significant effects for the drug (F(1,42) = 12.494, P = 0.001), without significant interaction effect between genotype and drug. ***P < 0.001, *P < 0.05 (Bonferroni’s post hoc analysis). Number on each bar refers to the number of cells (a,b,d,f,h,i) and mice (j) analyzed. n refers to the number of animals tested. Each cell was recorded once for each stimulus intensity. Data are means ± s.e.m.
Figure 6
Figure 6
Clinical relevance of GABA from reactive astrocytes. (ad) Evoked spike probability by electrical stimulation of perforant path (0.1 Hz, 100 μs, 100–1,000 μA) (for selegiline 2 weeks and 4 weeks and safinamide 2 weeks, n = 2 mice for each group; both sexes at 10–12 months of age). Each cell was recorded once for each stimulus intensity. (a) Representative traces of evoked EPSPs with selegiline or safinamide (10 mg kg‒1 d‒1 oral administration) at 200-μA stimulation. (b) Representative traces of evoked EPSPs at 300 μA stimulation. (c) Summary graph of spike probability versus stimulus intensity. Water group is the same group from Figure 5f; selegiline 1-week group includes the 11 cells of the selegiline before group in Figure 5h. (d) Comparison of spike probability at 200-μA stimulation after 2 weeks of administration of Maob inhibitors. Wild-type group and Water group are the same groups from Figure 5f. One-way ANOVA and Scheffe’s test; *P < 0.05. (e) Immunohistochemistry of GABA and hematoxylin-stained nuclei in the temporal cortex of human postmortem brain. Inset, magnified images. Blue scale bars, 5 mm; black scale bars, 15 μm. (f) Relative expression level of GFAP mRNA measured by quantitative real-time PCR. **P < 0.01 (Student’s t-test). (g) Relative expression level of MAOB mRNA. **P < 0.01 (Student’s t-test). (h) Scatter plot shows positive correlation between GFAP and MAOB mRNA extent. Control: r = 0.89, P < 0.0005; subject with AD: r = 0.99, P < 0.0001 (simple correlation analysis). (i) Confocal images of GFAP, MAOB and GABA abundance. Inset, magnified images of AD and control astrocytes. Scale bars, 30 μm. Number on each bar refer to the number of cells (c,d) or human cases (fh) analyzed. Data are means ± s.e.m.

References

    1. Alzheimer’s Association. 2012 Alzheimer’s disease facts and figures. Alzheimers Dement 8, 131–168 (2012). - PubMed
    1. Mattson MP. Pathways towards and away from Alzheimer’s disease. Nature 430, 631–639 (2004). - PMC - PubMed
    1. Mucke L & Selkoe DJ. Neurotoxicity of amyloid β-protein: synaptic and network dysfunction. Cold Spring Harb. Perspect. Med 2, a006338 (2012). - PMC - PubMed
    1. Ballatore C, Lee VM-Y & Trojanowski JQ. Tau-mediated neurodegeneration in Alzheimer’s disease and related disorders. Nat. Rev. Neurosci 8, 663–672 (2007). - PubMed
    1. Eddleston M & Mucke L. Molecular profile of reactive astrocytes—implications for their role in neurologic disease. Neuroscience 54, 15–36 (1993). - PMC - PubMed

Publication types

MeSH terms