. 2014 Aug;11(8):847-54.
doi: 10.1038/nmeth.3016. Epub 2014 Jun 29.

A method to recapitulate early embryonic spatial patterning in human embryonic stem cells

Affiliations

A method to recapitulate early embryonic spatial patterning in human embryonic stem cells

Aryeh Warmflash et al. Nat Methods. 2014 Aug.

Abstract

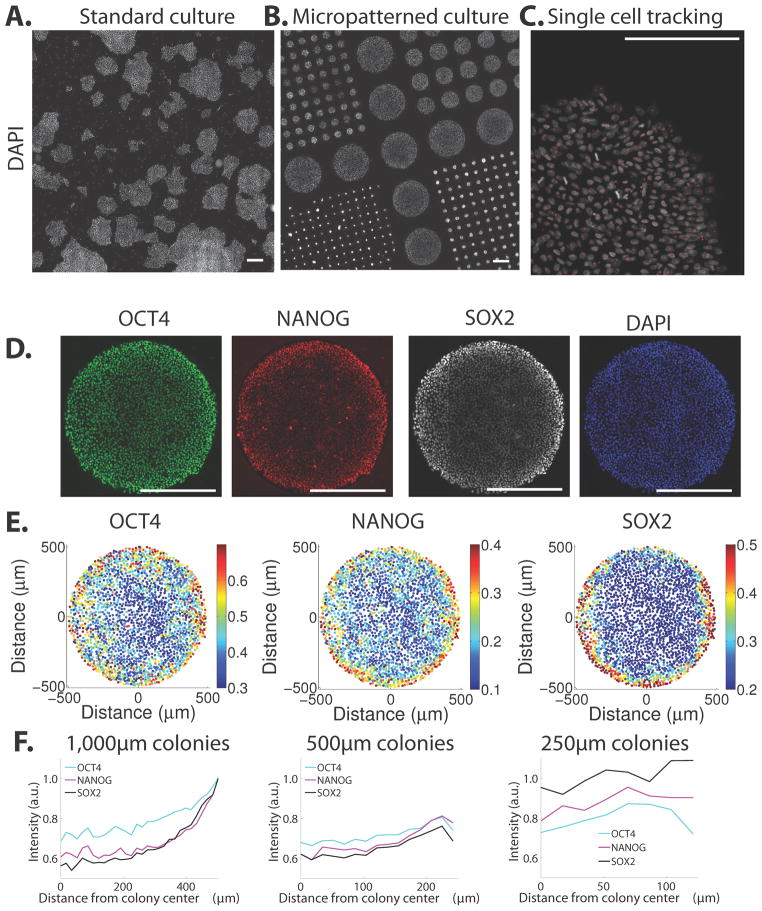
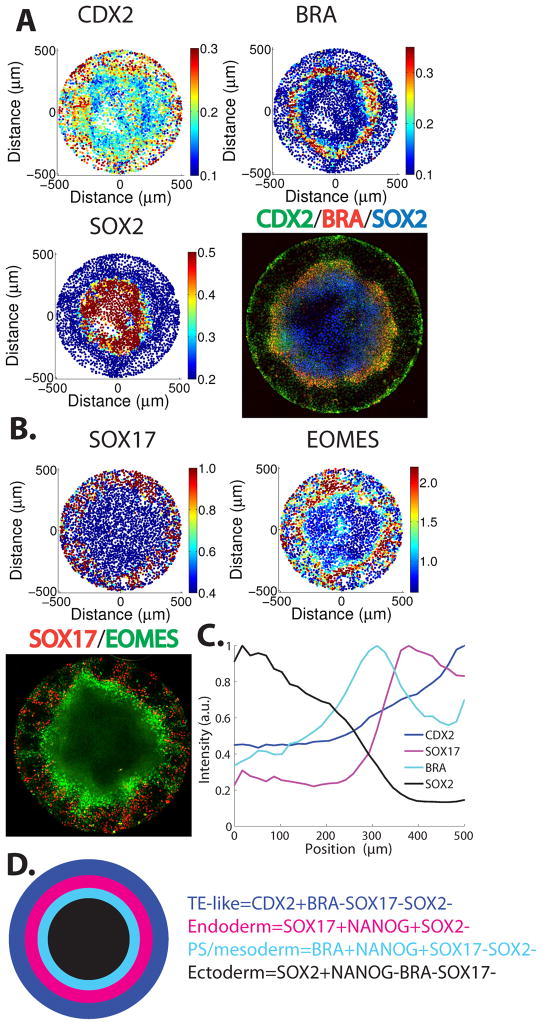
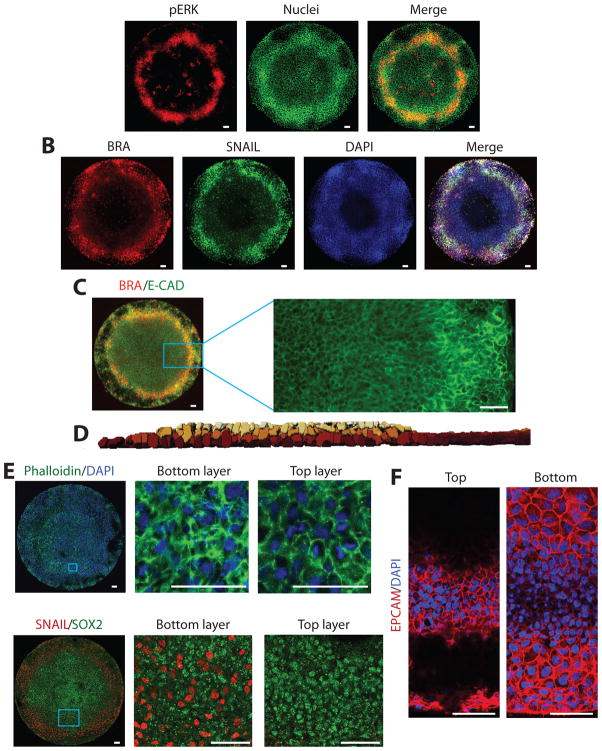
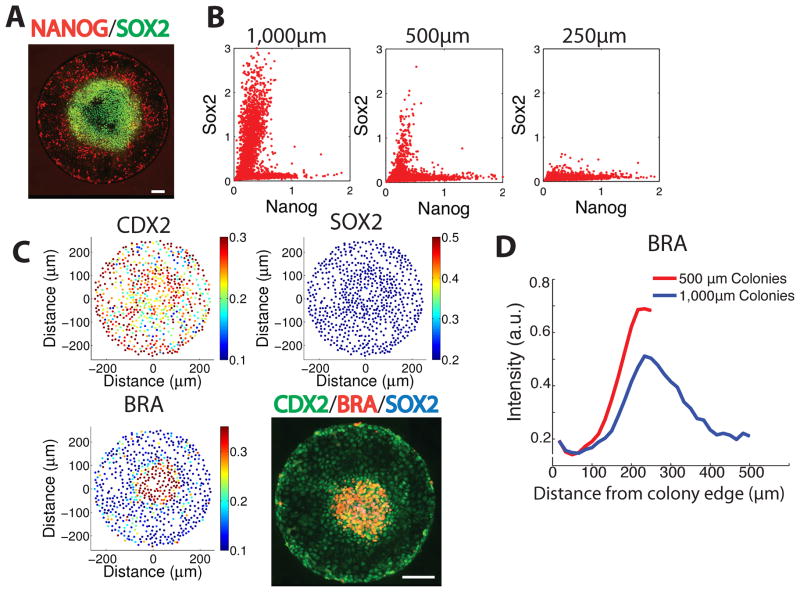
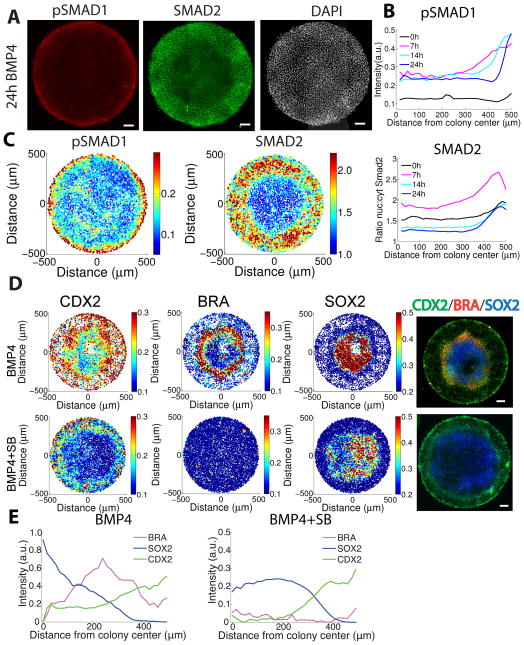
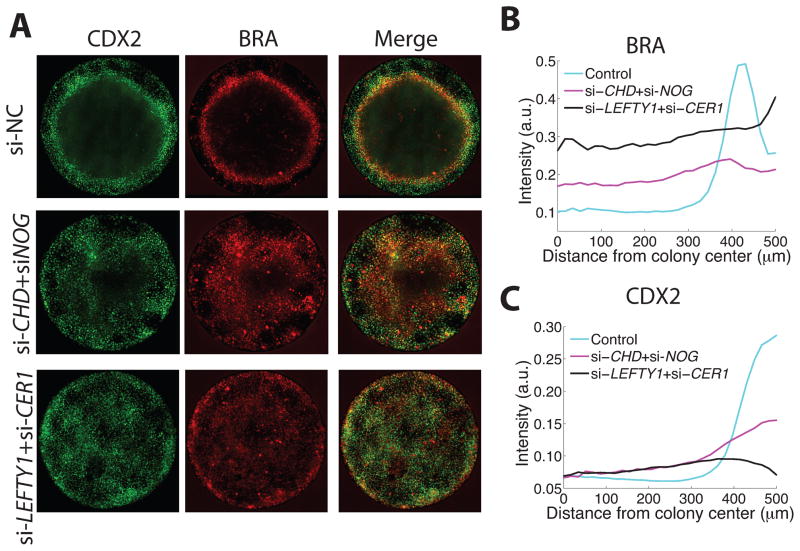
Embryos allocate cells to the three germ layers in a spatially ordered sequence. Human embryonic stem cells (hESCs) can generate the three germ layers in culture; however, differentiation is typically heterogeneous and spatially disordered. We show that geometric confinement is sufficient to trigger self-organized patterning in hESCs. In response to BMP4, colonies reproducibly differentiated to an outer trophectoderm-like ring, an inner ectodermal circle and a ring of mesendoderm expressing primitive-streak markers in between. Fates were defined relative to the boundary with a fixed length scale: small colonies corresponded to the outer layers of larger ones. Inhibitory signals limited the range of BMP4 signaling to the colony edge and induced a gradient of Activin-Nodal signaling that patterned mesendodermal fates. These results demonstrate that the intrinsic tendency of stem cells to make patterns can be harnessed by controlling colony geometries and provide a quantitative assay for studying paracrine signaling in early development.


Conflict of interest statement

Competing financial interests

The authors declare no competing financial interests.

Figures

Figure 1
Figure 1. Stem cells grown in the pluripotent state show prepatterning in micropatterned culture
(A–B) Tiled scans of RUES2 hESCs grown under standard (A) and micropatterned (B) conditions show heterogeneous and standardized colony geometries, respectively. (C) A single image from the tiled scan with all cells identified computationally. (D) Immunofluorescence analysis shows cells in the micropatterned colonies maintain expression of pluripotency markers (E) Quantification of expression of markers of the colony shown in (D). Each dot represents a single cell and the color represents the intensity of the indicated marker normalized to the intensity of the DAPI stain. (F) Quantification of average nuclear intensity from immunofluorescence data shows that markers are elevated at the colony edges. In all cases, nuclei were identified using the DAPI nuclear counterstain and the intensity of the indicated markers was normalized to the DAPI intensity to prevent imaging artifacts. All scale bars are 500 μm.
Figure 2
Figure 2. Stem cells differentiated on micropatterns form self-organized spatial patterns
(A–B) Immunofluoresence for fate markers shows patterns along the radial axis of the colonies. Cells were seeded on micropatterned coverslips, grown overnight, and then treated with BMP4 for 42 hours. Each panel corresponds to a single colony while each dot corresponds to a single cell. (C) Quantification of immunofluorescence data showing that germ layer markers are induced at particular radii. (D) Schematic of the results of 42hours of BMP4 treatment in micropatterned culture.
Figure 3
Figure 3. During differentiation cells undergo EMT in a region expressing markers of the primitive streak
(A) Cells in the PS-like region have high levels of pERK. (B) Cells in the PS-like region express SNAIL. (C) Cells in the PS-like region internalize E-CAD. BRA expression is not shown in the blow-up for clarity (D) 3D reconstruction showing that the PS-streak like region is 2–3 cells deep. (E) Phalloidin staining reveals differences in cytoskeletal organization in the upper and lower layers of the PS-like region. The blue box in the left panel shows the region expanded in the individual confocal slices in the other two panels. (F) Immunofluorescence for EpCam shows it is only expressed in the upper epithelial layer (left) of the PS-like region and is absent from the cells below (right). Each panel is an individual confocal slice. (G) Cells in the lower region of the culture express SNAIL while those in the upper layer express the epiblast/ectoderm marker SOX2. The left panel is a maximum intensity projection of the entire confocal stack while the center and right panels show blow-ups of individual confocal slices. All scale bars are 50 μm.
Figure 4
Figure 4. Control of cell fate extends from the edge of the colony
(A) Immunofluorescence for SOX2 and NANOG in a 1000μm colony following 42h BMP4 treatment. (B) Quantification of single cell expression of SOX2 and NANOG from immunofluorescence data showing a shift from the SOX2+ ectodermal population towards the NANOG+ mesendodermal population as the colony size is reduced. (C) Immunfluorescence in a 500 μm colony shows BRACHYURY expression at the center rather than in an annulus at fixed radius and the absence of staining for SOX2. Quantification of markers with single-cell resolution in a 500μm colony shows an absence of SOX2 and the expression of BRA in the colony center. (D) Comparison of BRACHYURY expression between 500μm and 1000μm colonies shows the spatial scale of expression is the same in the two sizes. Note the distance scale is inverted relative to previous panels to emphasize control from the boundary. All scale bars are 100μm.
Figure 5
Figure 5. Self-organized signaling responses in micropatterned colonies
(A) Immunofluorescence for pSMAD1 and SMAD2 after 24h of BMP4 treatment showing the BMP4 response is sustained only at the colony border while Activin/Nodal signaling forms a broader gradient. (B) Quantification of average pSMAD1 intensity and SMAD2 nuclear:cytoplasmic ratio as a function of time after treatment with 50 ng/ml BMP4 in 1000um diameter colonies. (C) Quantification of pSMAD1 and SMAD2 responses in the colony shown in (A). Each dot represents a single cell. (D) Immunofluorescence of RUES2 colonies treated with 50 ng/ml BMP4 with or without 10μM SB431542 showing that Activin/Nodal signaling is required for mesendodermal differentiation. All scale bars are 100μm. (E) Profiles showing that the inhibition of Activin/Nodal signaling by SB eliminates BRA expression and also the portion of CDX2 that overlaps BRA.
Figure 6
Figure 6. TGF-β inhibitors are required for pattern formation
(A) Immunofluorescence showing the expansion of the mesodermal territory at the expense of the ectoderm when either BMP inhibitors or Activin/Nodal inhibitors are knocked-down using siRNA. (B) Quantification showing that loss of BMP inhibitors increases BRA expression at the colony center, while loss of Activin/Nodal inhibitors increases BRA expression on both sides of the PS-like region. (C) Quantification of CDX2 expression, showing that loss of either BMP or Activin/Nodal inhibitors causes expansion of mesodermal CDX2 expression, and loss of Activin/Nodal inhibitors also causes a decrease in trophoblast-like CDX2 expression at the colony border.

References

    1. Arnold SJ, Robertson EJ. Making a commitment: cell lineage allocation and axis patterning in the early mouse embryo. Nat Rev Mol Cell Biol. 2009;10:91–103. - PubMed
    1. D’Amour KA, et al. Efficient differentiation of human embryonic stem cells to definitive endoderm. Nat Biotechnol. 2005;23:1534–1541. - PubMed
    1. Chambers SM, et al. Highly efficient neural conversion of human ES and iPS cells by dual inhibition of SMAD signaling. Nat Biotechnol. 2009;27:275–280. - PMC - PubMed
    1. Kattman SJ, et al. Stage-specific optimization of activin/nodal and BMP signaling promotes cardiac differentiation of mouse and human pluripotent stem cell lines. Cell Stem Cell. 2011;8:228–240. - PubMed
    1. Ozair MZ, Noggle S, Warmflash A, Krzyspiak JE, Brivanlou AH. SMAD7 Directly Converts Human Embryonic Stem Cells to Telencephalic Fate by a Default Mechanism. Stem Cells. 2012;31:35–47. - PMC - PubMed

Publication types

MeSH terms

Substances