. 2014 Jun 28;106(7):dju161.
doi: 10.1093/jnci/dju161. Print 2014 Jul.

Modulation of age- and cancer-associated DNA methylation change in the healthy colon by aspirin and lifestyle

Affiliations

Modulation of age- and cancer-associated DNA methylation change in the healthy colon by aspirin and lifestyle

Faiza Noreen et al. J Natl Cancer Inst. .

Abstract

Background: Aberrant DNA methylation in gene promoters is associated with aging and cancer, but the circumstances determining methylation change are unknown. We investigated the impact of lifestyle modulators of colorectal cancer (CRC) risk on the stability of gene promoter methylation in the colonic mucosa.

Methods: We measured genome-wide promoter CpG methylation in normal colon biopsies (n = 1092) from a female screening cohort, investigated the interaction of lifestyle factors with age-dependent increase in methylation with log-linear multivariable regression, and related their modifying effect to hypermethylation in CRC. All statistical tests were two-sided.

Results: Of 20025 promoter-associated CpGs analyzed, 1713 showed statistically significant age-dependent methylation gains. Fewer CpGs acquired methylation in users of aspirin (≥ 2 years) and hormonal replacement therapy (HRT age ≥ 50 years) compared with nonusers (43 vs 1355; 1 vs1377, respectively), whereas more CpGs were affected in smokers (≥ 20 years) and individuals with a body mass index (BMI) of 25 kg/m(2) and greater compared with control groups (180 vs 39; 554 vs 144, respectively). Fifty percent of the CpGs showing age-dependent methylation were found hypermethylated in CRC (odds ratio [OR] = 20; 95% confidence interval [CI] = 18 to 23; P < 2 × 10(-16)). These loci gained methylation with a higher median rate compared with age-only methylated sites (P = 2 × 10(-76)) and were enriched for polycomb regions (OR = 3.67). Importantly, aspirin (P < .001) and HRT use (P < .001) reduced the methylation rate at these cancer-related genes, whereas smoking (P < .001) and high BMI (P = .004) increased it.

Conclusions: Lifestyle, including aspirin use, modulates age-associated DNA methylation change in the colonic epithelium and thereby impacts the evolution of cancer methylomes.


Figures

Figure 1.
Figure 1.
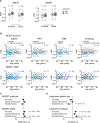
Association of human MutL homolog 1 (hMLH1) and O6-methylguanine DNA methyltransferase (MGMT) promoter methylation with lifestyle factors and polyps. A) hMLH1 and MGMT promoter methylation in proximal (cecum) and distal (sigmoid) colon as percentages of methylated alleles (PMAs) determined by locus normalized quantitative methylation specific polymerase chain reaction (ln-qMSP). For presentation only, age is shown in two groups as indicated. Shown are median (lines) and mean (black circles) PMAs with interquartile ranges (boxes), 1.5 times the interquartile ranges (whiskers), and extreme values (gray lines). B) Association between age-dependent MGMT promoter methylation and lifestyle factors. Each point represents one biopsy. P values are derived from log-linear multivariable regression analysis (Supplementary Table 3, available online) representing significance of the difference in two regression lines. C) Association of MGMT promoter methylation with the occurrence of polyps. Methylation rate ratios (MRRs) and P values are derived from log-linear multivariable regression (Supplementary Table 4, available online). D) Association of lifestyle parameters with the occurrence of polyps. Odds ratios (ORs) and P values are derived from logistic multivariable regression analysis (Supplementary Table 5, available online). BMI = body mass index; CI = confidence interval; HRT = hormone replacement therapy. All statistical tests were two-sided.
Figure 2.
Figure 2.
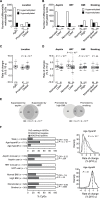
Genome-wide DNA methylation and its association with lifestyle factors. A and B) Numbers of age-associated differentially methylated CpGs in all samples or when stratified by colon location (proximal [cecum] vs distal [sigmoid]) and lifestyle factors (aspirin: nonuser vs user [long-term]; hormone replacement therapy [HRT]: nonuser vs user [aged ≥50 years]; body mass index [BMI]: normal vs high [>25kg/m2]; smoking: nonsmoker vs smoker [long-term]). Numbers of samples tested in each category are indicated at the bottom of each bar. C and D) Ten-year rates of DNA methylation change for CpGs showing age-associated hypermethylation in all samples or when stratified by colon location and lifestyle factors. Shown are median (lines) and mean (black circles) rates with interquartile ranges (boxes), 1.5 times the interquartile ranges (whiskers), and extreme values (gray lines). P values according to the Wilcoxon rank sum test. E) Concordance of probes showing suppression of age-associated methylation by aspirin-use and HRT or promotion of age-associated methylation by a high BMI and long-term smoking. P values and odds ratios (ORs) according to the Fisher exact test. F) Enrichment of age-associated differentially methylated sites marked by histone 3 lysine 27 tri-methylation (H3K27me3) in human embryonic stem cells (hESCs). Barplots indicate percentages of age-associated hypermethylated (Age-hyperM) and hypomethylated (Age-hypoM) CpGs either marked by H3K27me3 (positive) or not (negative), or the enrichment of CpGs marked by H3K27me3 in lifestyle modulated age-related hypermethylation (bottom). Odds ratios and P values according to Fisher exact test. Density plots on the right show the rate of change in Age-hyperM and Age-hypoM probes at H3K27me3 positive (gray line) and negative (black, dashed line) CpGs. Dashed vertical lines indicate median rate of change per 10 years of age. PcG = polycomb group. All statistical tests were two-sided.
Figure 3.
Figure 3.
Enrichment of colorectal cancer (CRC)–associated hypermethylation in age-related methylated genes. A) Differences in DNA methylation between 59 CRC samples (21) of female patients and 178 normal biopsies. Plotted are difference in log2-fold change (FC) in DNA methylation on the x-axis with false discovery rate (FDR)–adjusted P values (calculated by moderated t statistics; -1 × log10 scale) on the y-axis. CpGs statistically significantly hypermethylated in CRC are highlighted in red (n = 1709; FDR-adjusted P < .0001; FC > 2). B) Intersection between age-related hypermethylated CpGs in healthy mucosa and CpGs hypermethylated in tumor samples. Barplots indicate percentages of CpGs marked by histone 3 lysine 27 tri-methylation (H3K27me3) in each intersection (Age-only Age–Cancer, Age-only, Cancer-only). The boxplot shows median rates of DNA methylation change per 10 years for age–tumor vs age-only hypermethylated loci. Shown are median (lines) and mean (black circles) rates with interquartile ranges (boxes), 1.5 times the interquartile ranges (whiskers), and extreme values (gray lines). C) Intersection between 1287 age-related hypermethylated genes (n = 1713 CpGs) in the normal colon mucosa and genes downregulated (FDR-adjusted P ≤ .05) in colon adenomas (22). D) Intersection between genes statistically significantly hypermethylated over age in the normal colon mucosa, genes hypermethylated in CRC samples, and genes downregulated in colon adenomas. Odds ratios (ORs) and associated P values were calculated according to the Fisher exact test. P values for the difference in median rates of DNA methylation change were calculated according to the Wilcoxon rank sum test. All statistical tests were two-sided.
Figure 4.
Figure 4.
Modulation of cancer-associated hypermethylation by lifestyle factors. A) Concordance between genes showing modulation of age-associated methylation by lifestyle parameters and hypermethylation in colorectal cancer (CRC). Enrichment in each category is calculated over the percentage of 11872 genes (n = 20025 CpGs) present on the Illumina array (Total). Odds ratios (ORs) and P values were calculated according to the Fisher exact test. n = number of genes. B) Median rates of DNA methylation on 664 annotated tumor-associated genes (TAG database) (27). n = number of tumor-associated genes hypermethylated in each category. P values are calculated by Wilcoxon rank sum test. Shown are median (lines) and mean (black circles) rates with interquartile ranges (boxes), 1.5 times the interquartile ranges (whiskers), and extreme values (gray lines). C) Mode for the modulation of CRC risk by lifestyle factors (41). Inherent DNA methylation instability generates epigenetic mosaicism (gray cells) in the aging colonic epithelium. Some methylation changes will affect transcription of genes controlling carcinogenesis, eventually contributing to the evolution of premalignant (gray cell cluster) and cancer cells (red cell cluster). Lifestyle factors are capable of negatively (blue arrow) or positively (green arrow) influencing progressive age-related methylation change, thereby connecting lifestyle with cancer risk. BMI = body mass index; HRT = hormone replacement therapy; OR = odds ratio. All statistical tests were two-sided.

Similar articles

Cited by

References

    1. You JS, Jones PA. Cancer genetics and epigenetics: two sides of the same coin? Cancer Cell. 2012;22(1):9–20 - PMC - PubMed
    1. De Carvalho DD, Sharma S, You JS, et al. DNA methylation screening identifies driver epigenetic events of cancer cell survival. Cancer Cell. 2012;21(5):655–667 - PMC - PubMed
    1. Sandoval J, Esteller M. Cancer epigenomics: beyond genomics. Curr Opin Genet Dev. 2012;22(1):50–55 - PubMed
    1. Baylin SB, Jones PA. A decade of exploring the cancer epigenome—biological and translational implications. Nat Rev Cancer. 2011;11(10):726–734 - PMC - PubMed
    1. Hoeijmakers JH. DNA damage, aging, and cancer. N Engl J Med. 2009;361(15):1475–1485 - PubMed

Publication types

Substances