Review
. 2014 Sep;30(6):619-34.
doi: 10.1016/j.ejmp.2014.05.011. Epub 2014 Jun 26.

Micro-CT of rodents: state-of-the-art and future perspectives

Affiliations
Review

Micro-CT of rodents: state-of-the-art and future perspectives

D P Clark et al. Phys Med. 2014 Sep.

Abstract

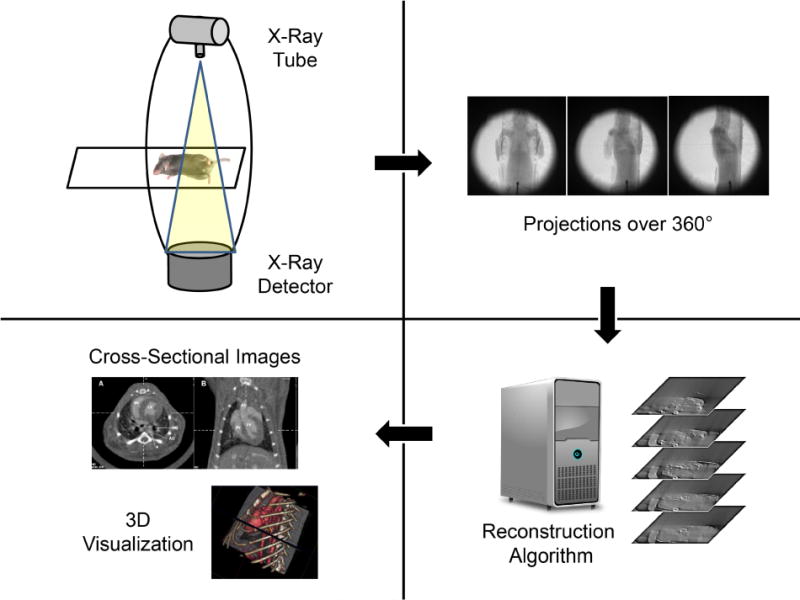
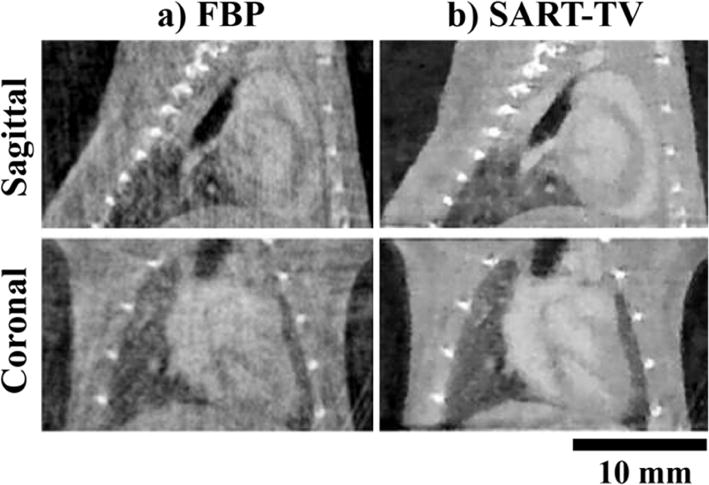
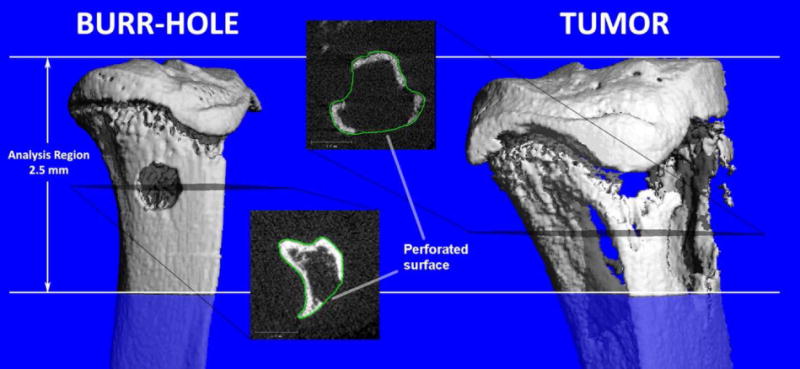
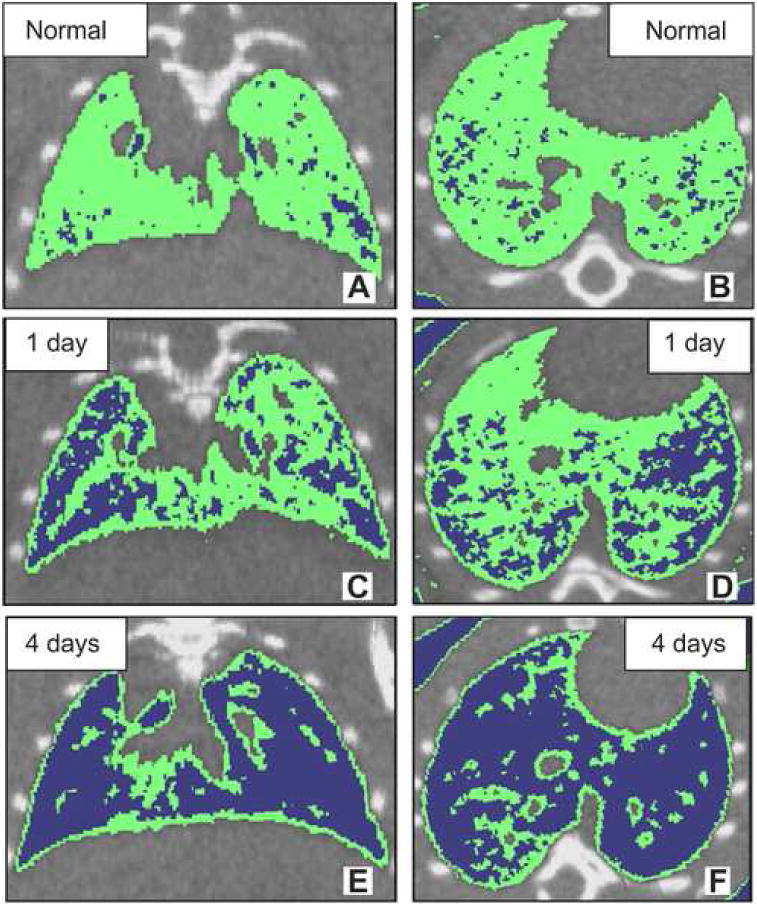
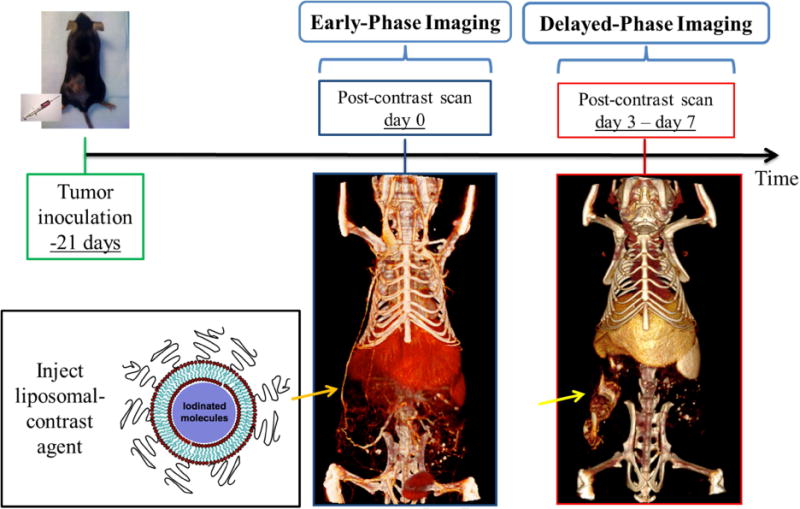
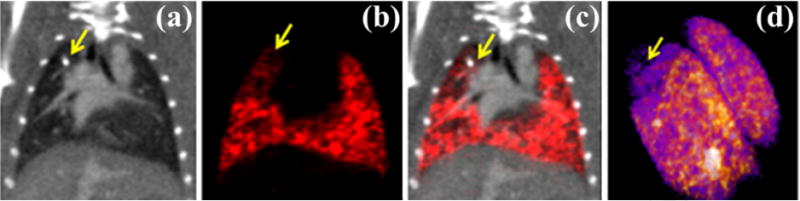
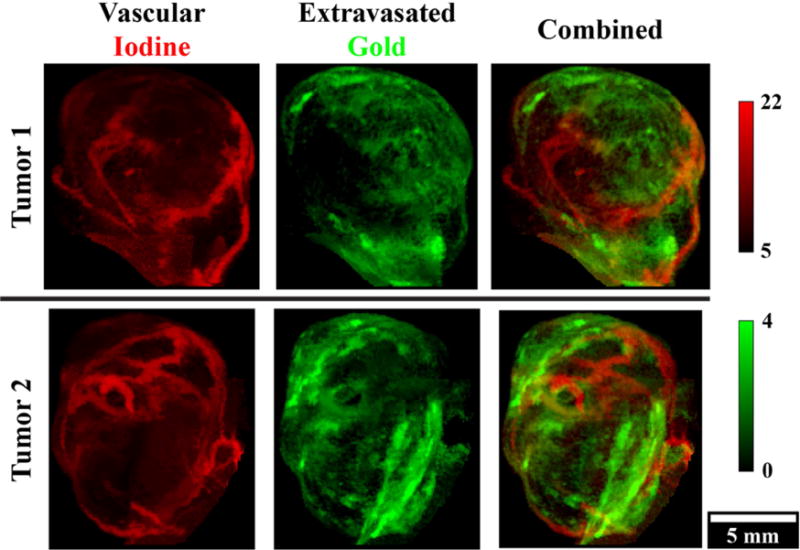
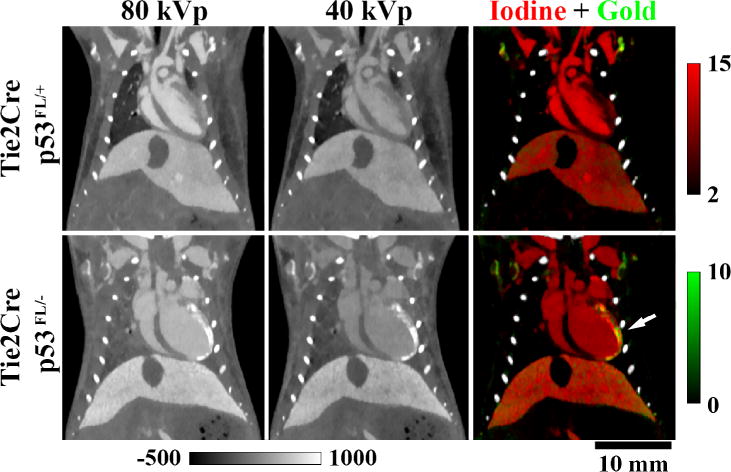
Micron-scale computed tomography (micro-CT) is an essential tool for phenotyping and for elucidating diseases and their therapies. This work is focused on preclinical micro-CT imaging, reviewing relevant principles, technologies, and applications. Commonly, micro-CT provides high-resolution anatomic information, either on its own or in conjunction with lower-resolution functional imaging modalities such as positron emission tomography (PET) and single-photon emission computed tomography (SPECT). More recently, however, advanced applications of micro-CT produce functional information by translating clinical applications to model systems (e.g., measuring cardiac functional metrics) and by pioneering new ones (e.g. measuring tumor vascular permeability with nanoparticle contrast agents). The primary limitations of micro-CT imaging are the associated radiation dose and relatively poor soft tissue contrast. We review several image reconstruction strategies based on iterative, statistical, and gradient sparsity regularization, demonstrating that high image quality is achievable with low radiation dose given ever more powerful computational resources. We also review two contrast mechanisms under intense development. The first is spectral contrast for quantitative material discrimination in combination with passive or actively targeted nanoparticle contrast agents. The second is phase contrast which measures refraction in biological tissues for improved contrast and potentially reduced radiation dose relative to standard absorption imaging. These technological advancements promise to develop micro-CT into a commonplace, functional and even molecular imaging modality.

Keywords: Bone; Heart; Lung; Micro-CT; Nanoparticles; Rodents; Tumors; X-ray.


Figures

Fig. 1
Fig. 1
Schematic of the micro-CT imaging process with image acquisition of cone beam projections and reconstruction and visualization of tomographic data.
Fig. 2
Fig. 2
In vivo, murine, cardiac micro-CT images in sagittal and coronal orientations reconstructed from only 95 retrospectively gated, cone-beam projections. In column (a) reconstruction was performed using filtered backprojection (FBP), while in column (b) simultaneous algebraic reconstruction with total variation based regularization (SART-TV) was used. Note the decrease of artifacts in column (b).
Fig. 3
Fig. 3
Visualization of bone defects in the proximal tibia of a mouse by in vivo micro-CT: a 0.7 mm diameter burr-hole (left), and an osteolytic bone tumor (right). The proximal 2.5 mm of the tibia was analyzed for both types of defects. The transverse gray scale images show breaks in the cortex arising from the defects. The operator provides manually drawn contours approximating an intact bone for the analysis. Figure reproduced from [105] with permission.
Fig. 4
Fig. 4
In vivo micro-CT in normal (A and B) and radiation-induced lung injury mice (C, D, E and F). Top panel: micro-CT images of normal mouse lung (A and B). Middle panel: micro-CT images of radiation-induced mouse lung injury at 1 day after x-ray exposure (C and D). Bottom panel: micro-CT images of radiation-induced mouse lung injury at 4 days after x-ray exposure (E and F). (A, C and E) transaxial slice orientation. (B, D and F) horizontal slice orientation. Areas of density between −200 to −500 HU on three-dimensional micro-CT slices were shown in green. Areas of density below −500 HU on three-dimensional micro-CT slices are shown in blue. Figure reproduced from [111] with permission.
Fig. 5
Fig. 5
In vivo cancer imaging using liposomal iodinated nanoparticles. Mice are inoculated with cancer cells 3 weeks prior to imaging, allowing xenograft tumors to grow. Imaging is performed immediately after the injection of liposomal iodinated nanoparticles (early phase) and 3 to 7 days later (delayed phase). The early-phase scan is used to measure tumor fractional blood volume, while the delayed-phase scan is used to measure tumor vessel permeability via the enhanced permeability and retention effect.
Fig. 6
Fig. 6
In vivo micro-SPECT/micro-CT in a mouse model of pulmonary airway obstruction. (a) Reference micro-CT data acquired on the micro-SPECT instrument and the corresponding micro-SPECT perfusion image (b). (c) Overlaid micro-SPECT perfusion and micro-CT data. (d) 3D rendering of the micro-SPECT data. The airway obstruction due to a glass bead (yellow arrows) causes hypoventilation and a physiologic decrease in perfusion as confirmed by micro-SPECT.
Fig. 7
Fig. 7
In vivo, dual energy micro-CT vascular imaging in two primary, murine sarcoma tumors. Injection of AuNPs on day 1 and liposomal iodine on day 4 allowed simultaneous measurement of tumor fractional blood volume using the iodine map (red) and vascular permeability using the gold map (green) with a single dual energy scan on day 4. Maximum intensity projections are shown through the segmented tumor volumes. Concentrations of iodine and gold are in mg/ml.
Fig. 8
Fig. 8
In vivo, dual energy micro-CT used to assess accumulation of gold nanoparticles in the left ventricle of mice after partial heart irradiation. Iodine maps (red) were used to contour the total volume of the left ventricle, whereas gold maps (green) from the same animal were used to quantify the volume of the myocardium that had increased gold nanoparticle accumulation (white arrow). Concentrations of iodine and gold are in mg/ml. Grayscale images are scaled in Hounsfield units. The genotypic backgrounds (i.e. Tie2Cre p53FL/− and p53FL/+) are detailed in [165].
Fig. 9
Fig. 9
Coronal slices of the acquired multi-modal tomographic imaging data of the abdominal area in the mouse and histology. (A) Synchrotron: Attenuation-contrast image (left), phase-contrast image (right). (B) Tube source: Attenuation-contrast image (left), phase-contrast image (right). (C) MRI with highlighted solid tumor (a) and cystic lesion (b). (D) Stack of histology slices. All images are displayed on a linear gray scale and are windowed for best visual appearance of the solid tumor and cystic lesion. Figure reproduced from [182] with permission. All results shown in this figure were acquired ex vivo after whole-animal perfusion fixation with paraformaldehyde.

References

    1. Holdsworth DW, Thornton M. Micro-CT in small animal and specimen imaging. Trends in Biotechnology. 2002;20(8):S34–39.
    1. Feldkamp LA, Davis LC, Kress JW. Practical cone-beam algorithm. J Opt Soc Am. 1984;1(6):612–19.
    1. Johnston SM, Johnson GA, Badea CT. Geometric calibration for a dual tube/detector micro-CT system. Med Phys. 2008;35(5):1820–9. - PMC - PubMed
    1. Badea CT, Hedlund LW, Johnson GA. Micro-CT with respiratory and cardiac gating. Medical Physics. 2004;31(12):3324–3329. - PMC - PubMed
    1. Badea CT, Schreibmann E, Fox T. A registration-based approach for cardiac micro-CT using combined prospective and retrospective gating. Medical Physics. 2008;35(4):1170–1179. - PMC - PubMed

Publication types