

Four-dimensional flow assessment of pulmonary artery flow and wall shear stress in adult pulmonary arterial hypertension: results from two institutions
- PMID: 24974951
- PMCID: PMC4277737
- DOI: 10.1002/mrm.25326
Four-dimensional flow assessment of pulmonary artery flow and wall shear stress in adult pulmonary arterial hypertension: results from two institutions
Abstract
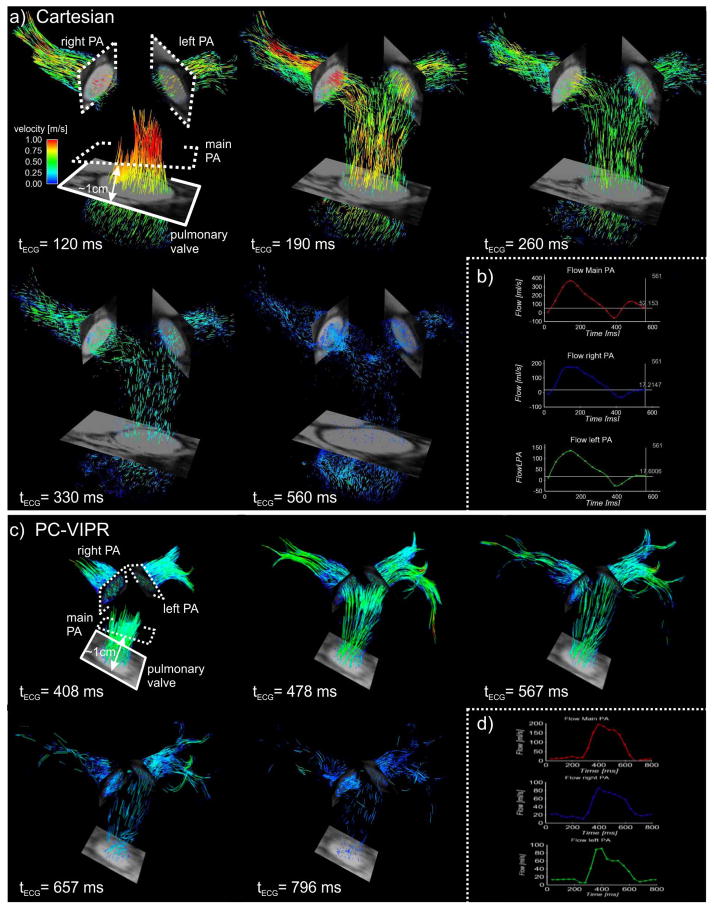
Purpose: To compare pulmonary artery flow using Cartesian and radially sampled four-dimensional flow-sensitive (4D flow) MRI at two institutions.
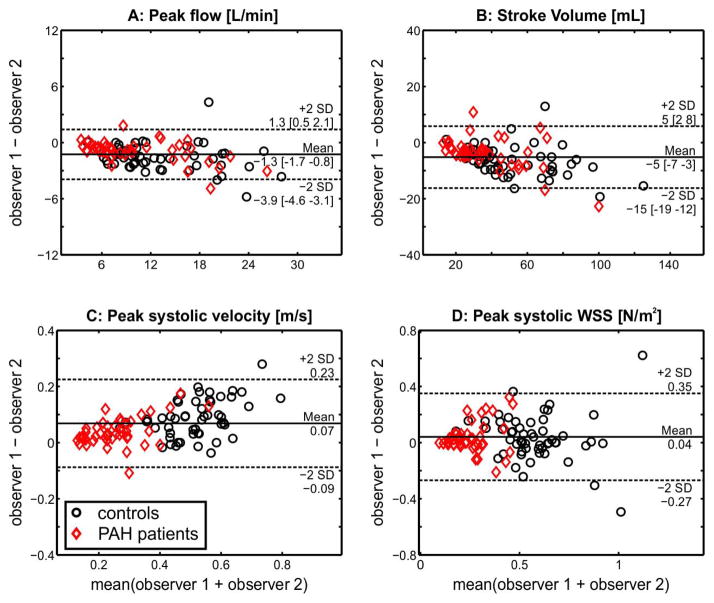
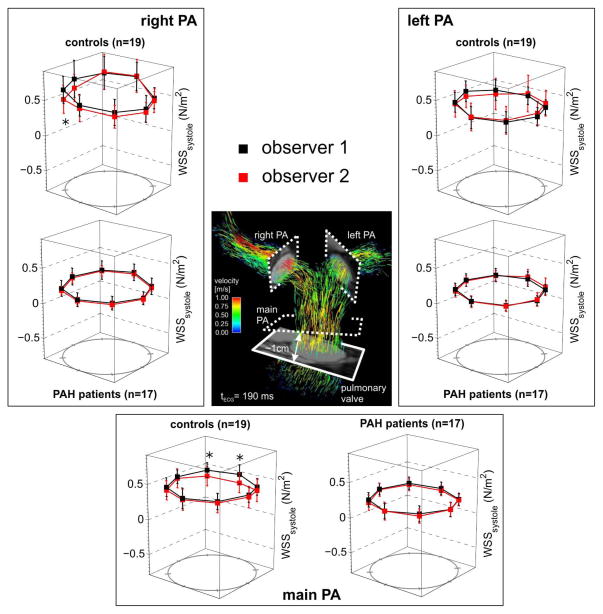
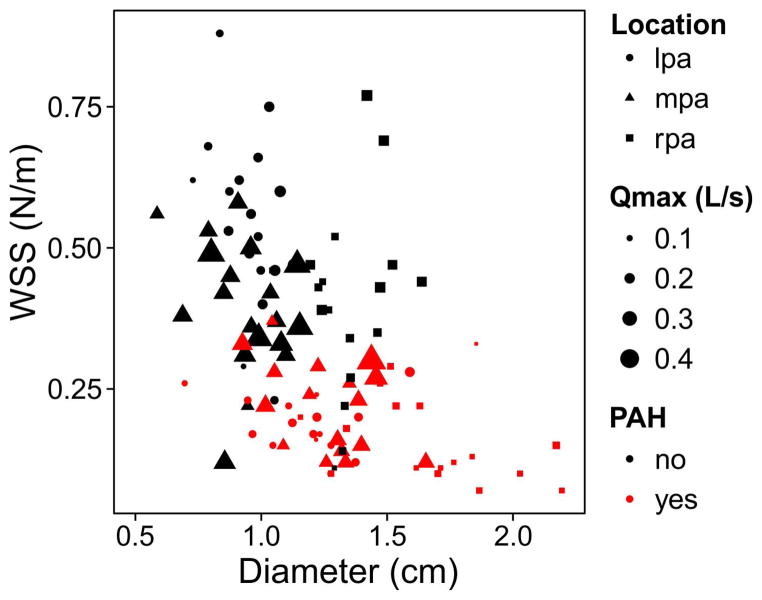
Methods: Nineteen healthy subjects and 17 pulmonary arterial hypertension (PAH) subjects underwent a Cartesian 4D flow acquisition (institution 1) or a three-dimensional radial acquisition (institution 2). The diameter, peak systolic velocity (Vmax), peak flow (Qmax), stroke volume (SV), and wall shear stress (WSS) were computed in two-dimensional analysis planes at the main, right, and left pulmonary artery. Interobserver variability, interinstitutional differences, flow continuity, and the hemodynamic measurements in healthy and PAH subjects were assessed.
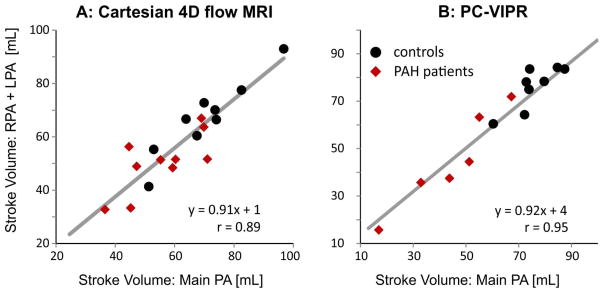
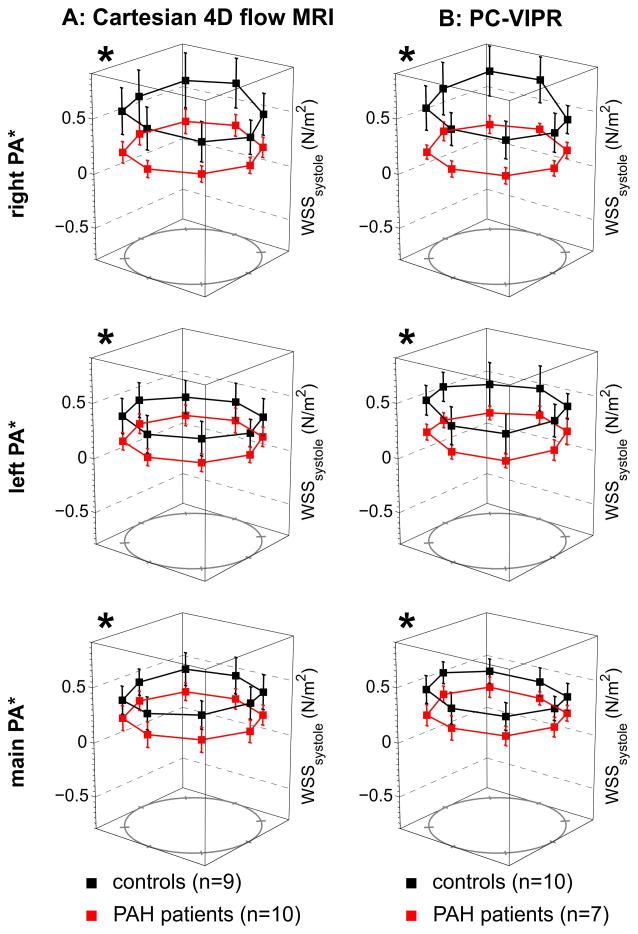
Results: Vmax, Qmax, SV, and WSS at all locations were significantly lower (P < 0.05) in PAH compared with healthy subjects. The limits of agreement were 0.16 m/s, 2.4 L/min, 10 mL, and 0.31 N/m(2) for Vmax, Qmax, SV, and WSS, respectively. Differences between Qmax and SV using Cartesian and radial sequences were not significant. Plane placement and acquisition exhibited isolated, site-based differences between Vmax and WSS.
Conclusions: 4D flow MRI was used to detect differences in pulmonary artery hemodynamics for PAH subjects. Flow and WSS in healthy and PAH subject cohorts were similar between Cartesian- and radial-based 4D flow MRI acquisitions with minimal interobserver variability.
Keywords: 4D flow MRI; pulmonary hypertension; wall shear stress.
© 2014 Wiley Periodicals, Inc.
Figures
References
-
- McLaughlin VV, Archer SL, Badesch DB, Barst RJ, Farber HW, Lindner JR, Mathier MA, McGoon MD, Park MH, Rosenson RS, Rubin LJ, Tapson VF, Varga J, Harrington RA, Anderson JL, Bates ER, Bridges CR, Eisenberg MJ, Ferrari VA, Grines CL, Hlatky MA, Jacobs AK, Kaul S, Lichtenberg RC, Moliterno DJ, Mukherjee D, Pohost GM, Schofield RS, Shubrooks SJ, Stein JH, Tracy CM, Weitz HH, Wesley DJ. ACCF/AHA 2009 expert consensus document on pulmonary hypertension: a report of the American College of Cardiology Foundation Task Force on Expert Consensus Documents and the American Heart Association: developed in collaboration with the American College of Chest Physicians, American Thoracic Society, Inc. and the Pulmonary Hypertension Association. Circulation. 2009;119:2250–2294. - PubMed
-
- Shah SJ. Pulmonary hypertension. JAMA : the journal of the American Medical Association. 2012;308:1366–1374. - PubMed
-
- Simonneau G, Gatzoulis MA, Adatia I, Celermajer D, Denton C, Ghofrani A, Gomez Sanchez MA, Krishna Kumar R, Landzberg M, Machado RF, Olschewski H, Robbins IM, Souza R. Updated clinical classification of pulmonary hypertension. J Am Coll Cardiol. 2013;62:D34–41. - PubMed
-
- Clay S, Alfakih K, Messroghli DR, Jones T, Ridgway JP, Sivananthan MU. The reproducibility of left ventricular volume and mass measurements: a comparison between dual-inversion-recovery black-blood sequence and SSFP. Eur Radiol. 2006;16:32–37. - PubMed
Publication types
MeSH terms
Grants and funding
- R01 HL072260/HL/NHLBI NIH HHS/United States
- R01 HL115828/HL/NHLBI NIH HHS/United States
- 1UL1RR025011/RR/NCRR NIH HHS/United States
- R01HL086939/HL/NHLBI NIH HHS/United States
- 9U54TR000021/TR/NCATS NIH HHS/United States
- R01HL072260/HL/NHLBI NIH HHS/United States
- R01 HL086939/HL/NHLBI NIH HHS/United States
- UL1RR025741/RR/NCRR NIH HHS/United States
- UL1 TR000427/TR/NCATS NIH HHS/United States
- R01 HL105598/HL/NHLBI NIH HHS/United States
- UL1 RR025741/RR/NCRR NIH HHS/United States
- R01HL115828/HL/NHLBI NIH HHS/United States
- R01HL105598/HL/NHLBI NIH HHS/United States
- UL1 RR025011/RR/NCRR NIH HHS/United States
LinkOut - more resources
Full Text Sources
Other Literature Sources
Medical
Research Materials
