

Impact of broader sharing on the transport time for deceased donor livers
- PMID: 24975028
- PMCID: PMC4177362
- DOI: 10.1002/lt.23942
Impact of broader sharing on the transport time for deceased donor livers
Abstract
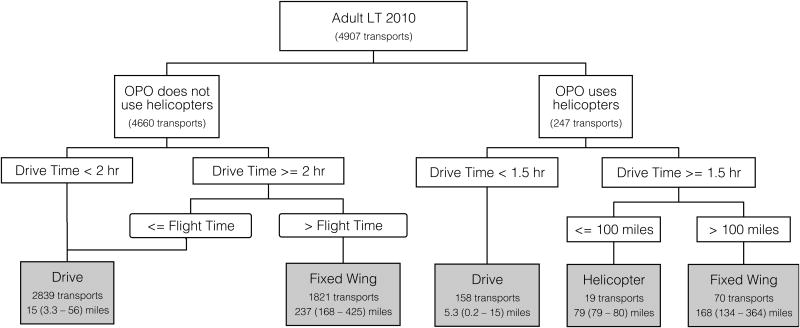
Recent allocation policy changes have increased the sharing of deceased donor livers across local boundaries, and sharing even broader than this has been proposed as a remedy for persistent geographic disparities in liver transplantation. It is possible that broader sharing may increase cold ischemia times (CITs) and thus harm recipients. We constructed a detailed model of transport modes (car, helicopter, and fixed-wing aircraft) and transport times between all hospitals, and we investigated the relationship between the transport time and the CIT for deceased donor liver transplants. The median estimated transport time was 2.0 hours for regionally shared livers and 1.0 hour for locally allocated livers. The model-predicted transport mode was flying for 90% of regionally shared livers but for only 22% of locally allocated livers. The median CIT was 7.0 hours for regionally shared livers and 6.0 hours for locally allocated livers. Variation in the transport time accounted for only 14.7% of the variation in the CIT, and the transport time on average composed only 21% of the CIT. In conclusion, nontransport factors play a substantially larger role in the CIT than the transport time. Broader sharing will have only a marginal impact on the CIT but will significantly increase the fraction of transplants that are transported by flying rather than driving.
© 2014 American Association for the Study of Liver Diseases.
Figures


Comment in
-
Broader liver sharing: the time has come.Liver Transpl. 2014 Oct;20(10):1155-6. doi: 10.1002/lt.23961. Liver Transpl. 2014. PMID: 25045898 No abstract available.
References
-
- Washburn K, Harper A, Klintmalm G, Goss J, Halff G. Regional sharing for adult status 1 candidates: reduction in waitlist mortality. Liver Transpl. 2006;12(3):470–474. - PubMed
-
- OPTN. Policy 9: Allocation of Livers and Liver-Intestines In. 2014:121–132.
-
- Washburn K, Pomfret E, Roberts J. Liver allocation and distribution: possible next steps. Liver Transpl. 2011;17(9):1005–1012. - PubMed
-
- Roberts JP, Dykstra DM, Goodrich NP, Rush SH, Merion RM, Port FK. Geographic differences in event rates by model for end-stage liver disease score. Am J Transplant. 2006;6(10):2470–2475. - PubMed
Publication types
MeSH terms
Grants and funding
LinkOut - more resources
Full Text Sources
Other Literature Sources
Medical