. 2014 Sep;44(9):2785-801.
doi: 10.1002/eji.201344322.

Insertional hypermutation in mineral oil-induced plasmacytomas

Affiliations

Insertional hypermutation in mineral oil-induced plasmacytomas

Gero Knittel et al. Eur J Immunol. 2014 Sep.

Abstract

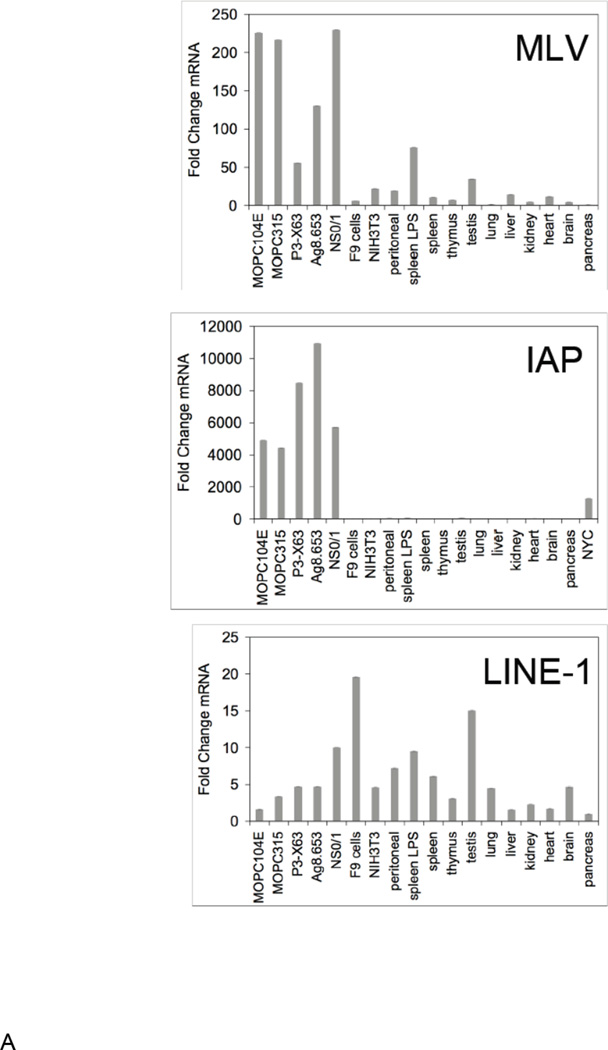
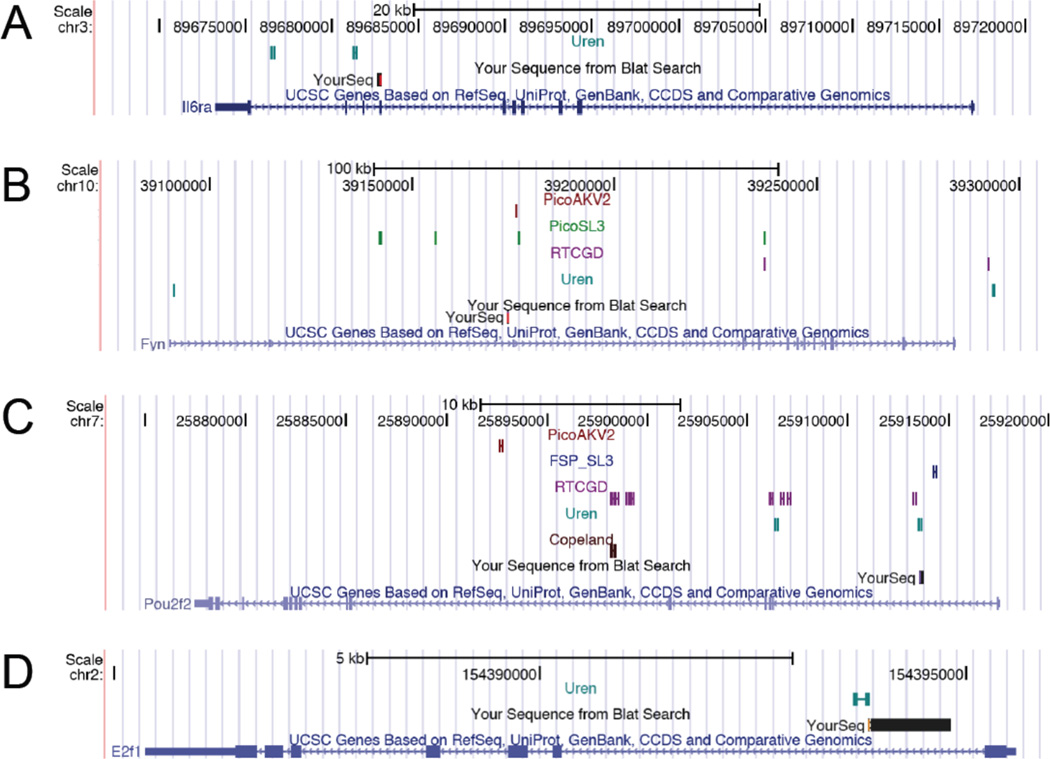
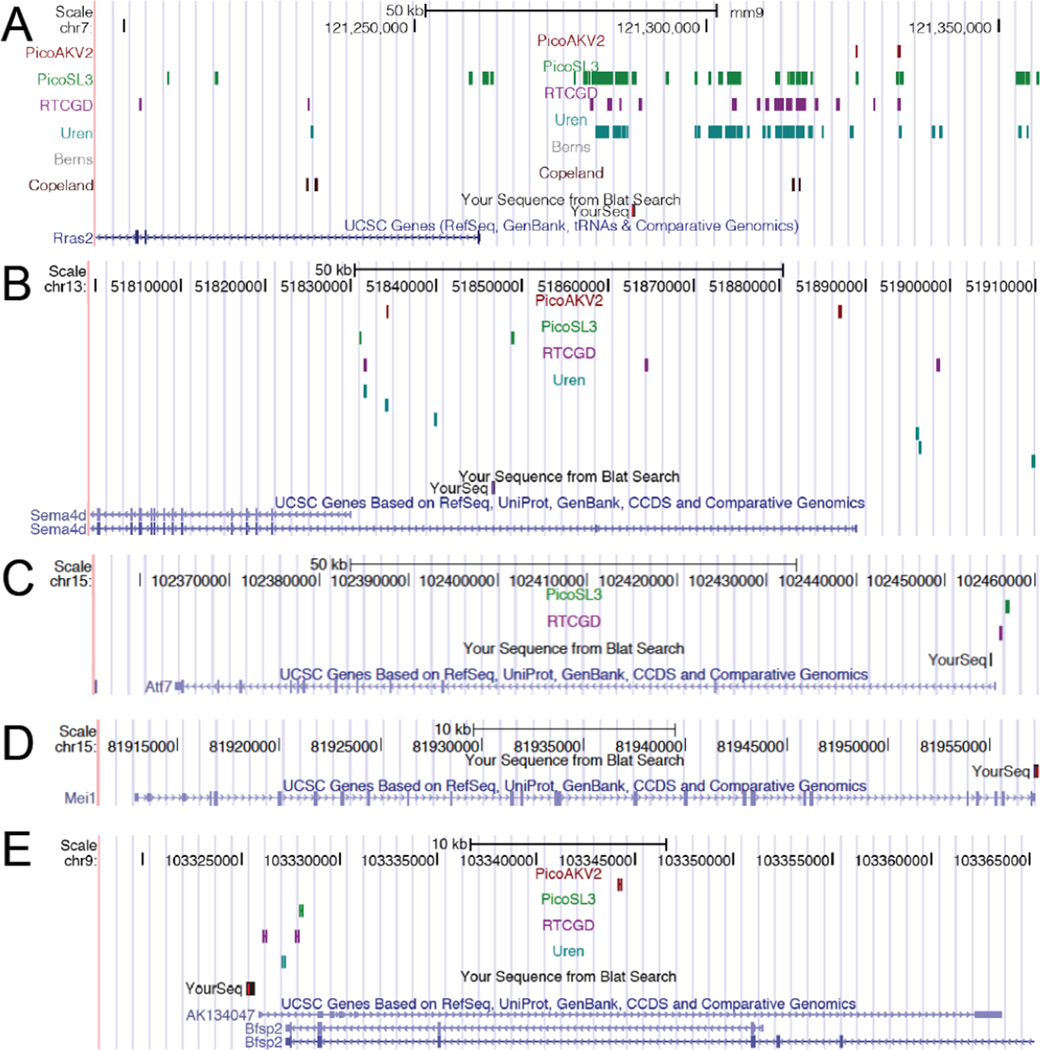
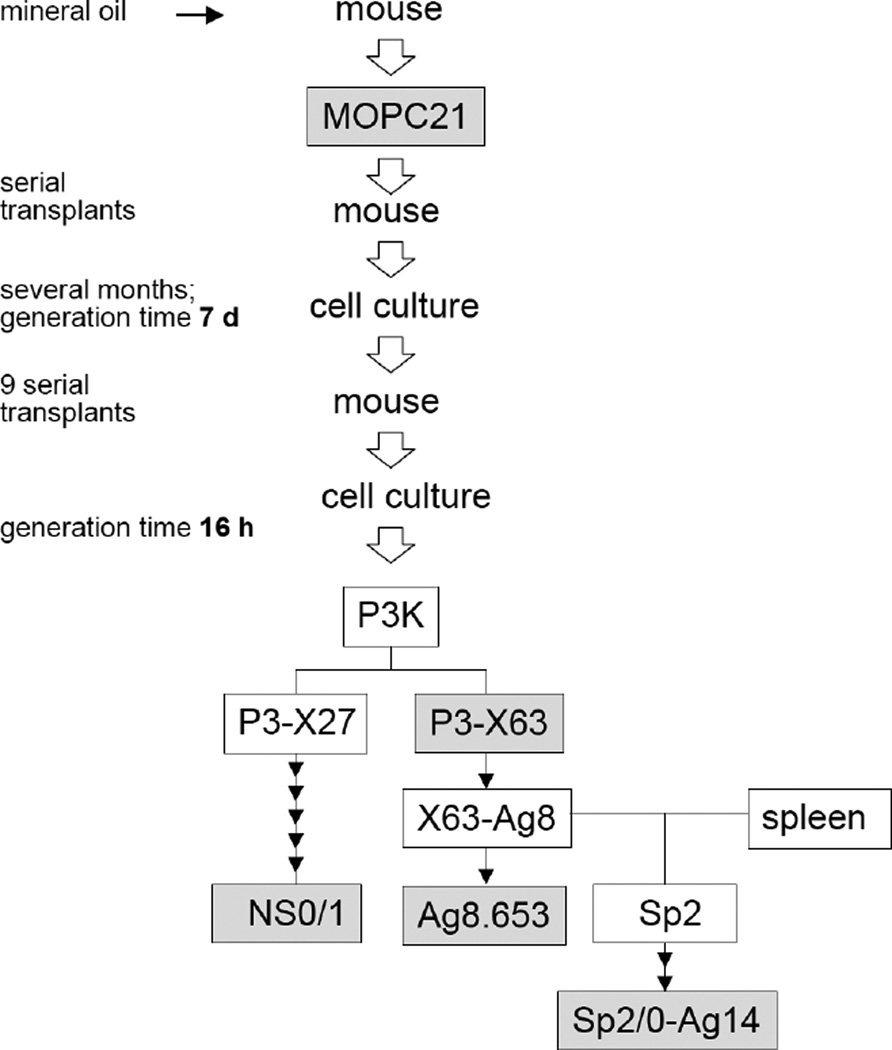
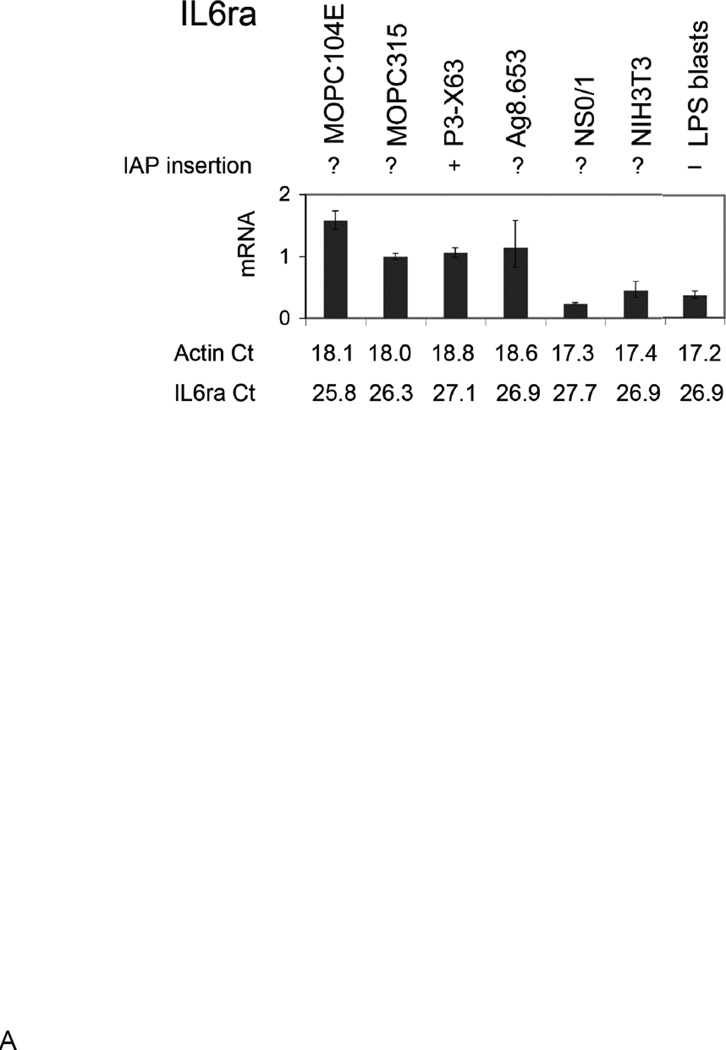
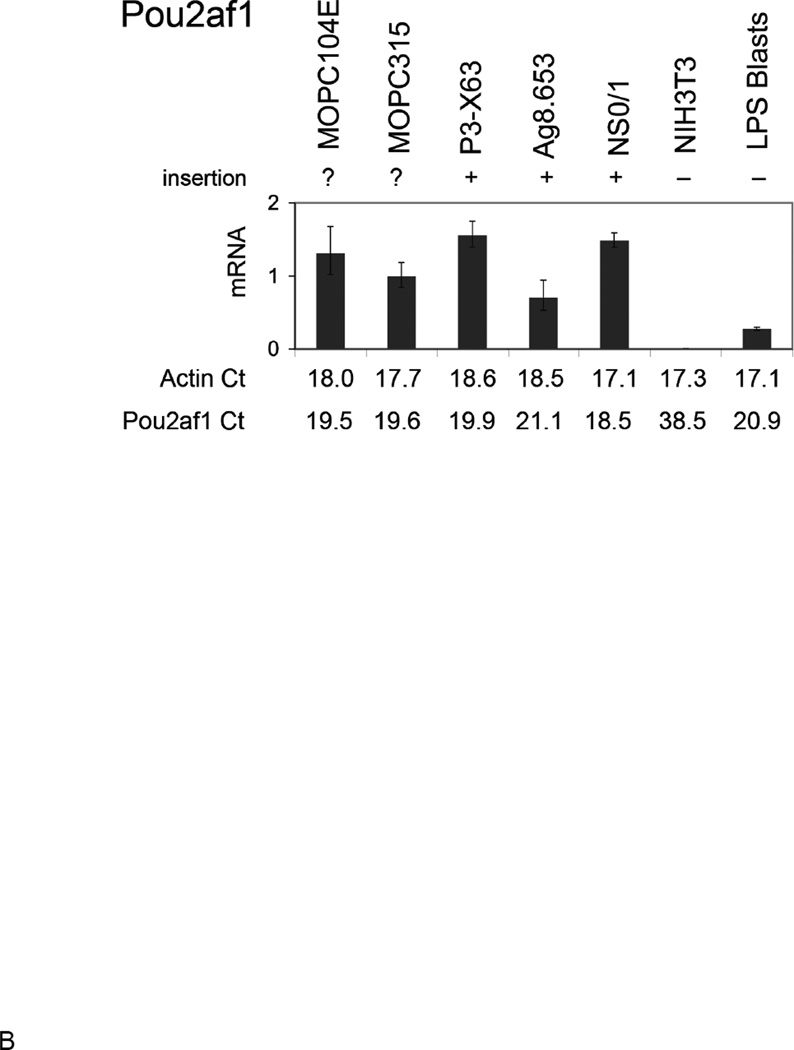
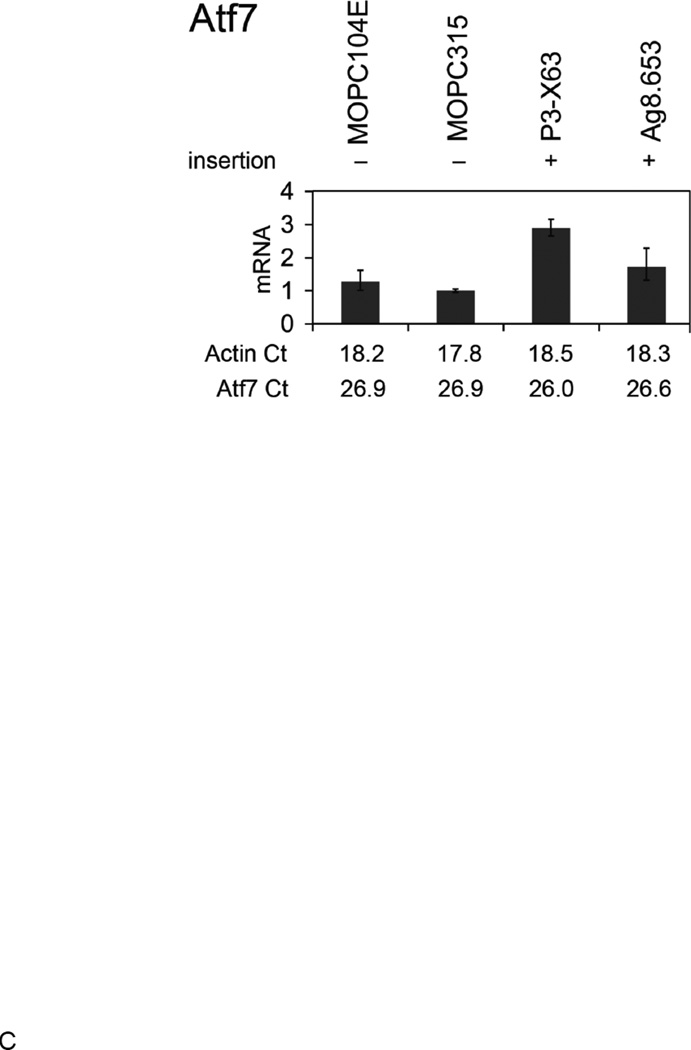
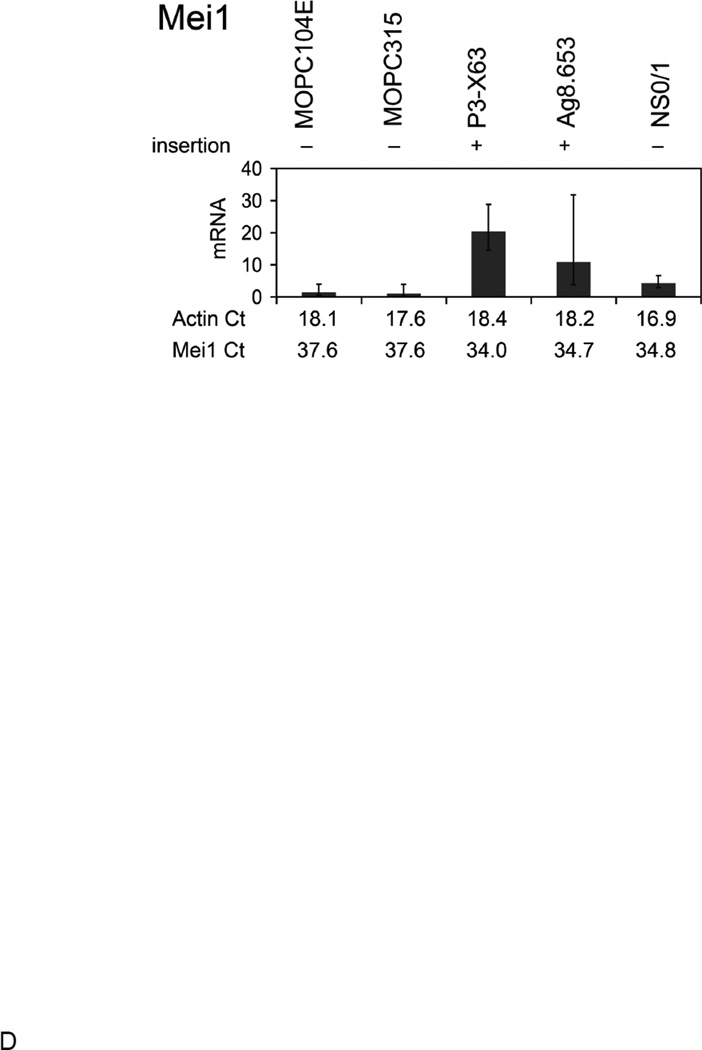
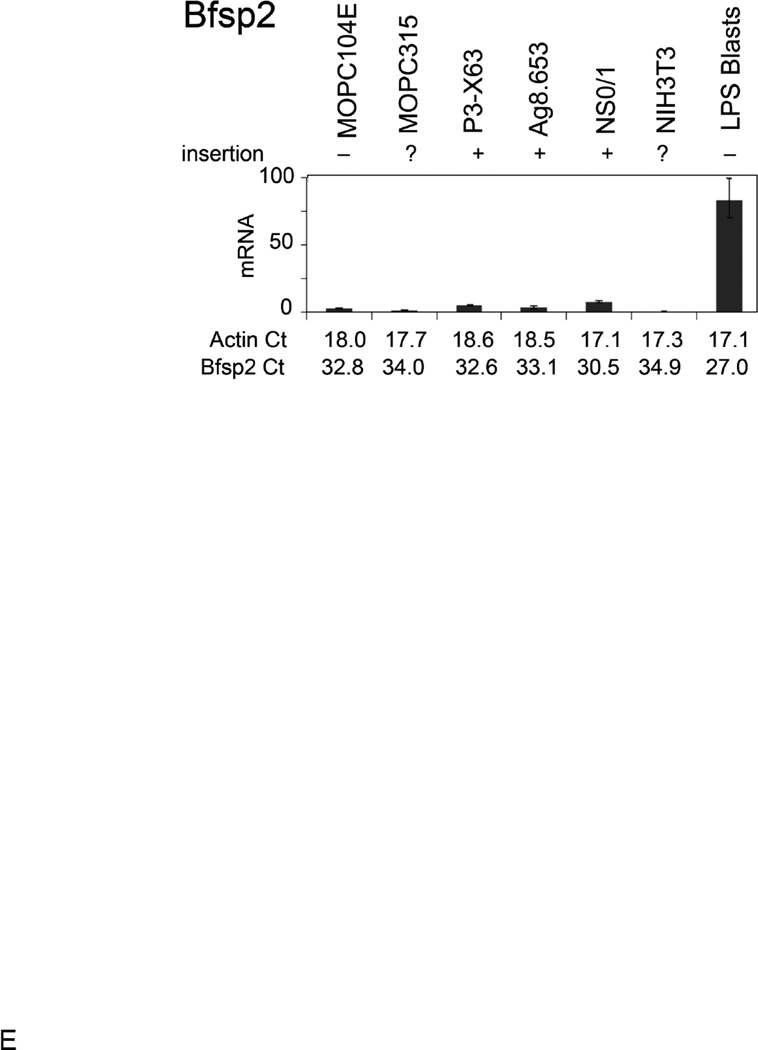
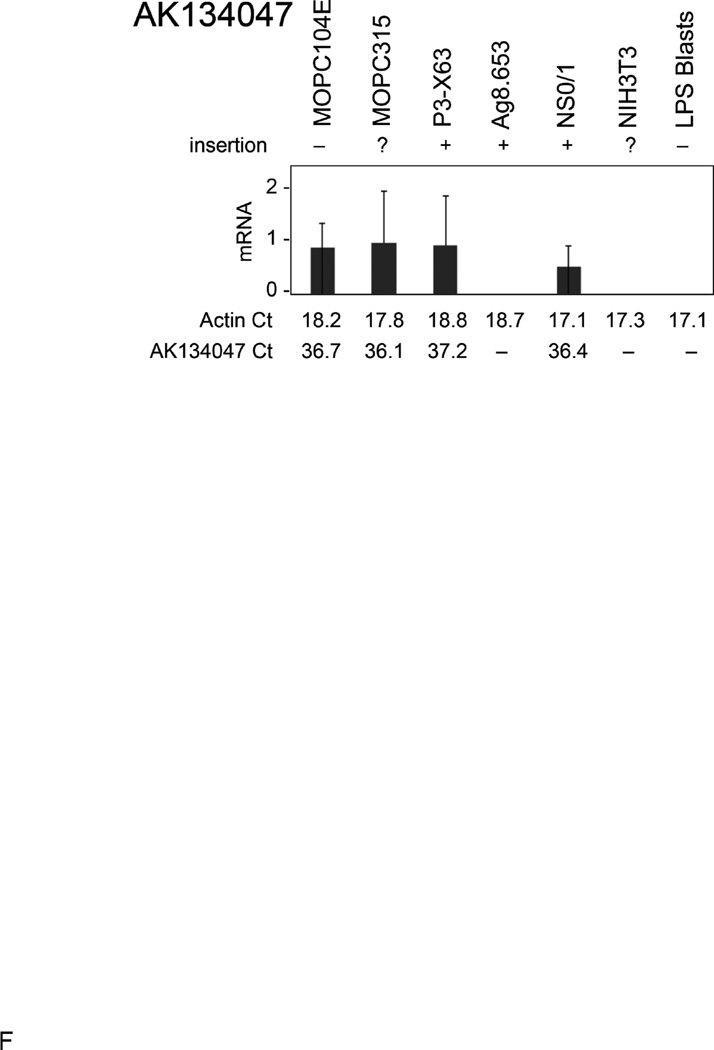
Unless stimulated by a chronic inflammatory agent, such as mineral oil, plasma cell tumors are rare in young BALB/c mice. This raises the questions: What do inflammatory tissues provide to promote mutagenesis? And what is the nature of mutagenesis? We determined that mineral oil-induced plasmacytomas produce large amounts of endogenous retroelements--ecotropic and polytropic murine leukemia virus and intracisternal A particles. Therefore, plasmacytoma formation might occur, in part, by de novo insertion of these retroelements, induced or helped by the inflammation. We recovered up to ten de novo insertions in a single plasmacytoma, mostly in genes with common retroviral integration sites. Additional integrations accompany tumor evolution from a solid tumor through several generations in cell culture. The high frequency of de novo integrations into cancer genes suggests that endogenous retroelements are coresponsible for plasmacytoma formation and progression in BALB/c mice.

Keywords: Endogenous retroelements; Inflammation; Mutagenesis; Plasmacytomas; Tumor evolution.


Figures

Figure 1
Figure 1
Expression of retroelements in MOPC and normal BALB/c cells. (A) qPCR measurements of retroelement mRNA (MLV, IAP, LINE-1). The amount of target mRNA was normalized to the endogenous control 18S ribosomal RNA. Values represent mean ± SD (of quadruplicate measurements); y-axis, fold change in mRNA expression, as compared with pancreatic cells. P3-X63, Ag8.653 and NS0/1 are MOPC21-derived lines; Spleen LPS, LPS- and IL4-stimulated spleen cells; F9, mouse embryonal carcinoma cell line expressing high levels of L1 mRNA; NYC, lymphoma of the B/W mouse. (B) Sequences of the proline-rich region (PRR) of virus secreted by NS0/1, P3-X63 and SP2/0 cells. X63-A and B, two sequences found in viruses from P3-X63. M. dunni cells were infected with supernatants from cell cultures, and the proviral PRRs were PCR amplified. AKV, sequence of prototype AKV; PMLV, sequence of prototype polytropic MLV. Dashes denote sequence identity.
Figure 1
Figure 1
Expression of retroelements in MOPC and normal BALB/c cells. (A) qPCR measurements of retroelement mRNA (MLV, IAP, LINE-1). The amount of target mRNA was normalized to the endogenous control 18S ribosomal RNA. Values represent mean ± SD (of quadruplicate measurements); y-axis, fold change in mRNA expression, as compared with pancreatic cells. P3-X63, Ag8.653 and NS0/1 are MOPC21-derived lines; Spleen LPS, LPS- and IL4-stimulated spleen cells; F9, mouse embryonal carcinoma cell line expressing high levels of L1 mRNA; NYC, lymphoma of the B/W mouse. (B) Sequences of the proline-rich region (PRR) of virus secreted by NS0/1, P3-X63 and SP2/0 cells. X63-A and B, two sequences found in viruses from P3-X63. M. dunni cells were infected with supernatants from cell cultures, and the proviral PRRs were PCR amplified. AKV, sequence of prototype AKV; PMLV, sequence of prototype polytropic MLV. Dashes denote sequence identity.
Figure 2
Figure 2
Recovery of de novo MLV and IAP insertion sites and mapping to the BALB/c mouse genome. (A) Schematic of identification of de novo retroelement integration sites. Cellular DNA is restriction digested and ligated to a double-stranded DNA oligonucleotide with a stable hairpin (splinkerette). The hairpin prevents primer Ps from hybridizing. Therefore, Ps helps to amplify only fragments originating from first-strand DNA synthesis initiated by the retroelement primer 1 (P1). P2 and P3 are nested primers covering 5’ sequences of the most active retroelements. The amplicon containing primers Ps and P3 is sequenced; it ought to be a chimeric sequence containing part of the retroelement LTR (red rectangle) and genomic sequences upstream of the integration site (black line). Further validation of the de novo integration site includes amplification of a chimeric fragment with a genomic 5’ primer (Pg) and the 3’ LTR primer P3. Finally, DNA fragments of the BALB/c mouse genome spanning the retroelement insertion site are amplified with primers 5’ Pg and 3’ Pg. This distinguishes between de novo insertions and putative germ line retroelements in BALB/c. (B) Agarose gel with amplicons generated by primers Ps and P3, from six mineral oil-induced plasmacytomas (MOPC) and genomic DNA of BALB/c. (C) Agarose gel with amplicons generated by primers Pg and P3 (“insert”), and by primers 5’ Pg and 3’ Pg (“genomic”) from plasmacytomas and genomic DNA of BALB/c, respectively. Left, de novo MLV insert; right, de novo IAP insert.
Figure 3
Figure 3
Retroelement insertions in plasmacytoma MOPC173. Screen prints of a customized version of the UCSC Genome Browser (mouse genome assembly July 2007 [mm9]). “YourSeq,” genomic sequence tag recovered in a chimeric sequence containing retroelement LTR. Numbers at the top, nucleotide position at the particular chromosome. Bright green (PicoSL3) and red (PicoAKV2) bars indicate insertion sites from our large lymphoma screen; magenta, dark green and brown bars indicate those published by the RTCGD [28] and Uren et al. [29], respectively. Exons are represented by bars, introns by horizontal lines; and the arrows denote the direction of transcription. (A) Il6ra locus; (B) Fyn; (C) Pou2f2; (D) E2f.
Figure 4
Figure 4
Retroelement insertions in MOPC21. Screen prints are as in Fig. 3. (A) Rras2 locus; (B) Sema4d; (C) Atf7; (D) Mei1; (E) Bfsp2.
Figure 5
Figure 5
Genealogy of MOPC21 and its culture-adapted subclones.
Figure 6
Figure 6
Expression levels of targeted genes. (A) Il6ra; (B) Pou2af1; (C) Atf7; (D) Mei1; (E) Bfsp2; (F) AK134047; (G) Ptpmt1. The amount of target mRNA was normalized to the values of actin mRNA. Below the panels, Ct values show that an apparent difference in expression is not due to a large variation in the actin mRNA. Values represent mean ± SD (of quadruplicate measurements); y-axis, mRNA expression, arbitrary units.
Figure 6
Figure 6
Expression levels of targeted genes. (A) Il6ra; (B) Pou2af1; (C) Atf7; (D) Mei1; (E) Bfsp2; (F) AK134047; (G) Ptpmt1. The amount of target mRNA was normalized to the values of actin mRNA. Below the panels, Ct values show that an apparent difference in expression is not due to a large variation in the actin mRNA. Values represent mean ± SD (of quadruplicate measurements); y-axis, mRNA expression, arbitrary units.

Similar articles

Cited by

References

    1. Potter M, Wiener F. Plasmacytomagenesis in mice: model of neoplastic development dependent upon chromosomal translocations. Carcinogenesis. 1992;13:1681–1697. - PubMed
    1. Satoh M, Kumar A, Kanwar YS, Reeves WH. Anti-nuclear antibody production and immune-complex glomerulonephritis in BALB/c mice treated with pristane. Proc Natl Acad Sci U S A. 1995;92:10934–10938. - PMC - PubMed
    1. Potter M. The early history of plasma cell tumors in mice, 1954–1976. Adv Cancer Res. 2007;98:17–51. - PubMed
    1. Potter M, Maccardle RC. Histology of Developing Plasma Cell Neoplasia Induced by Mineral Oil in Balb/C Mice. J Natl Cancer Inst. 1964;33:497–515. - PubMed
    1. Cancro M, Potter M. The requirement of an adherent cell substratum for the growth of developing plasmacytoma cells in vivo. J Exp Med. 1976;144:1554–1567. - PMC - PubMed

Publication types

MeSH terms

LinkOut - more resources