

Effects of long-term averaging of quantitative blood pressure traits on the detection of genetic associations
- PMID: 24975945
- PMCID: PMC4085637
- DOI: 10.1016/j.ajhg.2014.06.002
Effects of long-term averaging of quantitative blood pressure traits on the detection of genetic associations
Abstract
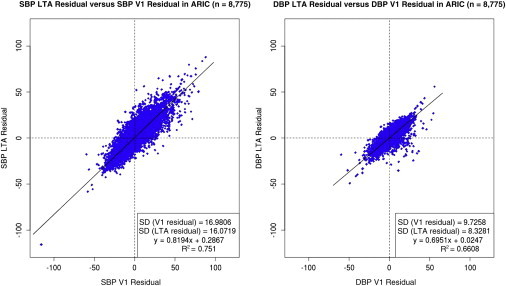
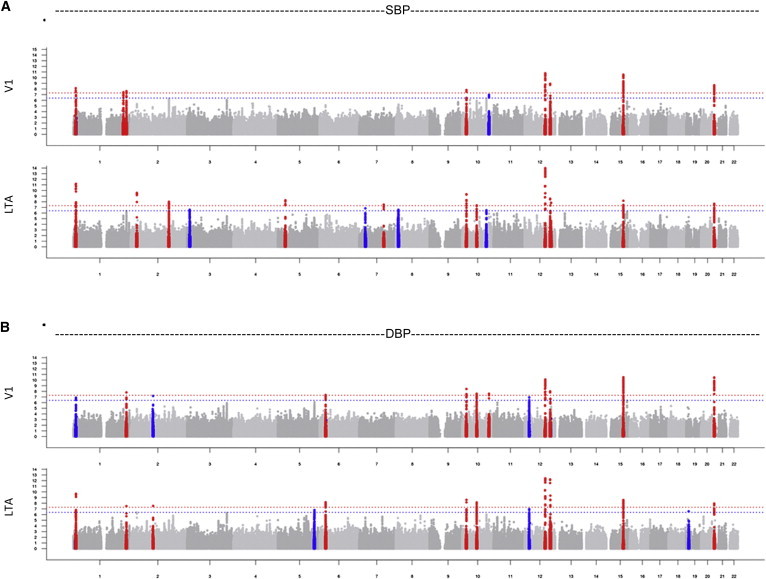
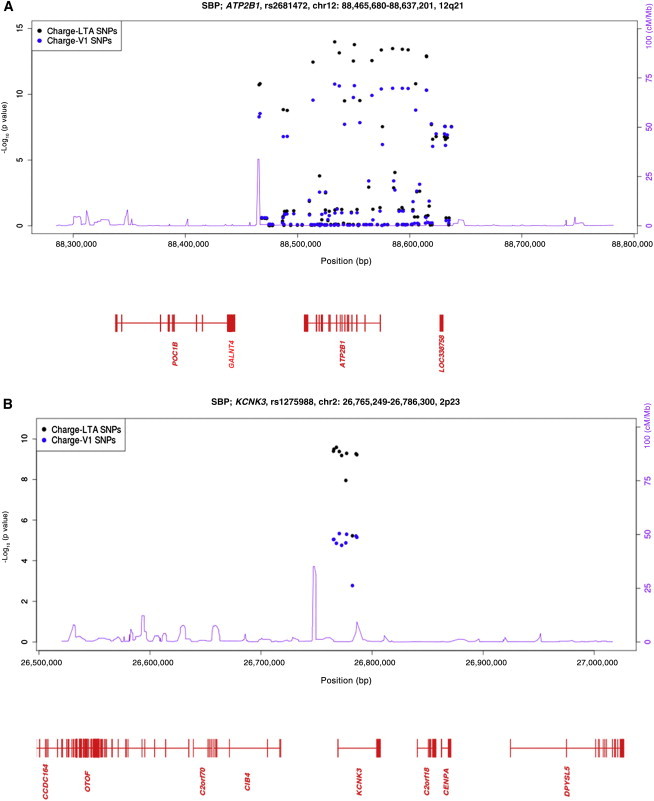
Blood pressure (BP) is a heritable, quantitative trait with intraindividual variability and susceptibility to measurement error. Genetic studies of BP generally use single-visit measurements and thus cannot remove variability occurring over months or years. We leveraged the idea that averaging BP measured across time would improve phenotypic accuracy and thereby increase statistical power to detect genetic associations. We studied systolic BP (SBP), diastolic BP (DBP), mean arterial pressure (MAP), and pulse pressure (PP) averaged over multiple years in 46,629 individuals of European ancestry. We identified 39 trait-variant associations across 19 independent loci (p < 5 × 10(-8)); five associations (in four loci) uniquely identified by our LTA analyses included those of SBP and MAP at 2p23 (rs1275988, near KCNK3), DBP at 2q11.2 (rs7599598, in FER1L5), and PP at 6p21 (rs10948071, near CRIP3) and 7p13 (rs2949837, near IGFBP3). Replication analyses conducted in cohorts with single-visit BP data showed positive replication of associations and a nominal association (p < 0.05). We estimated a 20% gain in statistical power with long-term average (LTA) as compared to single-visit BP association studies. Using LTA analysis, we identified genetic loci influencing BP. LTA might be one way of increasing the power of genetic associations for continuous traits in extant samples for other phenotypes that are measured serially over time.
Copyright © 2014 The American Society of Human Genetics. Published by Elsevier Inc. All rights reserved.
Figures
References
-
- Lewington S., Clarke R., Qizilbash N., Peto R., Collins R., Prospective Studies Collaboration Age-specific relevance of usual blood pressure to vascular mortality: a meta-analysis of individual data for one million adults in 61 prospective studies. Lancet. 2002;360:1903–1913. - PubMed
-
- Ehret G.B., Munroe P.B., Rice K.M., Bochud M., Johnson A.D., Chasman D.I., Smith A.V., Tobin M.D., Verwoert G.C., Hwang S.J., International Consortium for Blood Pressure Genome-Wide Association Studies. CARDIoGRAM consortium. CKDGen Consortium. KidneyGen Consortium. EchoGen consortium. CHARGE-HF consortium Genetic variants in novel pathways influence blood pressure and cardiovascular disease risk. Nature. 2011;478:103–109. - PMC - PubMed
-
- Ganesh S.K., Tragante V., Guo W., Guo Y., Lanktree M.B., Smith E.N., Johnson T., Castillo B.A., Barnard J., Baumert J., CARDIOGRAM, METASTROKE. LifeLines Cohort Study Loci influencing blood pressure identified using a cardiovascular gene-centric array. Hum. Mol. Genet. 2013;22:1663–1678. - PMC - PubMed
MeSH terms
Grants and funding
LinkOut - more resources
Full Text Sources
Other Literature Sources
Miscellaneous
