. 2014 Oct;94(1):56-69.
doi: 10.1111/mmi.12688. Epub 2014 Jul 13.

Slow growth of Mycobacterium tuberculosis at acidic pH is regulated by phoPR and host-associated carbon sources

Affiliations

Slow growth of Mycobacterium tuberculosis at acidic pH is regulated by phoPR and host-associated carbon sources

Jacob J Baker et al. Mol Microbiol. 2014 Oct.

Abstract

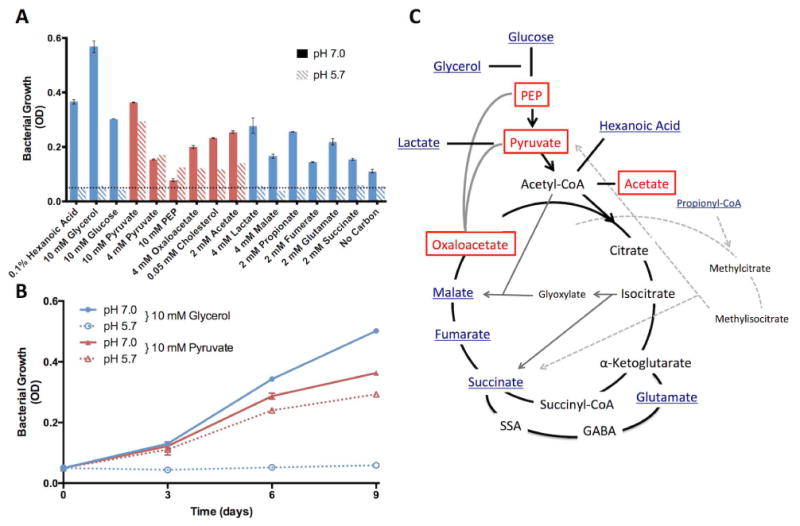
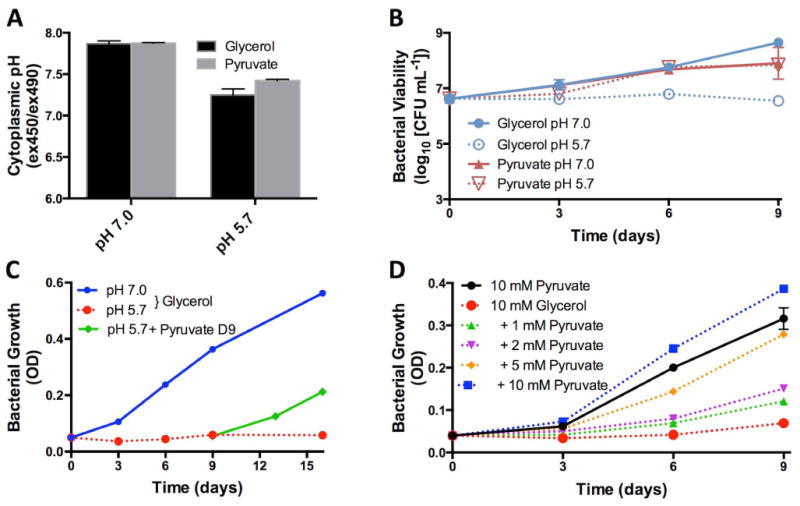
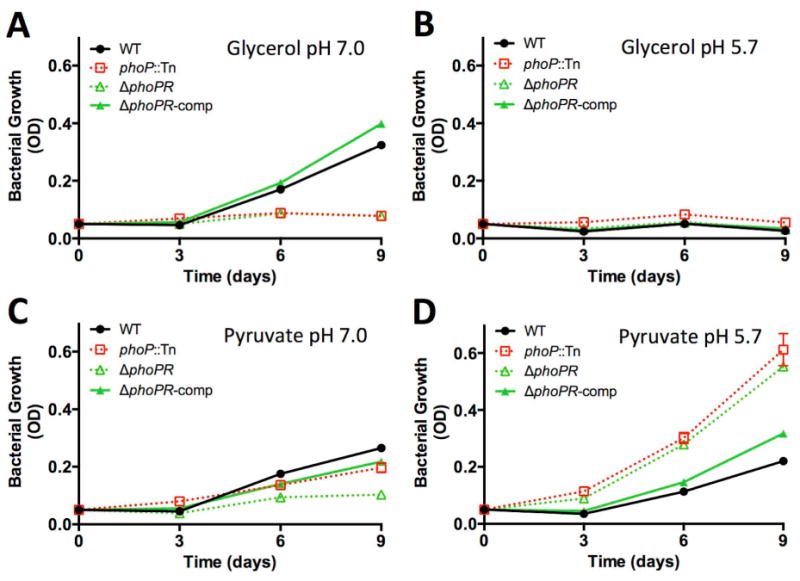
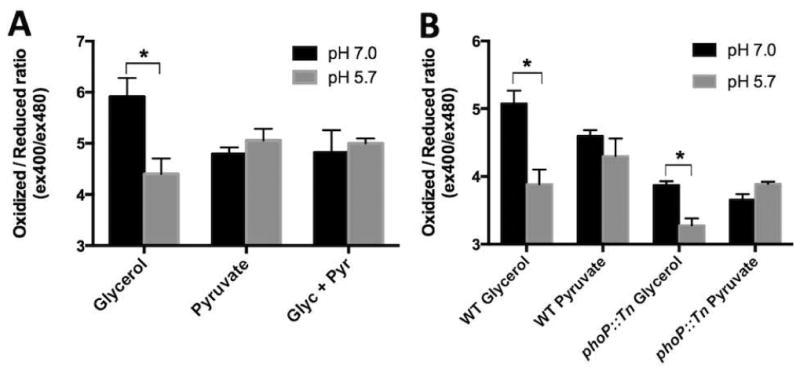
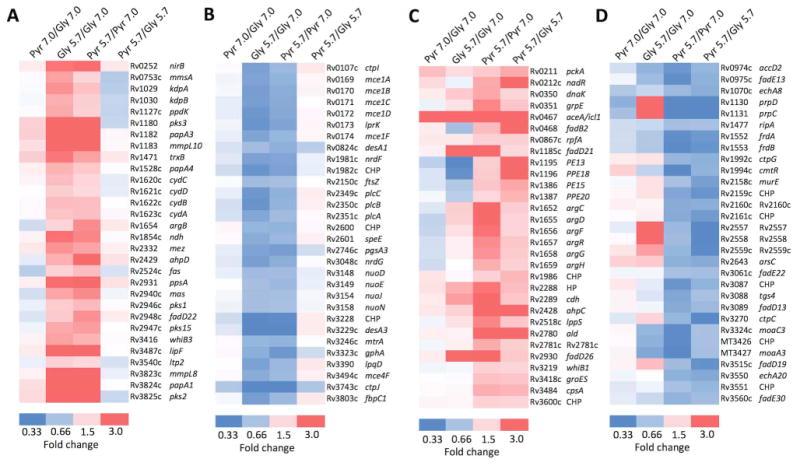
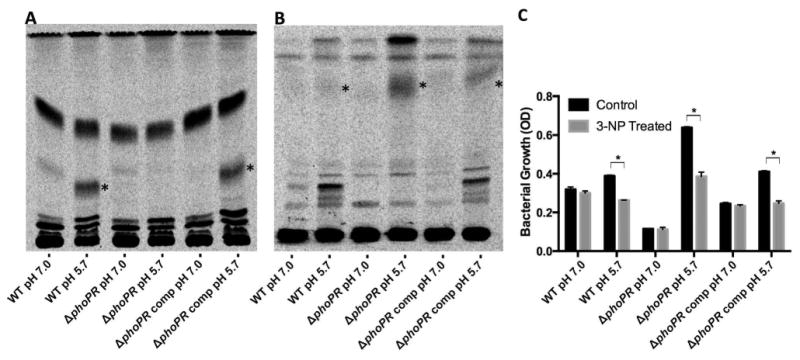
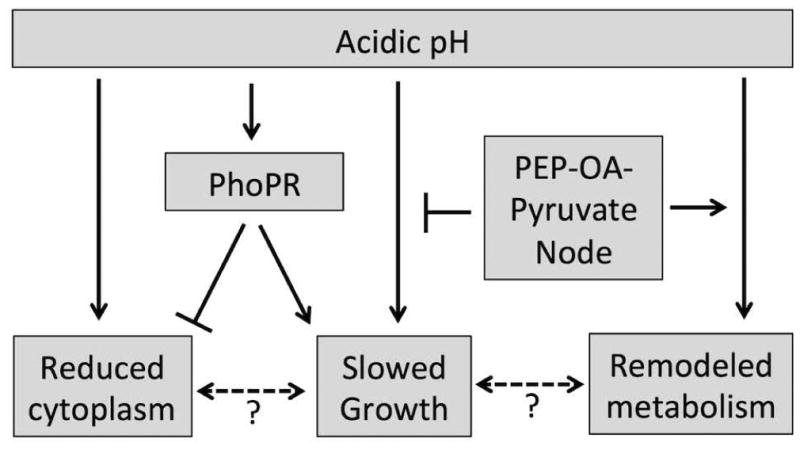
During pathogenesis, Mycobacterium tuberculosis (Mtb) colonizes environments, such as the macrophage or necrotic granuloma, that are acidic and rich in cholesterol and fatty acids. The goal of this study was to examine how acidic pH and available carbon sources interact to regulate Mtb physiology. Here we report that Mtb growth at acidic pH requires host-associated carbon sources that function at the intersection of glycolysis and the TCA cycle, such as pyruvate, acetate, oxaloacetate and cholesterol. In contrast, in other tested carbon sources, Mtb fully arrests its growth at acidic pH and establishes a state of non-replicating persistence. Growth-arrested Mtb is resuscitated by the addition of pyruvate suggesting that growth arrest is due to a pH-dependent checkpoint on metabolism. Additionally, we demonstrate that the phoPR two-component regulatory system is required to slow Mtb growth at acidic pH and functions to maintain redox homeostasis. Transcriptional profiling and functional metabolic studies demonstrate that signals from acidic pH and carbon source are integrated to remodel pathways associated with anaplerotic central metabolism, lipid anabolism and the regeneration of oxidized cofactors. Because phoPR is required for Mtb virulence in animals, we suggest that pH-driven adaptation may be critical to Mtb pathogenesis.


Figures

Figure 1
Figure 1. Mtb exhibits carbon source specific growth arrest at acidic pH
A. Mtb growth on various carbon sources at both neutral and acidic pH. Cultures were seeded at a starting density of 0.05 OD600 (horizontal dotted line) and growth was measured every three days for 9 days. The growth curves are presented in Fig. S2 and the day 9 endpoint data are summarized in this panel. Carbon sources are designated as either permissive (red bars) or restrictive (blue bars) for growth at acidic pH, as compared to the growth baseline in the “No Carbon” control. Only PEP, pyruvate, oxaloacetate, acetate and cholesterol promoted growth at acidic pH. B. Growth curves showing glycerol arrests growth and pyruvate promotes growth of Mtb at acidic pH. C. Model showing the position within central carbon metabolism of carbon sources permissive (boxed) and restricted (underlined) for growth at acidic pH. The panel is modified from Tian et al. (Tian et al., 2005). Error bars represent the standard deviation and the data are representative of two independent experiments.
Figure 2
Figure 2. Growth-arrested Mtb is resuscitated with pyruvate
A. Mtb can maintain its cytoplasmic pH homeostasis in response to both glycerol and pyruvate at pH 7.0 and pH 5.7. B. Mtb remains viable during acidic pH growth arrest as measured by colony forming units (CFU). This finding suggests that Mtb enters a state of non-replicating persistence driven by acidic pH and carbon source. C. Following 9 days of growth arrest in minimal medium with 10 mM glycerol at pH 5.7, addition of 10 mM pyruvate resuscitates Mtb growth (green line). Therefore, Mtb growth arrest at acidic pH is reversible and non-lethal. D. Pyruvate promotes Mtb growth in 10 mM glycerol in a concentration dependent manner. Error bars represent the standard deviation and the data are representative of three individual experiments.
Figure 3
Figure 3. phoPR is required to slow Mtb growth at acidic pH
Growth of WT, phoP::Tn mutant, ΔphoPR mutant, and ΔphoPR complemented strains in minimal medium containing 10 mM glycerol at pH 7.0 (A), 10 mM glycerol at pH 5.7 (B), 10 mM pyruvate at pH 7.0 (C), and 10 mM pyruvate at pH 5.7 (D) as a single carbon source. Note that at neutral pH the strains lacking phoP have reduced growth on pyruvate and glycerol as compared to the WT or complemented strains. At pH 5.7, strains lacking phoP have enhanced growth on pyruvate, as compared to the WT and complemented strains. Error bars represent the standard deviation and the data are representative of three biological replicates.
Figure 4
Figure 4. Acidic pH, carbon source and phoP modulate redox homeostasis
Intracellular redox state was measured using a redox sensitive disulfide bond-containing GFP (roGFP) by calculating the ratio of fluorescence emission from 400nm and 480nm excitation. A lower ratio indicates a more reduced roGFP while a higher ratio indicates a more oxidized roGFP. A. WT Mtb growing on glycerol exhibits a more reduced cytoplasm at acidic pH. However, when pyruvate is present, Mtb does not exhibit a shift in cytoplasmic redox potential. B. The phoP::Tn mutant exhibits a more reduced cytoplasm, as compared to the wild type, at pH 7.0 when grown on both glycerol and pyruvate. At pH 5.7, the phoP mutant exhibits an even more reduced cytoplasm in glycerol, while maintaining it redox potential in pyruvate. Error bars indicate the standard deviation of three biological replicates each calculated from the average of three technical replicates. The data are representative of two individual experiments. *p<0.05 using a student's t-test.
Figure 5
Figure 5. Genes that are induced or repressed by acidic pH in a carbon source independent and dependent manner
A. Selection of 30 genes (out of 185 total) that are induced by acidic pH in both glycerol and pyruvate without a significant difference in the induction (Table S5A). B. Selection of 30 genes (out of 134 total) that are repressed by acidic pH in both glycerol and pyruvate without difference in the induction (Table S5C). C. Selection of 30 genes (out of 60 total) that are induced at pH 5.7 in pyruvate and the induction is significantly greater in pyruvate as compared to glycerol (Table S5B). D. Selection of 30 genes (out of 75 total) that are repressed at pH 5.7 in pyruvate and the repression is significantly greater in pyruvate as compared to glycerol (Table S5D). CHP, conserved hypothetical protein; HP hypothetical protein.
Figure 6
Figure 6. Acidic pH modulates accumulation of mycobacterial lipids and sensitivity to 3NP
A. Accumulation of sulfolipid at acidic pH. For each strain, 20000 CPM of 14C labeled lipids was spotted at the origin and the TLC was developed three times in chloroform:methanol:water (90:10:1 v/v/v). Sulfolipid is highlighted with the asterisk and accumulates in a pH- and phoPR-dependent manner. B. Accumulation of TAG in the phoPR mutant at acidic pH. For each strain, 20000 CPM of 14C labeled lipids was spotted at the origin and the TLC was developed in hexane:diethyl ether:acetic acid (80:20:1 v/v/v). TAG is highlighted with the asterisk and accumulates in a pH- and phoPR-dependent manner. The data are representative of two independent biological replicates. C. 3-NP inhibits Mtb growth at acidic pH. The data presented are the end-point of culture growth following 9 days of incubation at acidic or neutral pH in the presence or absence of 0.1 mM 3-NP. Data showing the entire time-course are presented in Figure S10. Error bars represent the standard deviation and the data are representative of two biological replicates. *p<0.005 using a student's t-test.
Figure 7
Figure 7. Schematic diagram summarizing the role of acidic pH in regulating growth and redox homeostasis
Acidic pH drives a reduction of the cytoplasmic potential and a slowing of Mtb growth. PhoPR functions to mitigate reductive stress and slow Mtb growth. This is possibly achieved by syphoning carbon away from the TCA cycle to promote oxidation of NADPH through lipid anabolism, such as acid inducible sulfolipid accumulation (Fig. 6A). Addition of PEP-oxaloacetate- pyruvate node metabolites may promote growth by fueling the TCA cycle and remodeling central metabolism, including the induction of pckA and icl1.

References

    1. Abramovitch RB, Rohde KH, Hsu FF, Russell DG. aprABC: a Mycobacterium tuberculosis complex-specific locus that modulates pH-driven adaptation to the macrophage phagosome. Mol Microbiol. 2011;80:678–694. - PMC - PubMed
    1. Akif M, Khare G, Tyagi AK, Mande SC, Sardesai AA. Functional studies of multiple thioredoxins from Mycobacterium tuberculosis. J Bacteriol. 2008;190:7087–7095. - PMC - PubMed
    1. Anders S, Huber W. Differential expression analysis for sequence count data. Genome Biol. 2010;11:R106. - PMC - PubMed
    1. Asensio JG, Maia C, Ferrer NL, Barilone N, Laval F, Soto CY, Winter N, Daffe M, Gicquel B, Martin C, Jackson M. The virulence-associated two component PhoP-PhoR system controls the biosynthesis of polyketide-derived lipids in Mycobacterium tuberculosis. J Biol Chem. 2006;281:1313–1316. - PubMed
    1. Baek SH, Li AH, Sassetti CM. Metabolic regulation of mycobacterial growth and antibiotic sensitivity. PLoS Biol. 2011;9:e1001065. - PMC - PubMed

Publication types

MeSH terms

Associated data