

A maximum entropy approach to the study of residue-specific backbone angle distributions in α-synuclein, an intrinsically disordered protein
- PMID: 24976112
- PMCID: PMC4243998
- DOI: 10.1002/pro.2511
A maximum entropy approach to the study of residue-specific backbone angle distributions in α-synuclein, an intrinsically disordered protein
Abstract
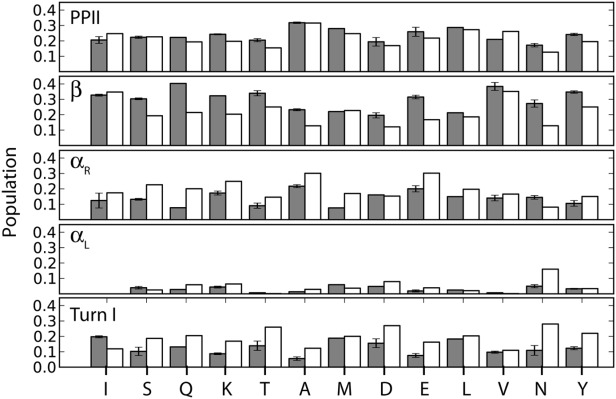
α-Synuclein is an intrinsically disordered protein of 140 residues that switches to an α-helical conformation upon binding phospholipid membranes. We characterize its residue-specific backbone structure in free solution with a novel maximum entropy procedure that integrates an extensive set of NMR data. These data include intraresidue and sequential H(N) − H(α) and H(N) − H(N) NOEs, values for (3) JHNHα, (1) JHαCα, (2) JCαN, and (1) JCαN, as well as chemical shifts of (15)N, (13)C(α), and (13)C' nuclei, which are sensitive to backbone torsion angles. Distributions of these torsion angles were identified that yield best agreement to the experimental data, while using an entropy term to minimize the deviation from statistical distributions seen in a large protein coil library. Results indicate that although at the individual residue level considerable deviations from the coil library distribution are seen, on average the fitted distributions agree fairly well with this library, yielding a moderate population (20-30%) of the PPII region and a somewhat higher population of the potentially aggregation-prone β region (20-40%) than seen in the database. A generally lower population of the αR region (10-20%) is found. Analysis of (1)H − (1)H NOE data required consideration of the considerable backbone diffusion anisotropy of a disordered protein.
Keywords: Karplus curve; diffusion anisotropy; intrinsically disordered proteins; random coil; short-range NOE.
Published 2014. This article is a U.S. Government work and is in the public domain in the USA.
Figures

 –
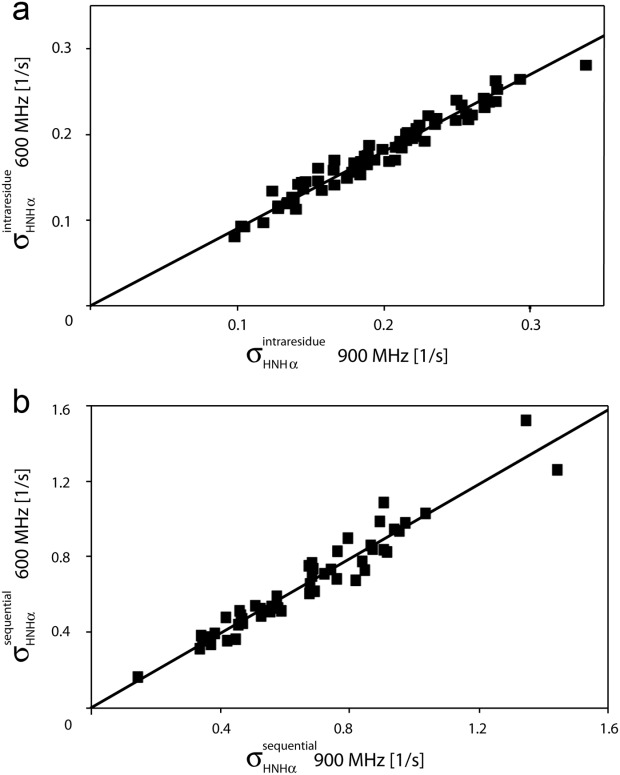
– and (b) sequential
 –
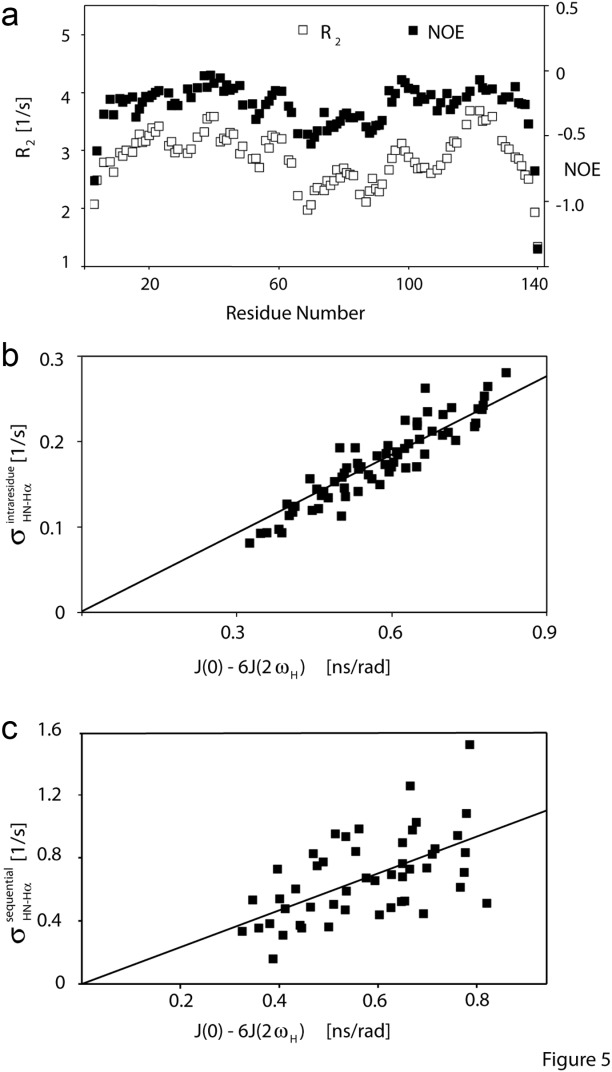
– crossrelaxation rates measured at 600 and 900 MHz 1H frequency. For (b), which involves short interproton distances when the vector is approximately parallel to the
 –
– vector, the slope equals 0.99, indicating that the impact of the 6J(2ωH) term is negligible, considering that J(2ωH) is estimated to be about two-fold smaller at 900 MHz compared to 600 MHz 1H frequency. For the intraresidue
 –
– interaction, which makes a large angle with the
 −
−  vector, the slope is ∼0.9, indicating that the 6J(2ωH) term is small (∼10% of J(0)).
References
-
- Dunker AK, Brown CJ, Lawson JD, Iakoucheva LM, Obradovic Z. Intrinsic disorder and protein function. Biochemistry. 2002;41:6573–6582. - PubMed
-
- Csizmok V, Felli IC, Tompa P, Banci L, Bertini I. Structural and dynamic characterization of intrinsically disordered human securin by NMR spectroscopy. J Am Chem Soc. 2008;130:16873–16879. - PubMed
-
- Dyson HJ, Wright PE. Intrinsically unstructured proteins and their functions. Nat Rev Mol Cell Biol. 2005;6:197–208. - PubMed
-
- Shi ZS, Chen K, Liu ZG, Kallenbach NR. Conformation of the backbone in unfolded proteins. Chem Rev. 2006;106:1877–1897. - PubMed
Publication types
MeSH terms
Substances
LinkOut - more resources
Full Text Sources
Other Literature Sources
