. 2014 Aug;16(8):779-91.
doi: 10.1038/ncb2994. Epub 2014 Jun 29.

Increased microtubule assembly rates influence chromosomal instability in colorectal cancer cells

Affiliations

Increased microtubule assembly rates influence chromosomal instability in colorectal cancer cells

Norman Ertych et al. Nat Cell Biol. 2014 Aug.

Abstract

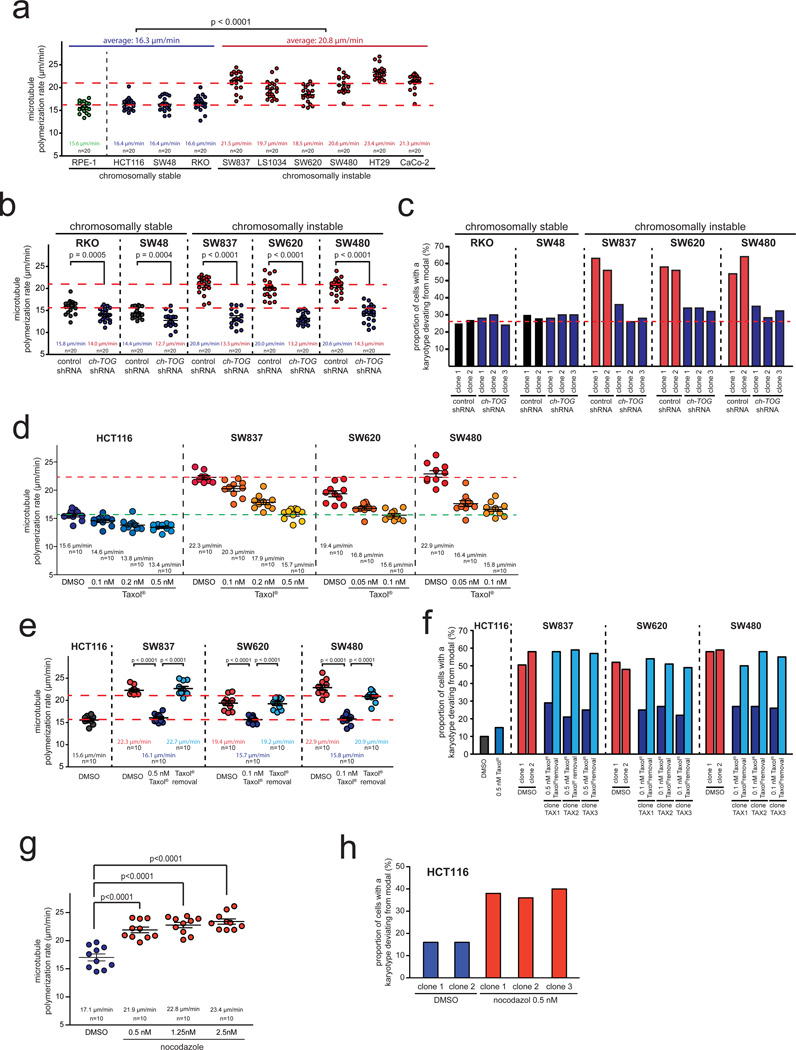
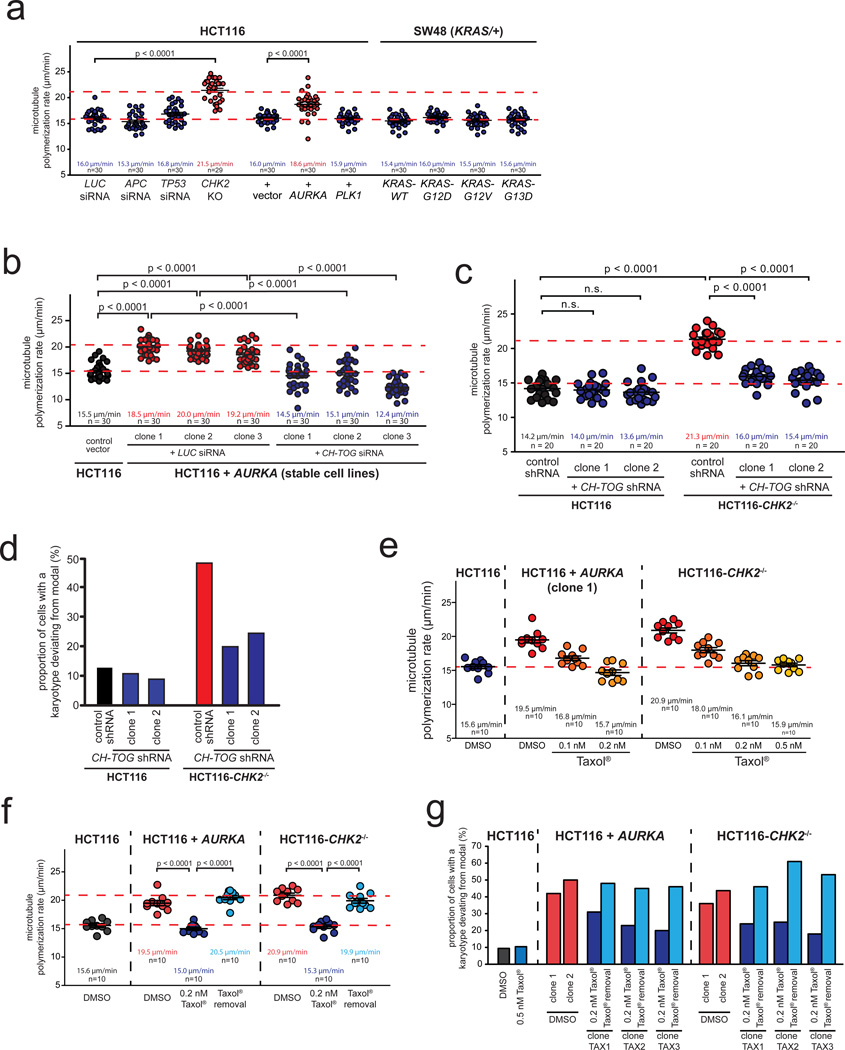
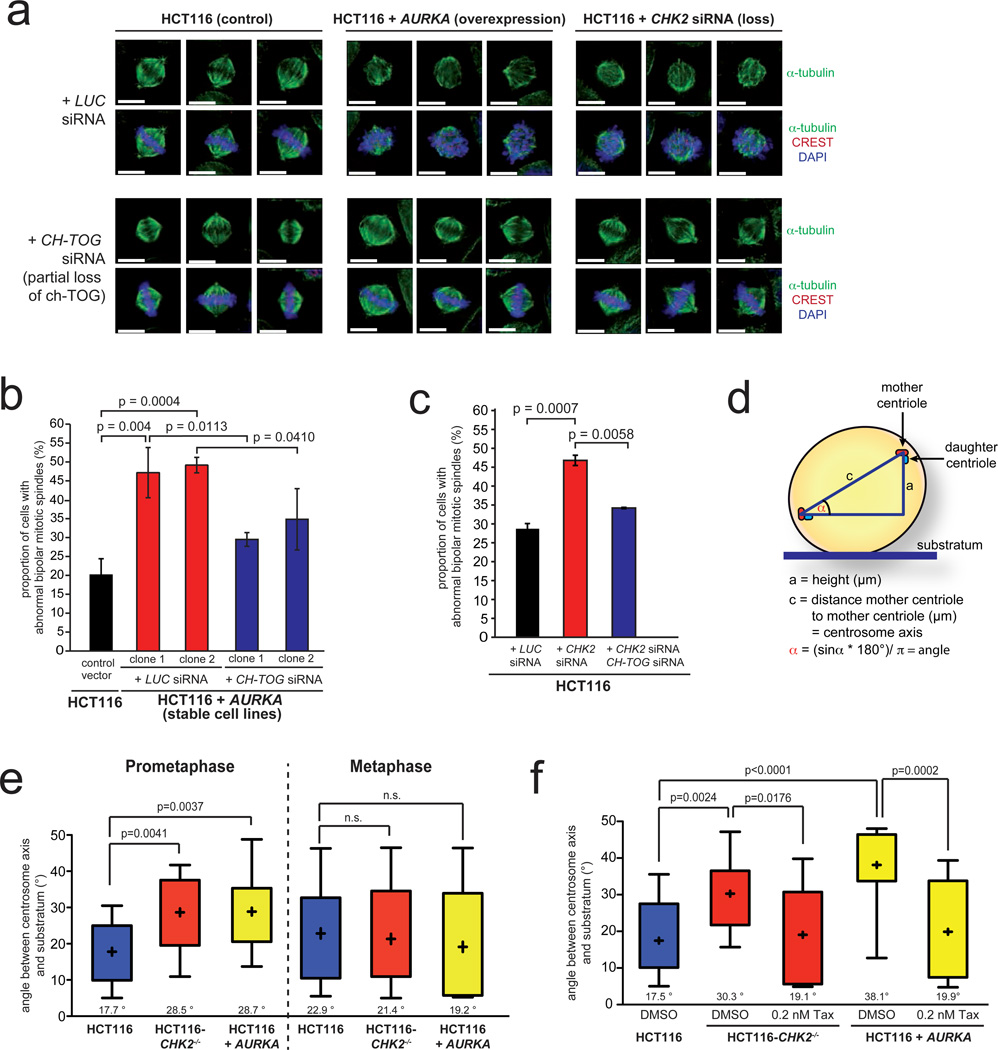
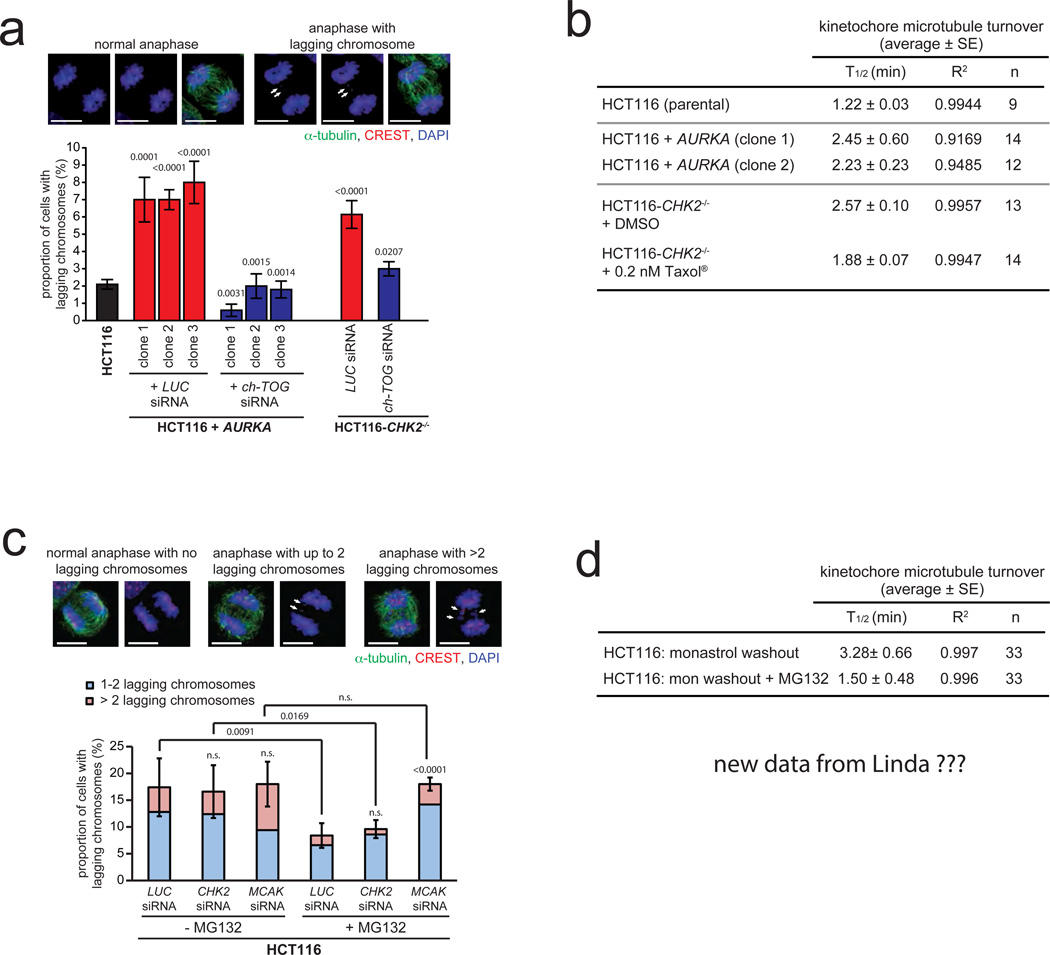
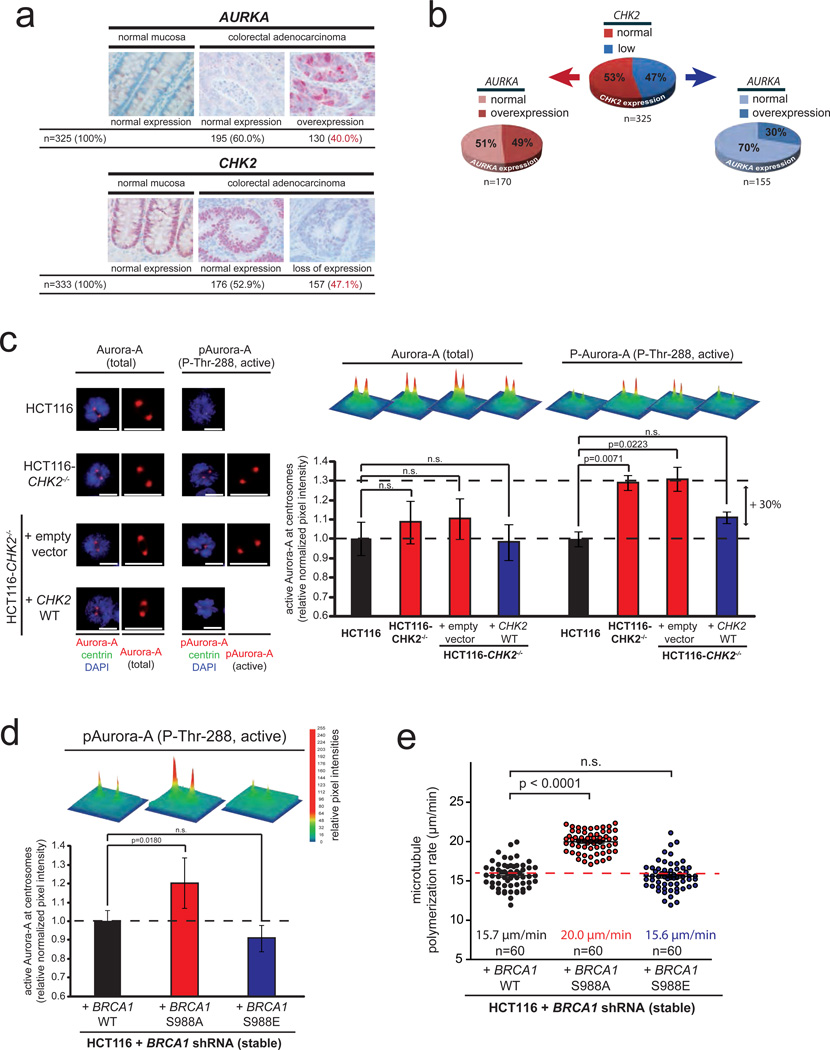
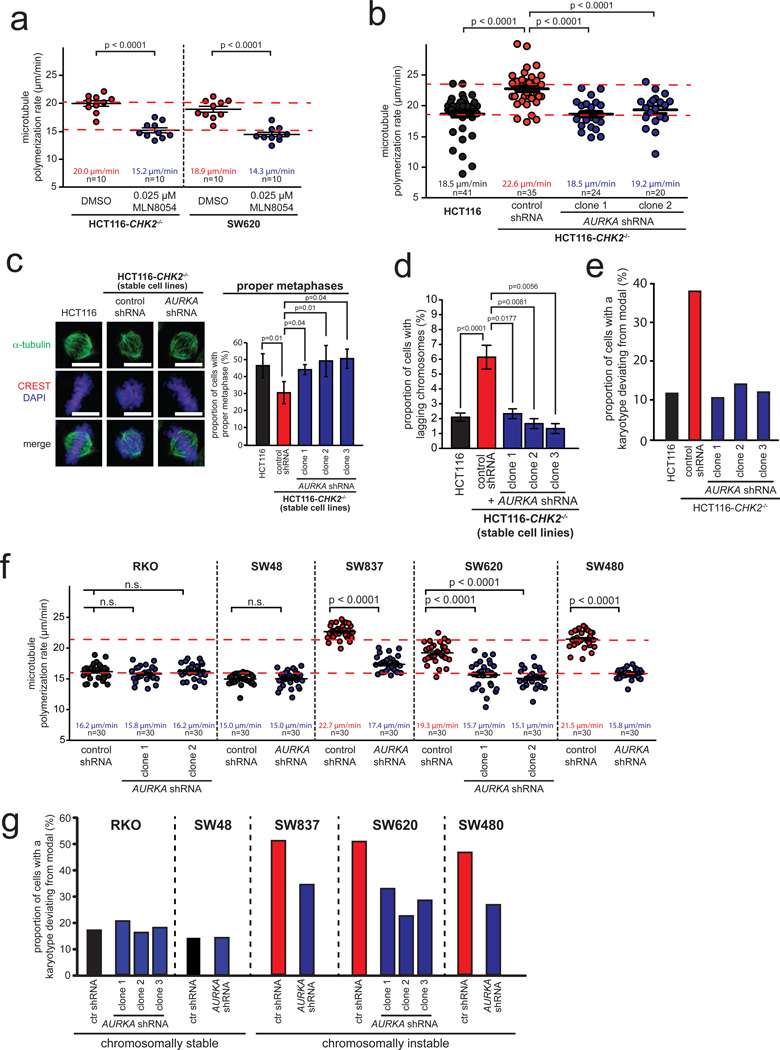
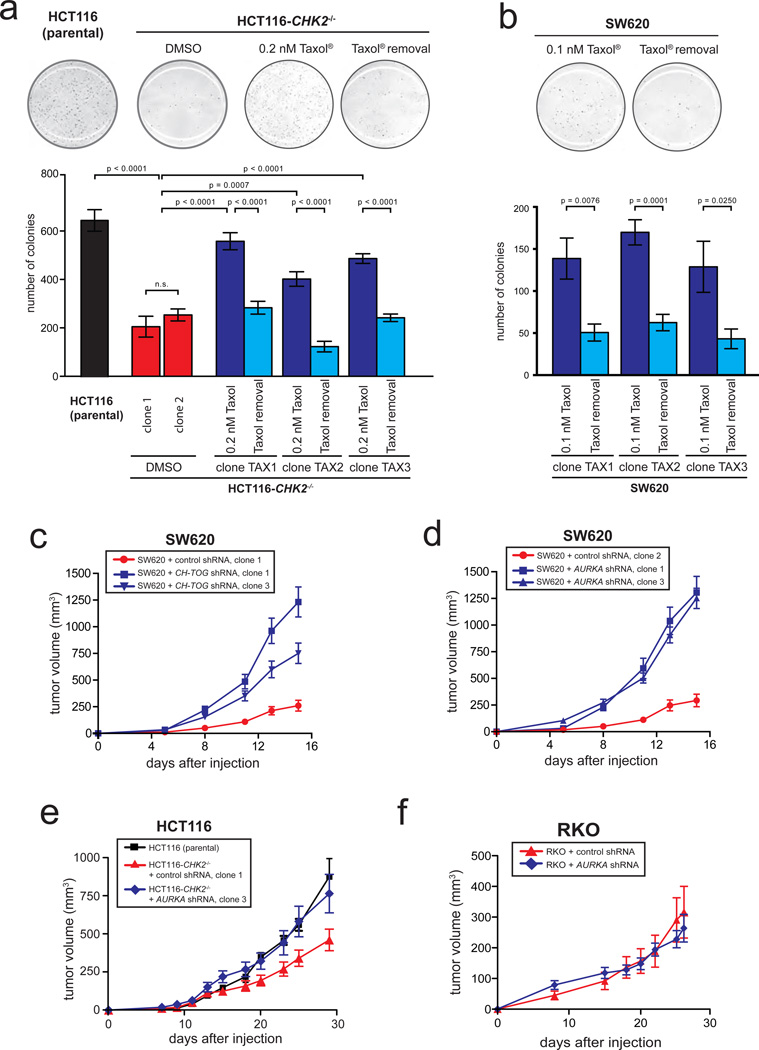
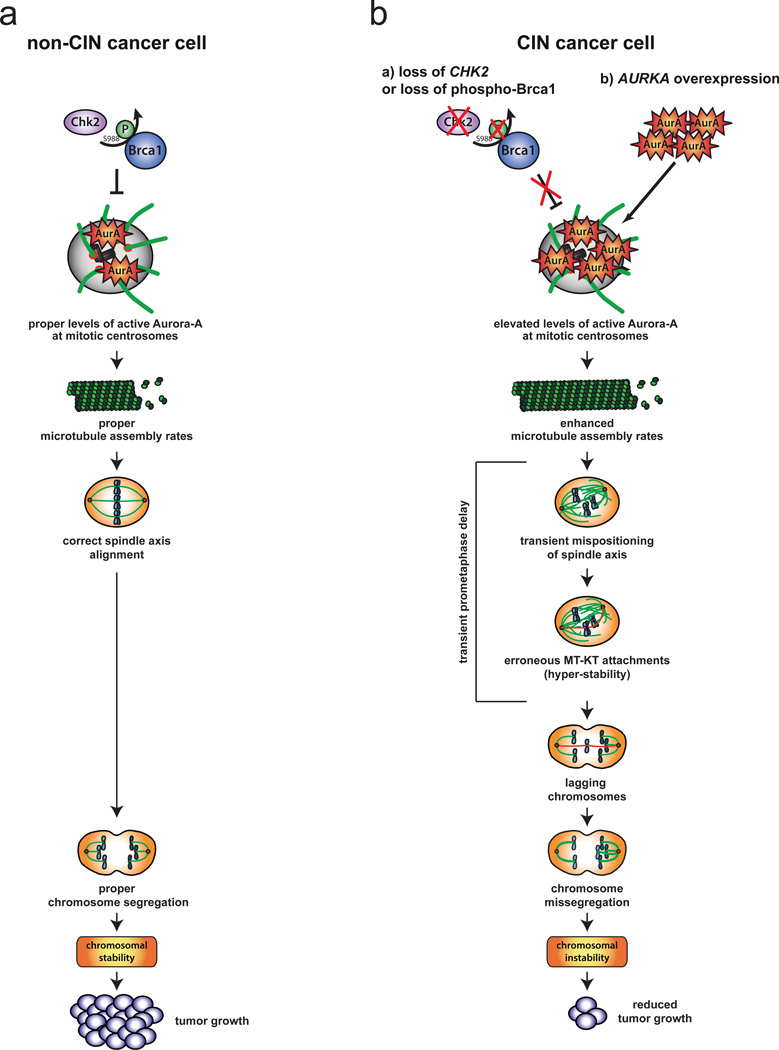
Chromosomal instability (CIN) is defined as the perpetual missegregation of whole chromosomes during mitosis and represents a hallmark of human cancer. However, the mechanisms influencing CIN and its consequences on tumour growth are largely unknown. We identified an increase in microtubule plus-end assembly rates as a mechanism influencing CIN in colorectal cancer cells. This phenotype is induced by overexpression of the oncogene AURKA or by loss of the tumour suppressor gene CHK2, a genetic constitution found in 73% of human colorectal cancers. Increased microtubule assembly rates are associated with transient abnormalities in mitotic spindle geometry promoting the generation of lagging chromosomes and influencing CIN. Reconstitution of proper microtubule assembly rates by chemical or genetic means suppresses CIN and thereby, unexpectedly, accelerates tumour growth in vitro and in vivo. Thus, we identify a fundamental mechanism influencing CIN in cancer cells and reveal its adverse consequence on tumour growth.


Figures

Figure 1
Figure 1
Increased mitotic microtubule assembly rates are a common characteristic of chromosomally instable CRC cells and mediate numerical chromosome instability. a, Measurement of mitotic microtubule plus end assembly rates in various CRC cell lines expressing EB3-GFP. Scatter dot plots show average assembly rates based on measurements of 20 microtubules per cell (mean +/− SEM, t-test, n=20 cells). b, Measurement of mitotic microtubule plus end assembly rates in stable CRC cell lines expressing control or shRNAs targeting CH-TOG/CKAP5. Scatter dot plots show average assembly rates (20 microtubules/cell, mean +/− SEM, t-test, n=20 cells). c, Determination of chromosome number variability in single cell clones shown in b. The proportion of cells showing chromosome numbers deviating from the modal were determined after 30 generations (n=50–103 cells). d, Measurement of mitotic microtubule plus end assembly rates after titration of sub-nanomolar doses of Taxol®. Scatter dot plots show average assembly rates (20 microtubules/cell; mean +/− SEM, n=10 cells). e, Measurement of mitotic microtubule plus end assembly rates of single cell clones derived from CRC cell lines and grown in the absence or presence of low doses of Taxol® or after subsequent removal of Taxol®. Scatter dot plots show average assembly rates (20 microtubules/cell, mean +/− SEM, t-test, n=10 cells). f, Determination of chromosome number variability in single cell clones generated as in e. The proportion of cells showing chromosome number deviations from the modal were determined after 30 generations (n=100–109 cells). g, Measurement of mitotic microtubule plus end assembly rates in chromosomally stable HCT116 cells after treatment with low doses of nocodazole. Scatter dot plots show average assembly rates (20 microtubules/cell, mean +/− SEM, t-test, n=10 cells). h, Determination of chromosome number variability in single cell clones generated in the absence or presence of low dose nocodazole. The proportion of cells showing chromosome number deviations from the modal were determined after 30 generations (n=50 cells). Detailed data on karyotype analyses can be found in the Supplementary Table S1. Statistic source data for Figure 1 can be found in the Supplementary Table S2.
Figure 2
Figure 2
Identification of AURKA overexpression and CHK2 loss as lesions triggering increased microtubule assembly rates in CRC cells. a, Measurement of mitotic microtubule plus end assembly rates in HCT116 cell harboring the indicated genetic alterations. Scatter dot plots show average assembly rates (20 microtubules/cell, mean +/− SEM, t-test, n=29–30 cells). b, Measurement of mitotic microtubule plus end assembly rates in cells stably overexpressing AURKA and transfected with control or CH-TOG/CKAP5 siRNAs. Scatter dot plots show average assembly rates based on measurements of 20 microtubules per cell (mean +/− SEM, t-test, n=30 cells). c, Measurement of mitotic microtubule plus end assembly rates in CHK2 deficient cells stably transfected with shRNAs targeting CH-TOG/CKAP5. Scatter dot plot show average assembly rates based on measurements of 20 microtubules per cell (mean +/−SEM, t-test, n=20 cells). d, Karyotype analyses of single cell clones derived from HCT116 and HCT116-CHK2−/− stably repressing CH-TOG/CKAP5. The proportion of cells showing chromosome number deviations from the modal were determined after 30 generations (n=50 cells). e, Measurement of mitotic microtubule plus end assembly rates of HCT116 cells overexpressing AURKA or deficient for CHK2 after titration of sub-nanomolar doses of Taxol®. Scatter dot plots show average assembly rates (20 microtubules/cell; mean +/− SEM, n=10 cells). f, Measurement of mitotic microtubule plus end assembly rates in single cell clones derived from HCT116 cells stably overexpressing AURKA or deficient for CHK2 and grown in the absence, presence or after removal of low dose Taxol®. Scatter dot plots show average growth rates (20 microtubules/cell, mean +/− SEM, t-test, n=10 cells). g, Determination of chromosome number variability in single cell clones shown in f. The proportion of cells showing chromosome numbers deviating from the modal were determined (n=100–103 cells). Detailed data on karyotype analyses can be found in the Supplementary Table S1. Statistic source data for Figure 2 can be found in the Supplementary Table S2.
Figure 3
Figure 3
Increased microtubule assembly rates result in abnormal mitotic spindle geometry. a, Examples of metaphase spindle structures from cells overexpressing AURKA or deficient for CHK2 with or without partial repression of CH-TOG/CKAP5 (α-tubulin, green; CREST/kinetochores, red; DAPI, blue; scale bar: 10 µm). b, Quantification of abnormal bipolar metaphase spindle structures in HCT116 cells stably overexpressing AURKA before and after partial depletion of CH-TOG/CKAP5. The graphs show mean values +/− SD, t-test (n=240–1100 mitotic cells). c, Quantification of abnormal bipolar metaphase spindle structures in HCT116 cells after depletion of CHK2 and after concomitant repression of CH-TOG/CKAP5. The graphs show mean values +/−SD, t-test (n=1000–1300 mitotic cells). d, Schematic depiction of the experimental measurement of spindle axes positioning. e, Determination of angles of the spindle axes in cells overexpressing AURKA or deficient for CHK2 in prometaphase and metaphase cells. The box and whisker plots show the range, mean and quartil of the measurements (t-test, n=15 cells, prometaphase; n=9–11 cells, metaphase). f, Determination of angles of the spindle axes in prometaphase cells before and after reconstitution of normal microtubule assembly rates by low dose Taxol® treatment. The box and whisker plot shows the range, mean and quartil of the measurements (t-test, n=13–16 cells per group). Statistic source data for Figure 3 can be found in the Supplementary Table S2.
Figure 4
Figure 4
Increased microtubule assembly rates promote the generation of lagging chromosomes without interfering with error correction. a, Quantification of the proportion of cells exhibiting lagging chromosomes using HCT116 cells overexpressing AURKA or deficient for CHK2 and transfected with siRNAs targeting CH-TOG/CKAP5. Representative examples are given (scale bar, 10 µm). The graph shows mean values +/− SEM (t-test, n= 230–350 anaphase cells). b, Summary of the measurements of half-lifes of kinetochore-microtubule turnover in the indicated cell lines expressing photoactivatable GFP-tubulin (PA-GFP-tubulin). The addition of low concentrations of Taxol® reversed the observed hyper-stabilization of kinetochore microtubule attachments in CHK2 deficient cells (average +/− SE, n=9–14 cells as indicated). c, Quantification of the proportion of HCT116 cells showing lagging chromosomes after washout of monastrol and prolonging metaphase by MG132 treatment in the presence or absence of Chk2 or MCAK. The graph shows mean values +/− SD for cells exhibiting 1–2 and more than 2 lagging chromosomes per anaphase (t-test, n= 500 anaphase cells). d, Summary of kinetochore-microtubule turnover measurements in HCT116 cells expressing PA-GFP-tubulin immediately after establishing bipolar spindles upon release from a monastrol block and after release from monastrol into MG132 to prolong time for error correction (average +/− SE, n=33 cells for each condition). Statistic source data for Figure 4 can be found in the Supplementary Table S2.
Figure 5
Figure 5
The CHK2-BRCA1 tumor suppressor pathway negatively regulates the oncogene AURKA to ensure proper microtubule plus end assembly rates. a, Detection of Chk2 and Aurora-A proteins by immunohistochemistry analyses in tissue sections from normal mucosa and from colorectal adenocarcinomas. Examples and overall quantifications are given. b, Depiction of the relationship of CHK2 and AURKA expression in CRC. Individual tumor samples were subdivided due to their CHK2 expression status and subsequently analyzed for their AURKA expression (n=325 tissue samples, t-test, p=0.001). c, Detection of total and active centrosomal Aurora-A (P-Thr-288) and centrin in prometaphase cells proficient or deficient for CHK2. Signal intensities were normalized to signals for centrosomal centrin and are depicted as 3D surface plots and were quantified (mean +/− SEM, t-test, n=49–50 cells for total Aurora-A and n=72–75 cells for P-Thr-288-Aurora-A). d, Detection of increased active centrosomal Aurora-A in mitotic HCT116 cells in which the endogenous Brca1 protein was replaced by the indicated BRCA1 mutants. Signal intensities for active Aurora-A (pThr-288) at mitotic centrosomes normalized to signals obtained for centrosomal centrin are depicted as 3D surface plots and were quantified (mean, +/− SEM, t-test, 55–57 cells). e, Measurement of mitotic microtubule plus end assembly rates in cells expressing either wild type or mutant BRCA1. Scatter dot plots show average growth rates based on measurements of 20 microtubules per cell (mean +/− SEM; t-test, n=60 cells). Statistic source data for Figure 5 can be found in the Supplementary Table S2.
Figure 6
Figure 6
Increased Aurora-A kinase activity is a key trigger for increased microtubule assembly rates and CIN in CRC cells. a, Measurement of mitotic microtubule plus end assembly rates in CRC cells after partial inhibition of Aurora-A by low dose MLN8054 treatment. Scatter dot plots show average growth rates (20 microtubules/cell, mean +/− SEM, t-test, n=10 cells). b, Measurement of mitotic microtubule plus end assembly rates in CHK2 deficient cells after partial repression of AURKA. Scatter dot plots show average microtubule growth rates (20 microtubules/cell; mean +/− SEM, t-test, n=20–41 cells). c, Quantification of proper metaphase spindles and complete chromosome alignment in CHK2 deficient cells after restoration of proper microtubule assembly rates by partial repression of AURKA. Representative mitotic spindles are shown (scale bar, 10 µm) and proper metaphase spindles with completed chromosome alignment were quantified (mean +/− SD, t-test, n=200–2,500 mitotic cells). d, Detection of lagging chromosomes during anaphase in HCT116 and HCT116-CHK2−/− cells with or without partial repression of AURKA (mean +/− SD; t-test, n=300 anaphase cells). e, Determination of chromosome number variability in single cell clones derived from CHK2 deficient cells with partial repression of AURKA. The proportion of cells exhibiting chromosome numbers deviating from the modal were determined (n=91–100 cells). f, Measurement of mitotic microtubule plus end assembly rates in various chromosomally instable CRC cell lines stably expressing control or AURKA shRNAs. Average microtubule growth rates were determined (20 microtubules/cell, mean +/− SEM, t-test, n=30 cells). g, Chromosome number variability in single cell clones derived from various CRC cell lines and stably expressing control or AURKA shRNAs. The proportion of cells exhibiting chromosome numbers deviating from the modal were determined (n=81–104 cells). Detailed data on karyotype analyses can be found in the Supplementary Table S1. Statistic source data for Figure 6 can be found in the Supplementary Table S2.
Figure 7
Figure 7
Suppression of CIN by restoring proper microtubule assembly rates accelerates tumor growth in vitro and in vivoa, Determination of colony formation in soft agar of HCT116 and HCT116-CHK2−/− cells in the presence or absence of low dose Taxol®. Single cell clones were generated and 5,000 cells were seeded onto soft agar. Colony numbers were quantified and the graphs show mean values +/− SEM, t-test (n=4–6 experiments). b, Determination of colony formation in soft agar of SW620 cells in the presence or absence of low dose Taxol®. Single cell clones were generated and 2,000 cells were seeded onto soft agar. Colony numbers were quantified and the graphs show mean values +/− SEM, t-test (n=6 experiments). c, Xenograft tumor growth in mice after s.c. injection of chromosomally instable SW620 expressing control or CH-TOG/CKAP5 shRNAs into both flanks of nude mice. Tumor growth was monitored and tumor volumes are shown as mean values +/− SEM (n=14–16 tumors for each group). d, Xenograft tumor growth in mice after s.c. injection of chromosomally instable SW620 expressing control or AURKA shRNAs into both flanks of nude mice. Tumor growth was monitored and tumor volumes are shown as mean values +/− SEM (n=14–16 tumors for each group). e, Xenograft tumor growth in mice after s.c. injection of HCT116 (chromosomally stable), HCT116-CHK2−/− (chromosomally instable) or CHK2 deficient cells stably expressing AURKA shRNAs (exhibiting restored normal microtubule assembly rates and suppressed CIN). Tumor volumes were measured over time and are shown as mean values +/− SEM (n=7–11 tumors for each group). f, Xenograft tumor growth in mice after s.c. injection of chromosomally stable RKO cells expressing control or AURKA shRNAs into both flanks of nude mice. Xenograft tumor growth was monitored and tumor volumes are shown as mean values +/−SEM (n=10 tumors for each group). Statistic source data for Figure 7 can be found in the Supplementary Table S2.
Figure 8
Figure 8
Model summarizing the main findings of this report. a, In chromosomally stable cancer cells the CHK2-BRCA1 tumor suppressor pathway is required to ensure proper levels of Aurora-A activity at mitotic centrosomes. This ensures proper microtubule plus end assembly rates as a prerequisite for normal progression of mitosis and proper chromosome segregation. b, Either the loss of the CHK2-BRCA1 tumor suppressor pathway or an overexpression of AURKA results in enhanced levels of Aurora-A at mitotic centrosomes, which triggers increased microtubule assembly rates. This, in turn, causes transient spindle geometry abnormalities facilitating the generation of erroneous microtubule-kinetochore attachments and lagging chromosomes as a source for chromosome missegregation. Thus, increased microtubule assembly rates represent a key trigger for perpetual chromosome missegregation, which is associated with reduced tumor growth in vitro and in vivo.

Comment in

References

    1. Rajagopalan H, Nowak MA, Vogelstein B, Lengauer C. The significance of unstable chromosomes in colorectal cancer. Nat Rev Cancer. 2003;3:695–701. - PubMed
    1. McGranahan N, Burrell RA, Endesfelder D, Novelli MR, Swanton C. Cancer chromosomal instability: therapeutic and diagnostic challenges. EMBO Rep. 2012;13:528–538. - PMC - PubMed
    1. Pfau SJ, Amon A. Chromosomal instability and aneuploidy in cancer: from yeast to man. EMBO Rep. 2012;13:515–527. - PMC - PubMed
    1. Gordon DJ, Resio B, Pellman D. Causes and consequences of aneuploidy in cancer. Nat Rev Genet. 2012;13:189–203. - PubMed
    1. Thompson SL, Bakhoum SF, Compton DA. Mechanisms of chromosomal instability. Curr Biol. 2010;20:R285–R295. - PMC - PubMed

Publication types

MeSH terms