. 2014 Jun 28;20(24):7914-25.
doi: 10.3748/wjg.v20.i24.7914.

Distinct antifibrogenic effects of erlotinib, sunitinib and sorafenib on rat pancreatic stellate cells

Affiliations

Distinct antifibrogenic effects of erlotinib, sunitinib and sorafenib on rat pancreatic stellate cells

Anne Elsner et al. World J Gastroenterol. .

Abstract

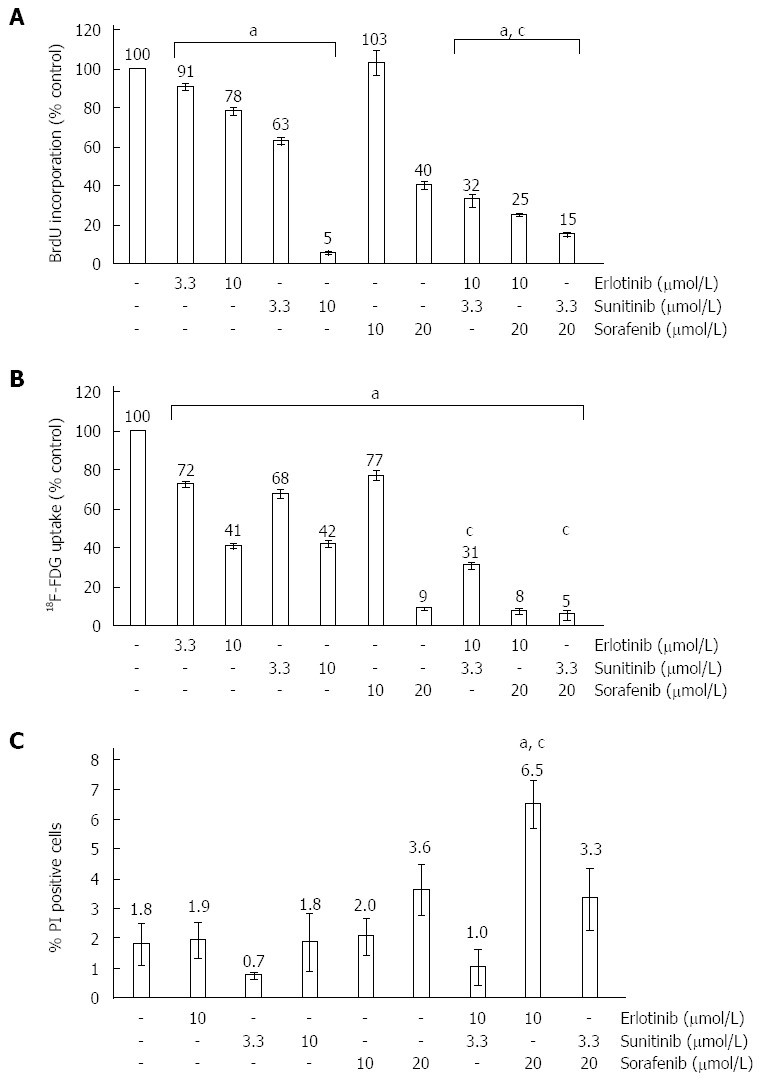
Aim: To study if three clinically available small molecule kinase inhibitors (SMI), erlotinib, sunitinib and sorafenib, exert antifibrogenic effects on pancreatic stellate cells (PSC) and analyze the basis of their action.

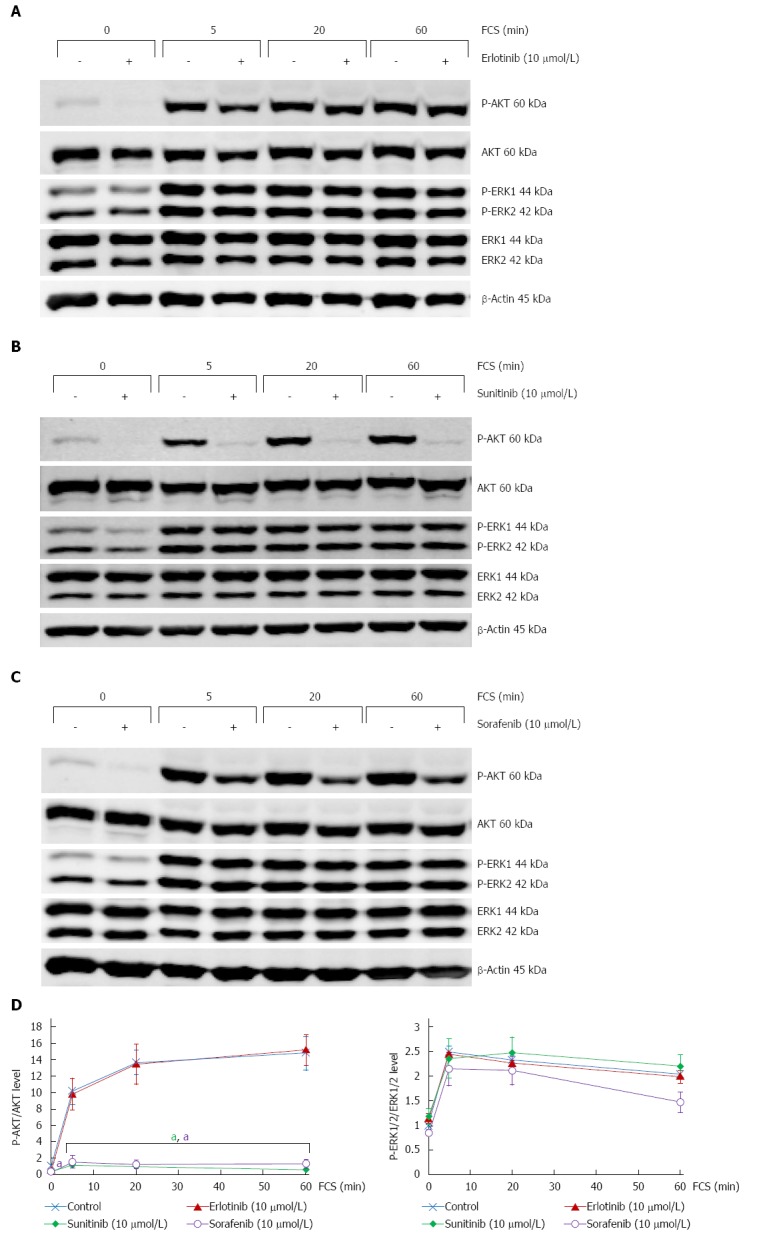
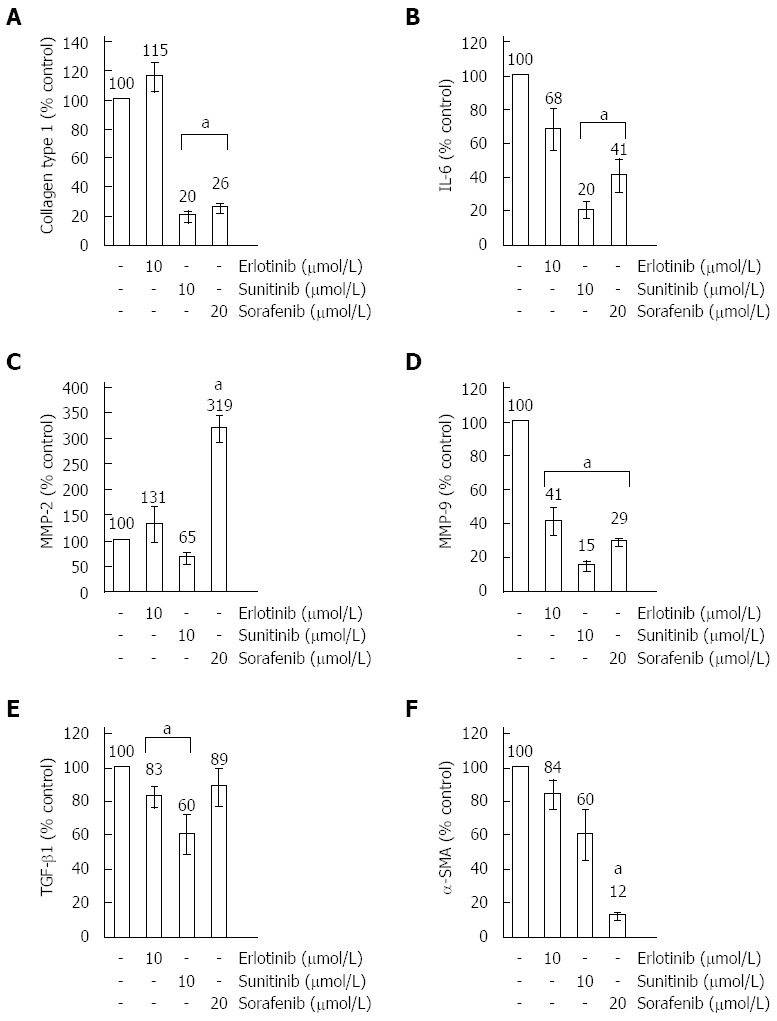
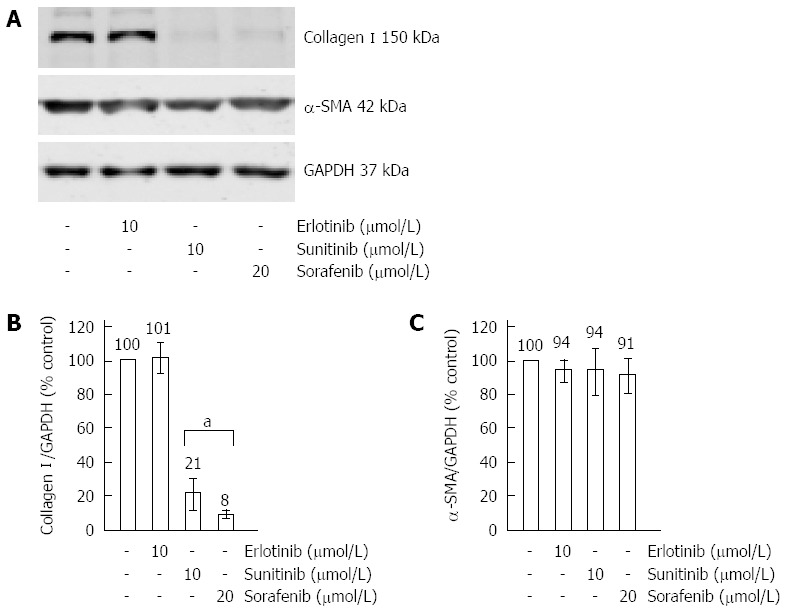
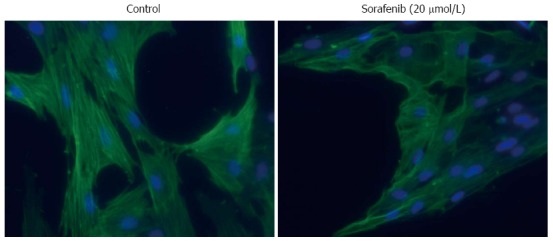
Methods: Cultured rat PSC were exposed to SMI. Cell proliferation and viability were assessed employing 5-bromo-2'-deoxyuridine incorporation assay and flow cytometry, respectively. 2-Deoxy-2-[(18)F] fluoroglucose ((18)F-FDG) uptake was measured to study metabolic activity. Exhibition of the myofibroblastic PSC phenotype was monitored by immunofluorescence analysis of α-smooth muscle actin (α-SMA) expression. Levels of mRNA were determined by real-time PCR, while protein expression and phosphorylation were analyzed by immunoblotting. Transforming growth factor-β1 (TGF-β1) levels in culture supernatants were quantified by ELISA.

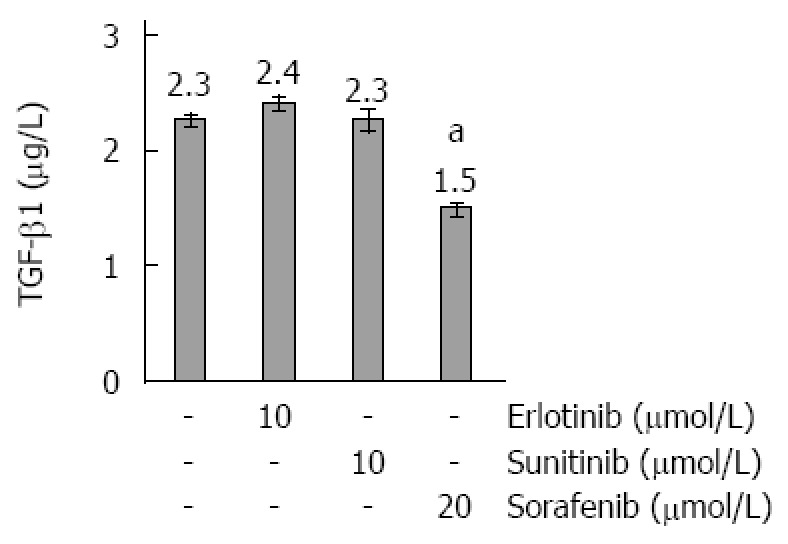
Results: All three SMI inhibited cell proliferation and (18)F-FDG uptake in a dose-dependent manner and without significant cytotoxic effects. Furthermore, additive effects of the drugs were observed. Immunoblot analysis showed that sorafenib and sunitib, but not erlotinib, efficiently blocked activation of the AKT pathway, while all three drugs displayed little effect on phosphorylation of ERK1/2. Cells treated with sorafenib or sunitinib expressed less interleukin-6 mRNA as well as less collagen type 1 mRNA and protein. Sorafenib was the only drug that also upregulated the expression of matrix metalloproteinase-2 and reduced the secretion of TGF-β1 protein. All three drugs showed insignificant or discordant effects on the mRNA and protein levels of α-SMA.

Conclusion: The tested SMI, especially sorafenib, exert inhibitory effects on activated PSC, which should be further evaluated in preclinical studies.

Keywords: Erlotinib; Fibrosis; Pancreatic stellate cell; Sorafenib; Sunitinib.


Figures

Figure 1
Figure 1
Effects of small molecule kinase inhibitors on DNA synthesis, 2-Deoxy-2-[18F] fluoroglucose uptake and survival of pancreatic stellate cells. Pancreatic stellate cells (PSC) growing in primary culture were harvested, replated at equal seeding densities and treated with erlotinib, sunitinib, sorafenib and combinations thereof at the indicated concentrations for 24 h. Control cultures were exposed to the solvent DMSO only. A: The pretreated cells were labelled with 5-bromo-2’-deoxyuridine (BrdU) for another 24 h and proliferation was assessed with the BrdU DNA incorporation assay. One hundred percent BrdU incorporation corresponds to solvent-treated PSC. Data from n ≥ 17 separate cultures per data point were used to calculate mean ± SE; B: The cells were labelled with 2-Deoxy-2-[18F] fluoroglucose (18F-FDG), and uptake quantified as described in the “Materials and methods” section. One hundred percent 18F-FDG uptake corresponds to solvent-treated PSC (n ≥ 6; mean ± SE); C: Incubation was continued for another 24 h. Afterwards, the samples were subjected to a cytofluorometric quantification of dead [phosphatidylinositol (PI)-positive] cells, which are expressed as percent of the total cell number (n ≥ 5; mean ± SE). (A-C) aP < 0.05, cP < 0.05 vs cultures treated with either of the two combined substances alone.
Figure 2
Figure 2
Distinct effects of erlotinib, sorafenib and sunitinib on phosphorylation of AKT and ERK1/2. Cultured pancreatic stellate cells (PSC) were grown to subconfluency before the standard culture medium was substituted by fetal calf serum (FCS)-free medium. 16 h later, culture medium was supplemented with (A) erlotinib, (B) sunitinib and (C) sorafenib at the indicated concentrations and incubation continued for another hour. Subsequently, FCS (at 17%) was added for the indicated periods of time. Afterwards, protein extracts from equal amounts of cells were subjected to Western blot analysis. P-AKT, P-ERK1/2, the respective total proteins and β-actin (for loading control) were detected using fluorescein (IRDye®)-labelled secondary antibodies. For each inhibitor, one representative Western blot is shown; D: Fluorescence signal intensities of phosphoproteins (P-AKT and P-ERK1/2, respectively) and corresponding total proteins were quantified using Odyssey® software. Subsequently, the ratios P-AKT/AKT protein (left panel) and P-ERK/ERK protein (right panel) were determined. A ratio of 1 corresponds to control cells cultured without small molecule kinase inhibitors (SMI) and FCS. Data of n ≥ 4 independent experiments were used to calculate mean ± SE; aP < 0.05 vs control cultures (no SMI, same time of FCS stimulation).
Figure 3
Figure 3
Real-time PCR analysis of gene expression in small molecule kinase inhibitors-treated pancreatic stellate cells. Cultured pancreatic stellate cells (PSC) were exposed to small molecule kinase inhibitors (SMI) at the indicated concentrations for 48 h. The mRNA expression of collagen type 1 (A), IL-6 (B), MMP-2 (C), MMP-9 (D), TGF-β1 (E), α-SMA (F) and the housekeeping gene HPRT was analyzed by real-time PCR, and relative amounts of target mRNA were calculated as described in the “Materials and methods” section. One hundred percent mRNA expression of each gene corresponds to cells treated with the solvent DMSO only. Data of n = 5 independent cultures were used to calculate mean ± SE. aP < 0.05 vs control cultures.
Figure 4
Figure 4
Effects of erlotinib, sorafenib and sunitinib on the expression of type I collagen and α-smooth muscle actin. Cultured pancreatic stellate cells (PSC) were grown to subconfluency before they were treated for 48 h with SMI at the indicated concentrations. Afterwards, protein extracts from equal amounts of cells were subjected to Western blot analysis. Type I collagen, α-SMA and GAPDH (for loading control) were detected using fluorescein (IRDye®)-labelled secondary antibodies. (A) One representative Western blot for all three SMI is shown. Afterwards, fluorescence signal intensities of collagen I (B), α-smooth muscle actin (α-SMA) (C) and GAPDH (B and C) were quantified using Odyssey® software. Subsequently, the ratios collagen I/GAPDH (B) and α-SMA/GAPDH (C) were determined to normalize for loading variations. A ratio of one hundred percent corresponds to control cells cultured without SMI. Data of n = 6 independent experiments were used to calculate mean ± SE. aP < 0.05 vs control cultures.
Figure 5
Figure 5
Transforming growth factor-β1 concentrations in culture supernatants of small molecule kinase inhibitors-treated pancreatic stellate cells. Cultured pancreatic stellate cells were grown to subconfluency before they were treated for 48 h with Small molecule kinase inhibitors at the indicated concentrations. The concentrations of transforming growth factor (TGF)-β1 in cell culture supernatants were determined by ELISA. Data of n = 6 independent cultures were used to calculate mean ± SE. aP < 0.05 vs control cultures (one-way ANOVA test).
Figure 6
Figure 6
Effects of small molecule kinase inhibitors on α-smooth muscle actin expression and stress fiber formation in pancreatic stellate cell. Pancreatic stellate cells growing on glass coverslips were treated for 48 h with sorafenib or the solvent DMSO (control) as indicated. Expression and structural organization of α-smooth muscle actin were analyzed by immunofluorescence staining of the protein and documented by fluorescence microscopy (counterstaining: DAPI; original magnification × 200).

Similar articles

Cited by

References

    1. Erkan M, Adler G, Apte MV, Bachem MG, Buchholz M, Detlefsen S, Esposito I, Friess H, Gress TM, Habisch HJ, et al. StellaTUM: current consensus and discussion on pancreatic stellate cell research. Gut. 2012;61:172–178. - PMC - PubMed
    1. Bachem MG, Schneider E, Gross H, Weidenbach H, Schmid RM, Menke A, Siech M, Beger H, Grünert A, Adler G. Identification, culture, and characterization of pancreatic stellate cells in rats and humans. Gastroenterology. 1998;115:421–432. - PubMed
    1. Apte MV, Haber PS, Applegate TL, Norton ID, McCaughan GW, Korsten MA, Pirola RC, Wilson JS. Periacinar stellate shaped cells in rat pancreas: identification, isolation, and culture. Gut. 1998;43:128–133. - PMC - PubMed
    1. Haber PS, Keogh GW, Apte MV, Moran CS, Stewart NL, Crawford DH, Pirola RC, McCaughan GW, Ramm GA, Wilson JS. Activation of pancreatic stellate cells in human and experimental pancreatic fibrosis. Am J Pathol. 1999;155:1087–1095. - PMC - PubMed
    1. Apte MV, Park S, Phillips PA, Santucci N, Goldstein D, Kumar RK, Ramm GA, Buchler M, Friess H, McCarroll JA, et al. Desmoplastic reaction in pancreatic cancer: role of pancreatic stellate cells. Pancreas. 2004;29:179–187. - PubMed

Publication types

MeSH terms