Review
. 2011 Sep 21:2011:486512.
doi: 10.5402/2011/486512. eCollection 2011.

The epidemiology and demographics of slipped capital femoral epiphysis

Affiliations
Review

The epidemiology and demographics of slipped capital femoral epiphysis

Randall T Loder et al. ISRN Orthop. .

Abstract

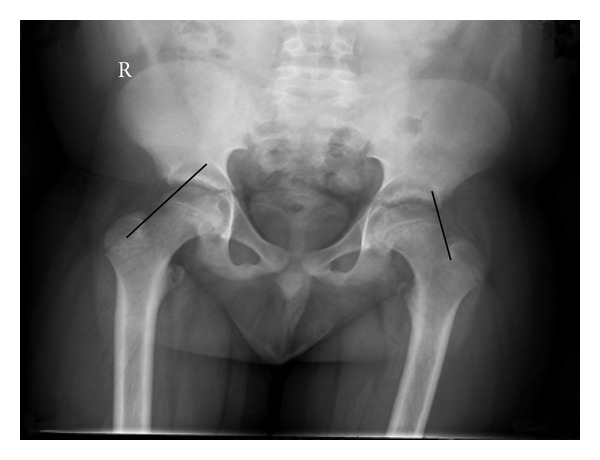
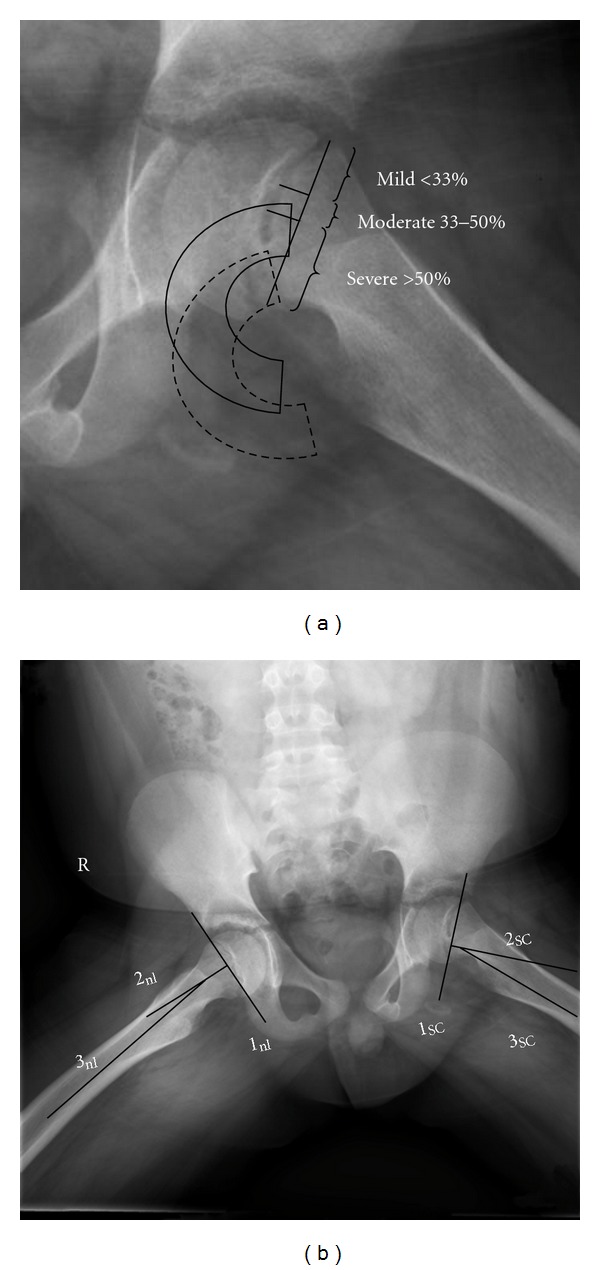
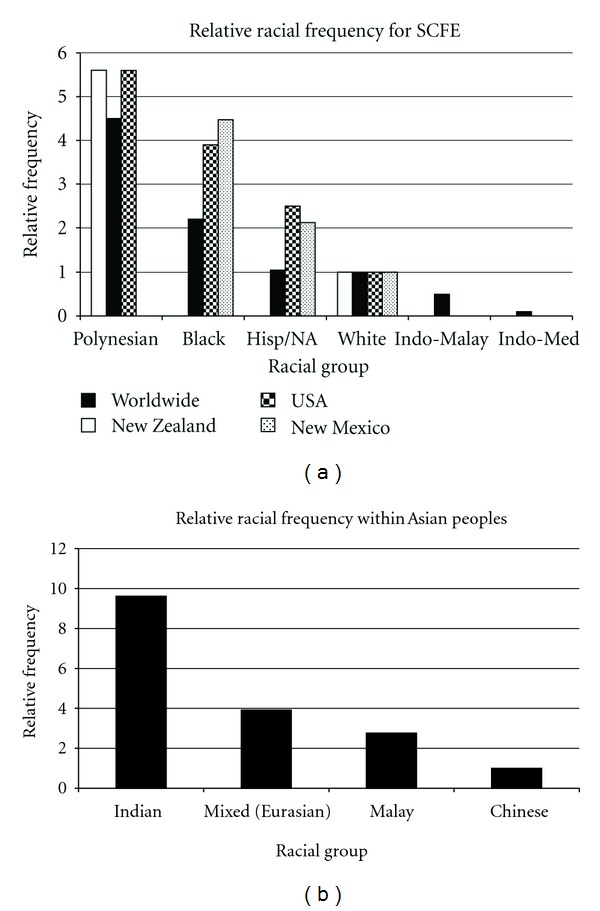
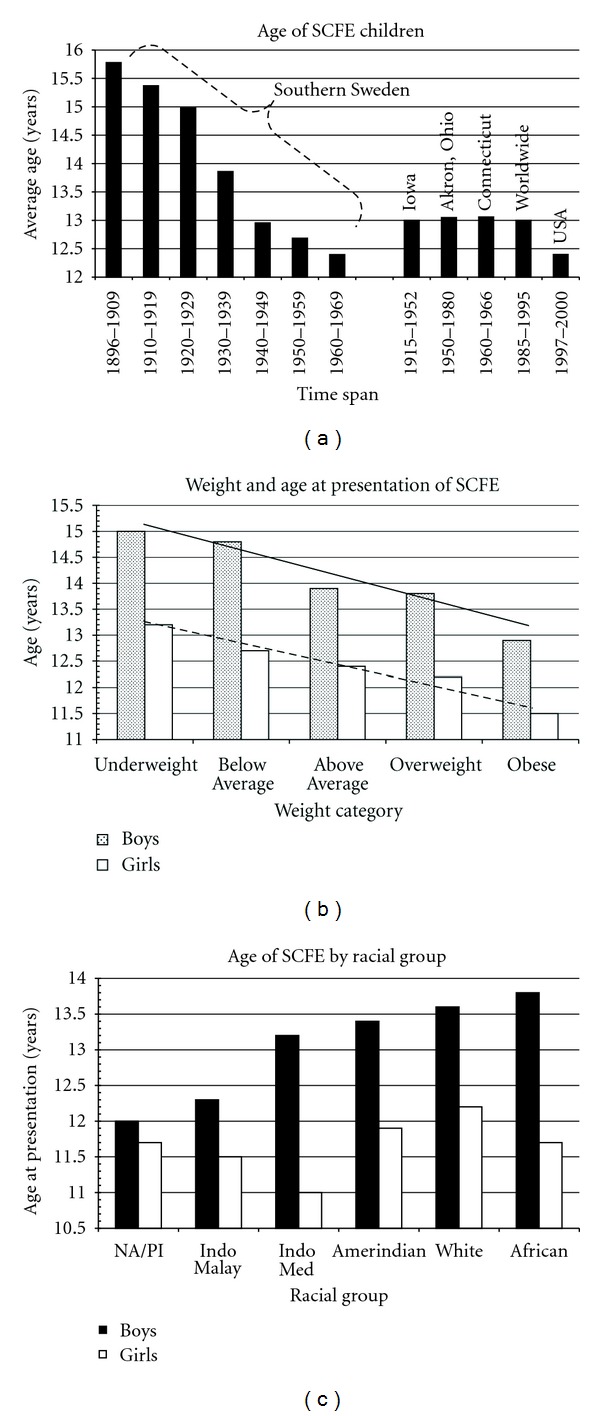
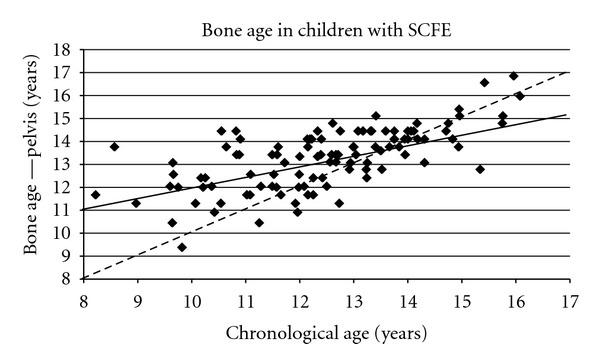
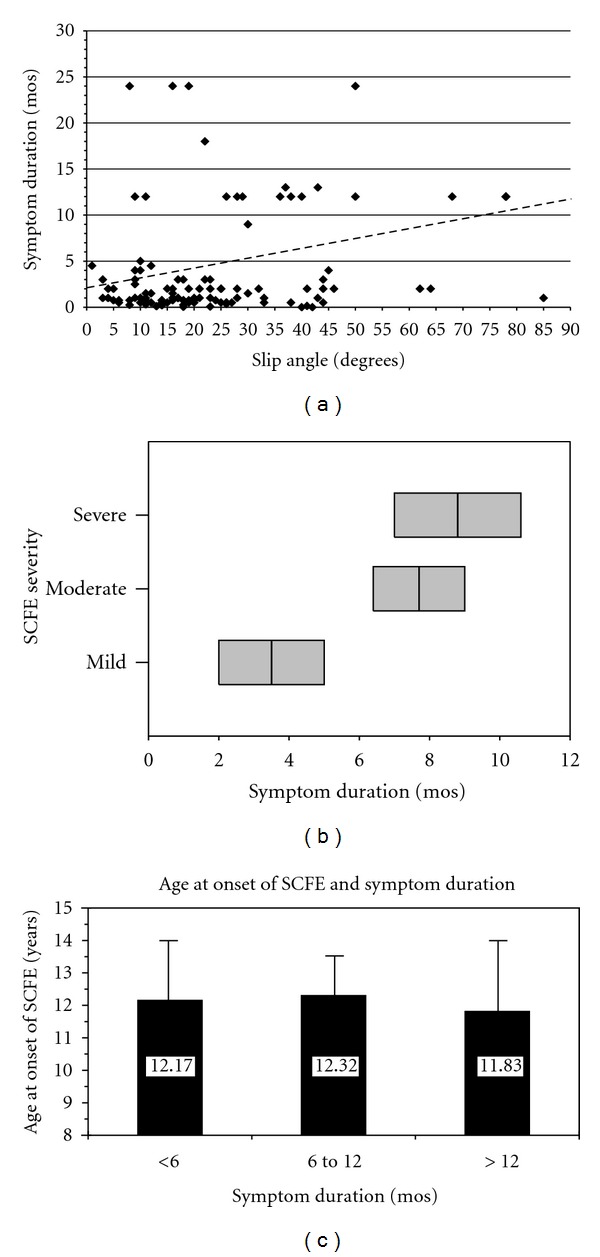
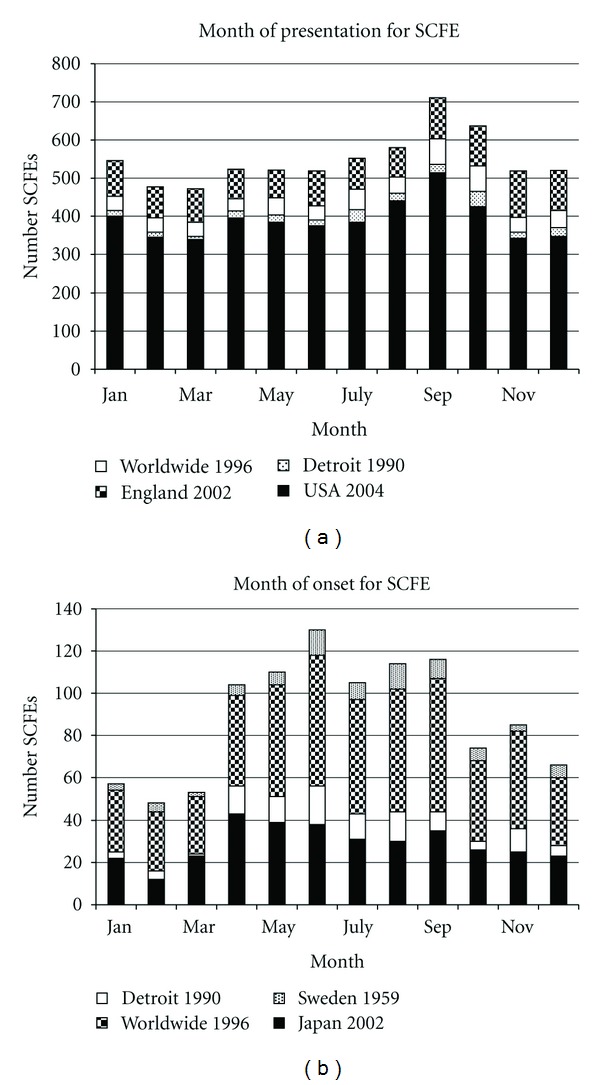
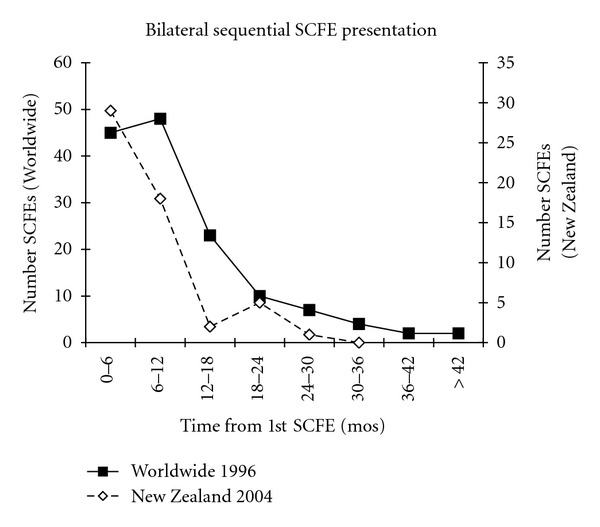
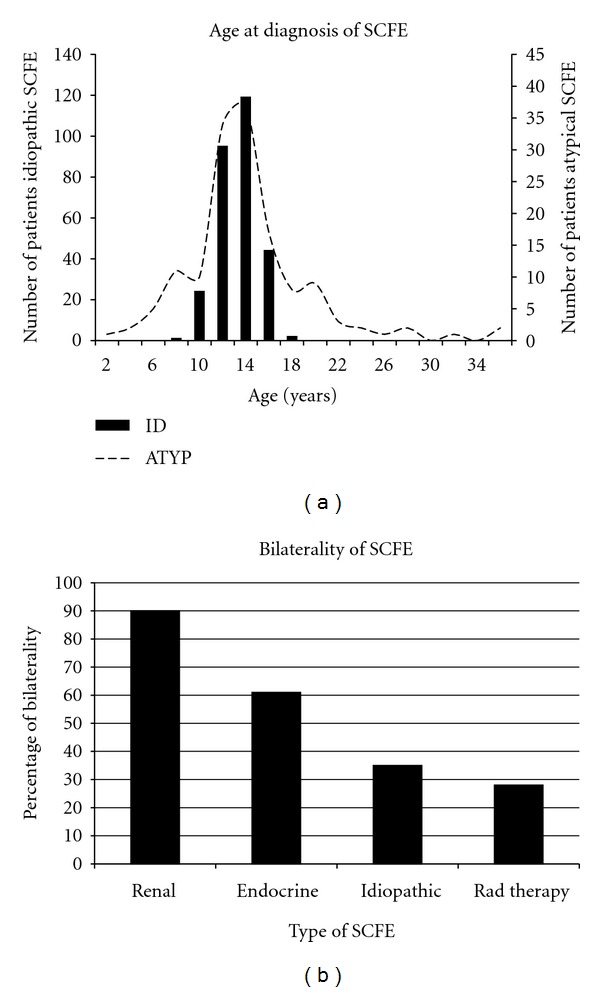
The etiology of slipped capital femoral epiphysis (SCFE) is unknown with many insights coming from epidemiologic/demographic information. A systematic medical literature review regarding SCFE was performed. The incidence is 0.33/100,000 to 24.58/100,000 children 8 to 15 years of age. The relative racial frequency, relative to Caucasians at 1.0, is 5.6 for Polynesians, 3.9 for Blacks, and 2.5 for Hispanics. The average age is 12.0 years for boys and 11.2 years for girls. The physiologic age when SCFE occurs is less variable than the chronologic age. The average symptom duration is 4 to 5 months. Most children are obese: >50% are >95th percentile weight for age with average BMI is 25-30 kg/m(2). The onset of SCFE is in the summer when north of 40°N. Bilaterality ranges from 18 to 50%. In children with bilateral involvement, 50-60% present with simultaneous SCFEs and those who present with a unilateral SCFE and subsequently develop a contralateral SCFE do so within 18 months. The age at presentation is younger for those who present with a unilateral SCFE and later develop a contralateral SCFE. The age-weight, age-height, and height test are useful to differentiate between an idiopathic and atypical SCFE.


Figures

Figure 1
Figure 1
A normal and abnormal epiphyseal line as described by Klein et al. [11] in an 11 year 6 month old boy with a left SCFE. In this anterior-posterior pelvis radiograph proximal prolongation of the superior neck line transects the epiphysis in the normal hip (right) but either lies flush with or does not transect the epiphysis in SCFE (left hip).
Figure 2
Figure 2
The two different methods of assessing SCFE severity. (a) The amount of displacement of the epiphysis relative to the metaphysis. A mild SCFE is defined as epiphyseal-metaphyseal displacement <1/3 the width of the metaphysis; a moderate SCFE 1/3–1/2; a severe SCFE as >1/2 [23]. In this case the SCFE is mild. The position of the epiphysis in a moderate SCFE is represented by the solid semicircle and in a severe SCFE by the hatched semicircle. (b) The lateral epiphyseal shaft angle measurement as described by Southwick [25] on the frog lateral radiograph. The frog lateral radiograph of the case in Figure 1 is shown. Both the normal hip (nl) and SCFE hip (SC) are measured. Line 1 is the line between the anterior and posterior physis, line 2 is a perpendicular to line 1, and the intersection of line 2 with an axial line along the shaft of the femur (line 3) is the epiphyseal shaft angle. The slip angle is calculated by subtracting the epiphyseal shaft angle of the normal hip from the slip side. Those less than 30 degrees are considered mild, between 30 and 50 degrees moderate, and greater than 50 degrees severe. The severity of the SCFE is the lateral epiphyseal shaft angle of the normal hip subtracted from the SCFE hip. In this example the slip angle is 25°–10° or 15°.
Figure 3
Figure 3
(a) Relative racial frequencies of SCFE normalized to Caucasian children. The New Zealand data is from [29], worldwide data from Loder [30], USA data from Lehmann et al. [31], and New Mexico data from Benson et al. [32]. (b) Relative racial frequencies of SCFE within the Indo-Malay and Indo-Mediterranean groups, normalized to Chinese children. Data from [33] was used to calculate the relative racial frequencies using previously described methods [30].
Figure 4
Figure 4
(a) The changing age at diagnosis of children with SCFE over the last century. The southern Sweden data is from [34]; the Iowa data is from [26]; the Akron, Ohio data is from [35]; the worldwide data is from Loder [30]; the USA data from Lehmann et al. [31]. (b) The average age at presentation of children with SCFE by weight category for both girls and boys. The average age follows a linear with the weight category (WC) for both the boys (solid black line) (age = 12.5−0.52 WC, r 2 = 0.94, P = 0.006) and girls (hatched black line) (age = 11.2−0.39 WC, r 2 = 0.96, P = 0.003) {WC of 5 = obese class, WC of 4 = overweight class, WC of 3 = above average class, WC of 2 = below average class, and WC of 1 = underweight class}. Data from Loder [30]. (c) The average age by racial group for girls and boys with SCFE. NA/PI: Native Australian/Polynesian, data from Loder [30].
Figure 5
Figure 5
The pelvis bone age (Oxford score converted into years) as a function of chronologic age in 108 children with SCFE. The observed pelvis bone age is represented by the solid line, and is represented by the equation Pelvis Bone Age = 6.95 + 0.51 (Chronologic Age), r 2 = 0.47, P < 10−6. The dotted line represents what would be found if the pelvis bone age and chronologic age were the same. The slope of the linear correlation for the actual pelvis bone age, 0.51, is 1/2 that if the bone and chronologic ages were equal, supporting the concept of the narrow bone age window for proximal epiphyseal slipping, data from Loder et al. [56].
Figure 6
Figure 6
(a) Symptom duration as a function of slip severity (lateral epiphyseal shaft angle) in 254 stable SCFEs. The best fit line is represented by the dotted line: symptom duration = 2.16 + 0.106 (slip angle), (P < 0.0001, r 2 = 0.084), where the slip angle is expressed in degrees and the symptom duration in months. Data from Loder et al. [46]. (b) Average symptom duration in months (middle black line in the gray box) ± one standard deviation (entire gray box) for mild, moderate, and severe stable SCFEs, data from Loder et al. [46]. (c) Categories of symptom duration in months (solid column) + one standard deviation (error bar) and age at onset of the SCFE defined as age at diagnosis minus symptom duration. There was no statistically significant difference in the age at onset for those children with different categories of symptom duration (ANOVA2, 258, F = 0.56, P = 0.57), indicating a small age window at which the SCFE begins. The average age for each symptom duration group is noted, data from Loder et al. [46].
Figure 7
Figure 7
(a) Seasonal variation in the month of presentation of children with SCFE when north of the 40° North latitude. The data for England 2002 are from Maffulli and Douglas [58], worldwide 1996 from Loder [59], Detroit 1990 from Loder et al. [60], and USA 2004 from Brown [61]. Note the peak in September and October. (b) Seasonal variation in the month of onset of children with SCFE when north of the 40° North latitude. The data for Sweden 1959 are from Andrén and Borgström [62], worldwide 1996 from Loder [59], Detroit 1990 from Loder et al. [60], and Japan 2002 from Noguchi and Sakamaki [38]. Note the peak in June, ~3 to 4 months before the peak for presentation in (a).
Figure 8
Figure 8
The time between the diagnosis of the 1st and 2nd SCFE of children with sequential bilateral SCFEs. The number of bilateral SCFEs for every 6 month time period from the time of the 1st SCFE is shown. The worldwide data are from Loder [30], and New Zealand data from Stott and Bidwell [29].
Figure 9
Figure 9
(a) A histogram showing the age at diagnosis of SCFE. Note the narrow age range for children with idiopathic SCFE (92% 10–16 years of age), with a broader range for children with atypical SCFEs (those associated with renal failure, radiation therapy, or endocrinopathy). Data from the study of Loder and Greenfield [108]. (b) Frequency of bilaterality amongst different types of SCFE, data from Loder and Greenfield [108].

References

    1. Schein AJ. Acute severe slipped capital femoral epiphysis. Clinical Orthopaedics and Related Research. 1967;51:151–166. - PubMed
    1. Segal LS, Weitzel PP, Davidson RS. Valgus slipped capital femoral epiphysis: fact or fiction? Clinical Orthopaedics and Related Research. 1996;(322):91–98. - PubMed
    1. Loder RT, O’Donnell PW, Didelot WP, Kayes KJ. Valgus slipped capital femoral epiphysis. Journal of Pediatric Orthopaedics. 2006;26(5):594–600. - PubMed
    1. Yngve DA, Moulton DL, Evans EB. Valgus slipped capital femoral epiphysis. Journal of Pediatric Orthopaedics B. 2005;14(3):172–176. - PubMed
    1. Loder RT, Wittenberg B, DeSilva G. Slipped capital femoral epiphysis associated with endocrine disorders. Journal of Pediatric Orthopaedics. 1995;15(3):349–356. - PubMed

LinkOut - more resources