. 2014 Jun 30:5:4246.
doi: 10.1038/ncomms5246.

Activity-dependent facilitation of Synaptojanin and synaptic vesicle recycling by the Minibrain kinase

Affiliations

Activity-dependent facilitation of Synaptojanin and synaptic vesicle recycling by the Minibrain kinase

Chun-Kan Chen et al. Nat Commun. .

Abstract

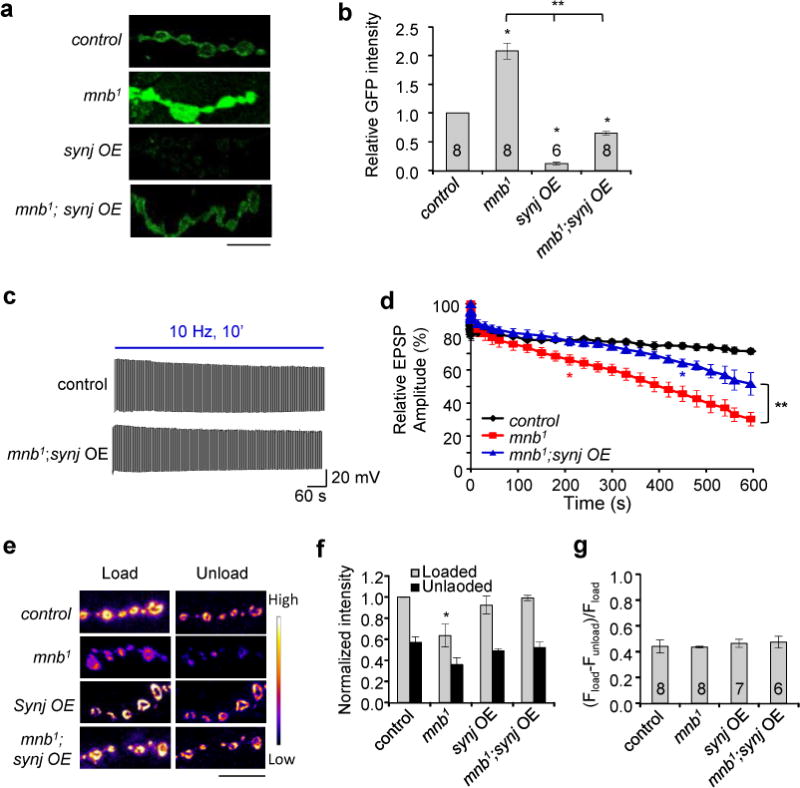
Phosphorylation has emerged as a crucial regulatory mechanism in the nervous system to integrate the dynamic signalling required for proper synaptic development, function and plasticity, particularly during changes in neuronal activity. Here we present evidence that Minibrain (Mnb; also known as Dyrk1A), a serine/threonine kinase implicated in autism spectrum disorder and Down syndrome, is required presynaptically for normal synaptic growth and rapid synaptic vesicle endocytosis at the Drosophila neuromuscular junction (NMJ). We find that Mnb-dependent phosphorylation of Synaptojanin (Synj) is required, in vivo, for complex endocytic protein interactions and to enhance Synj activity. Neuronal stimulation drives Mnb mobilization to endocytic zones and triggers Mnb-dependent phosphorylation of Synj. Our data identify Mnb as a synaptic kinase that promotes efficient synaptic vesicle recycling by dynamically calibrating Synj function at the Drosophila NMJ, and in turn endocytic capacity, to adapt to conditions of high synaptic activity.


Figures

Figure 1
Figure 1. Mnb is found in the presynaptic terminals of Drosophila neuromuscular junction
(a) Schema of predicted mnb isoforms. Orange boxes indicate translated region and gray boxes show untranslated mRNA. Green lines and inverse triangles indicate mutant alleles. * indicates ATP binding site in the kinase domain (KD). Blue line indicates region used to generate MNB antibody (Ab). (b) Representative Western blot showing enrichment of Mnb isoforms in the larval brain and adult head extracts. “Whole” indicates protein extracts prepared from the whole animal during either larval or adult stage. * indicates to a band at 60 KD that does not correspond to the size of any known Mnb and hence is either a non-specific signal or a currently unidentified Mnb isoform. Lower blot shows DB71 stained nitrocellulose membrane indicating comparable amount of total protein (10 μg) loaded in each lane. (c) 3rd instar NMJ of muscle 6/7 at A2 immunostained by antibody that recognizes MNB or with antibody that had been pre-absorbed with purified immunizing Mnb protein. Mnb colocalizes with HRP but not Dlg, indicating presence in the presynaptic terminal. Scale bar = 10 μm. (d) Image of a single bouton and the intensity plot profile for each antibody across the bouton (dotted white line). Mnb staining is confined within the boundaries of HRP staining, and is therefore presynaptic. Scale bar = 2 μm. (e) Image of a single bouton stained with Mnb, Endo, and BRP to show colocalization of Mnb with subdomains of Endo in the periactive zone. Mnb did not colocalize with BRP. Scale bar = 2 μm. (f) Levels of Mnb staining within the NMJ of third instar larvae of the indicated genotype. Scale bar = 10 μm. Sample numbers are indicated in the graph. * p < 0.05 compared to control. All values indicate mean ± SEM.
Figure 2
Figure 2. Mnb regulates synaptic growth
(a) Muscle 6/7 NMJ at A2 stained by HRP. Lower panels show magnified images of the white boxed region. Scale bar = 10 μm. (b) Number of boutons normalized to muscle surface area (MSA). (c) Average Type Ib bouton area. * indicates p <0.05 compared to control. Sample values are indicated in the bars. All values are mean ± SEM.
Figure 3
Figure 3. Mnb is required for reliable endocytosis
(a) Representative mEPSP. (b) Average mEPSP amplitude. Sample values are indicated in the graph. (c) Representative evoked EPSP and (d) average evoked EPSP. (e) EPSP recordings during 10 Hz Stimulation for 10 min. (f) Relative EPSP amplitude plotted over time for the indicated genotypes. n = 6 for each genotype. * marks p < 0.05 at the indicated time and beyond compared to control. (g) Images of NMJs after FM1-43 loading and unloading. Scale bar = 10 μm. (h) FM1-43 dye loading and unloading intensity. (i) Quantification of FM1-43 signal removed during unloading normalized to amount of loading. For h and i, n is indicated in the bar graph in (i), * indicates p < 0.05 compared to control. All values represent mean ± SEM.
Figure 4
Figure 4. Mnb binds to and phosphorylates Synj both in vitro and in vivo
(a) Immunoprecipitation (IP) experiment using flies overexpressing Synj tagged with HA reveals that Synj interacts with Mnb-F. Control: wildtype flies without Synj-HA overexpression. (b) Image of an individual bouton stained with Mnb and HA antibodies. Mnb colocalizes with Synj-HA in the presynaptic terminal of flies overexpressing HA tagged Synj (highlighted by white pixels). Scale bar = 2 μm. (c) Alkaline phosphatase (AP) treatment shows that the p-Synj antibody has significantly greater affinity for phospho-Synj. (d) IP done using Synj-1 antibody followed by AP treatment reveals that Synj-1 can also detect both phosphorylated and non-phosphorylated Synj. “- control” indicates parallel IP performed using IgG as negative control instead of Synj antibody. (e) Incubation of immunoprecipitated Synj in the presence and absence of AP and Mnb. pre-treatment of Mnb enhanced Synj phosphorylation as revealed by p-Synj antibody. Lower graph shows quantification of relative p-Synj and Synj-1 signals in the indicated treatment conditions. n = 3, * indicates p < 0.05 as compared to control. (f) Staining of Synj in the 3rd instar NMJ done using p-Synj and Synj-1 antibodies for the indicated genotypes. mnb overexpression increased p-Synj staining in the synapse while Mnb reduction in mutants decreased the level of p-Synj. Scale bar = 10 μm. (g) Quantification of relative staining intensity for p-Synj and Synj-1 signals. n is indicated in the bar graph, * indicates p < 0.05 as compared to control. (h) IP done using dynamin antibody, and the levels of phospho-serine (p-Ser) and phospho-threonine (p-Thr) were determined using phospho-specific antibodies as indicated. (i) Quantification of relative levels of p-Ser and p-Thr after normalizing to the amount of dynamin in the IP. n = 3. All values represent mean ± SEM.
Figure 5
Figure 5. Mnb regulates endocytic protein interactions and enhances Synj 5′-phosphoinositol phosphatase activity
(a) Immunoprecipitation (IP) performed using Synj-1 antibody, (c) IP performed using dynamin antibody, and (e) IP done using Endo antibody followed by Western blots of the IP eluates done using the indicated antibodies. (b), (d), and (f) quantification of protein levels detected in the mnb1 IP eluate as compared to control. n = 3 independent experiment. (g) TLC showing conversion of BODIPY-PIP2 to BODIPY-PIP by Synj-HA immunoprecipitated from fly extracts with and without addition of purified Mnb protein. Lower panels show levels of phospho-Synj and total Synj as detected by p-Synj and Synj-1 antibodies, respectively. (h) Quantification of relative PIP to PIP2 level. n = 4 independent experiments. (i) PIP2 levels in the NMJ as measured by PLCδ1-PH-GFP for the indicated genotypes. Scale bar = 10 μm. (j) Quantification of PIP2 levels in the synapse. Lower Synj activity results in reduced conversion of PIP2 to PIP, and will hence have higher PIP2 levels detected by PLCδ1-PH-GFP in the synapse. Sample numbers are indicated in the bar graph. * indicates p < 0.05 for (b), (d), (f), (h), and (j) as compared to the respective control. All values are mean ± SEM.
Figure 6
Figure 6. Synaptic activity promotes Mnb-dependent Synj phosphorylation and activity enhancement
(a) Images of synaptic bouton triple-labeled for Endo, Mnb and BRP at rest and after stimulation with high K+ for 30 s. Colocalization is highlighted by white pixels. Scale bar = 2 μm. (b) Pearson’s correlation coefficient values showing colocalization between Mnb/Endo but not Mnb/BRP. Stimulation enhanced colocalization between Mnb and Endo. n = 5 independent experiment per condition. *indicates p <0.05 compared to unstimulated bouton. (c) Images of NMJs stained with p-Synj or Synj-1 antibodies at rest (unstim) and stimulated (stim) with high K+. Scale bar = 10 μm. (d) Quantification of the increase in p-Synj level after stimulation, normalized to total Synj level. Compared to control, mnb1 and mnb1/Df show a lower level of increase in phospho-Synj after stimulation. n is indicated in the bars. * indicates p < 0.05 compared to control. (e) TLC showing conversion of BODIPY-PIP2 to BODIPY-PIP by larval extract with and without stimulation with high K+. (f) Quantification of the increase in PIP2 conversion after stimulation. n = 3 independent experiments. * indicates p < 0.05 compared to control. All values represent mean ± SEM.
Figure 7
Figure 7. Upregulation of Synj rescues defective endocytosis in mnb1
(a) Representative images of PIP2 levels in the NMJ as measured by PLCδ1-PH-EGFP for the indicated genotypes. Scale bar = 10 μm. (b) Quantification of PIP2 levels. Synj overexpression in mnb1 has lower PI(4,5)P2 level than mnb1 in the synapse, suggesting a rescue of Synj activity. Sample numbers are indicated in the bars. * indicates p < 0.05 compared to control and ** p < 0.05 as indicated. (c) Representative EPSP traces during 10 Hz stimulation for the indicated genotypes. (d) Relative EPSP amplitude plotted over time for the indicated genotypes. n = 6 and * indicates p < 0.05 from the indicated time point and beyond as compared to control. ** p < 0.05 as compared to mnb1. (e) Images of NMJ after FM1-43 loading and unloading. Scale bar = 10 μm. (f) Relative FM1-43 loading and unloading intensity normalized to control. * p < 0.05 compared to control. (g) Quantification of FM1-43 signal removed during unloading normalized to amount of loading. For (f) and (g), n is indicated in the bar graph in (g). All values represent mean ± SEM.

Similar articles

Cited by

References

    1. Cousin MA, Tan TC, Robinson PJ. Protein phosphorylation is required for endocytosis in nerve terminals: potential role for the dephosphins dynamin I and synaptojanin, but not AP180 or amphiphysin. J Neurochem. 2001;76:105–116. - PubMed
    1. Slepnev VI, Ochoa GC, Butler MH, Grabs D, De Camilli P. Role of phosphorylation in regulation of the assembly of endocytic coat complexes. Science. 1998;281:821–824. - PubMed
    1. Greengard P, Valtorta F, Czernik AJ, Benfenati F. Synaptic vesicle phosphoproteins and regulation of synaptic function. Science. 1993;259:780–785. - PubMed
    1. Clayton EL, et al. Dynamin I phosphorylation by GSK3 controls activity-dependent bulk endocytosis of synaptic vesicles. Nat Neurosci. 2010;13:845–851. - PMC - PubMed
    1. Matta S, et al. LRRK2 controls an EndoA phosphorylation cycle in synaptic endocytosis. Neuron. 2012;75:1008–1021. - PubMed

Publication types

MeSH terms

LinkOut - more resources