

Evidence-based improvement of the National Trauma Triage Protocol: The Glasgow Coma Scale versus Glasgow Coma Scale motor subscale
- PMID: 24977762
- PMCID: PMC4620030
- DOI: 10.1097/TA.0000000000000280
Evidence-based improvement of the National Trauma Triage Protocol: The Glasgow Coma Scale versus Glasgow Coma Scale motor subscale
Abstract
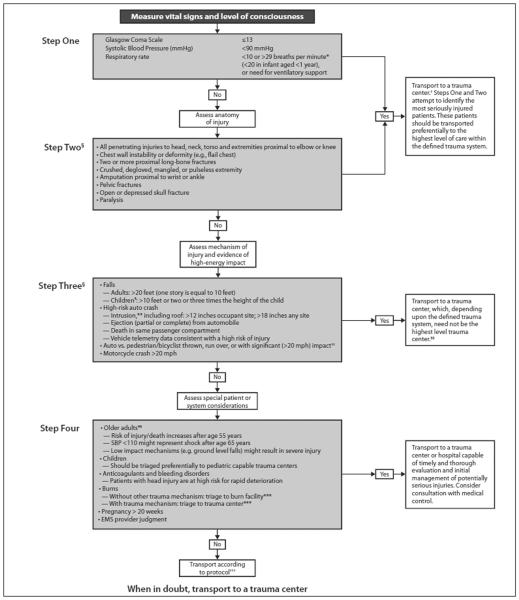
Background: Ideal triage uses simple criteria to identify severely injured patients. Glasgow Coma Scale motor (GCSm) may be easier for field use and was considered for the National Trauma Triage Protocol (NTTP). This study evaluated performance of the NTTP if GCSm is substituted for the current GCS score ≤ 13 criterion.
Methods: Subjects in the National Trauma Data Bank undergoing scene transport were included. Presence of NTTP physiologic (Step 1) and anatomic (Step 2) criteria was determined. GCSm score ≤ 5 was defined as a positive criterion. Trauma center need (TCN) was defined as Injury Severity Score (ISS) > 15, intensive care unit admission, urgent operation, or emergency department death. Test characteristics were calculated to predict TCN. Area under the curve was compared between GCSm and GCS scores, individually and within the NTTP. Logistic regression was used to determine the association of GCSm score ≤ 5 and GCS score ≤ 13 with TCN after adjusting for other triage criteria. Predicted versus actual TCN was compared.
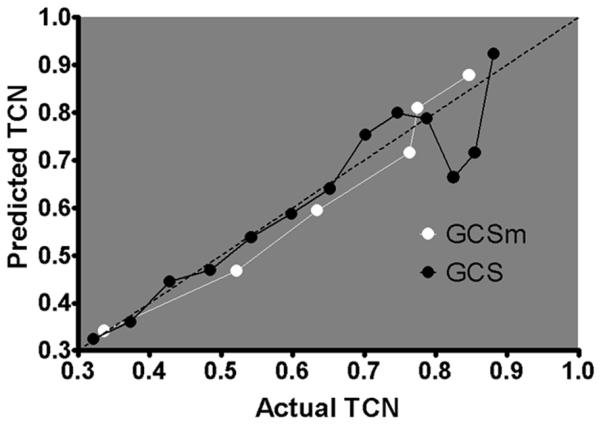
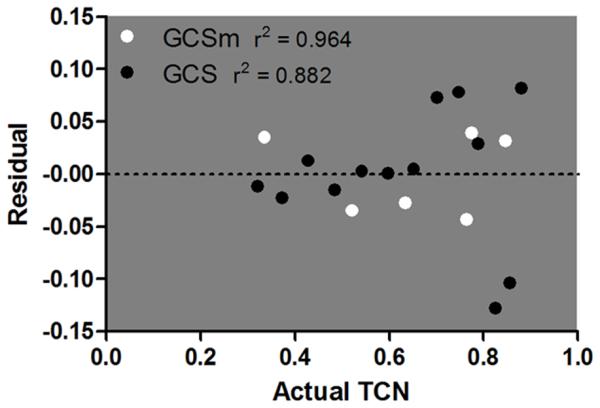
Results: There were 811,143 subjects. Sensitivity was lower (26.7% vs. 30.3%), specificity was higher (95.1% vs. 93.1%), and accuracy was similar (66.1% vs. 66.3%) for GCSm score ≤ 5 compared with GCS score ≤ 13. Incorporated into the NTTP Steps 1 + 2, GCSm score ≤ 5 traded sensitivity (60.4% vs. 62.1%) for specificity (67.1% vs. 65.7%) with similar accuracy (64.2% vs. 64.2%) to GCS score ≤ 13. There was no difference in the area under the curve between GCSm score ≤ 5 and GCS score ≤ 13 when incorporated into the NTTP Steps 1 + 2 (p = 0.10). GCSm score ≤ 5 had a stronger association with TCN (odds ratio, 3.37; 95% confidence interval, 3.27-3.48; p < 0.01) than GCS score ≤ 13 (odds ratio, 3.03; 95% confidence interval, 2.94-3.13; p < 0.01). GCSm had a better fit of predicted versus actual TCN than GCS at the lower end of the scales.
Conclusion: GCSm score ≤ 5 increases specificity at the expense of sensitivity compared with GCS score ≤ 13. When applied within the NTTP, there is no difference in discrimination between GCSm and GCS. GCSm score ≤ 5 is more strongly associated with TCN and better calibrated to predict TCN. Further study is warranted to explore replacing GCS score ≤ 13 with GCSm score ≤ 5 in the NTTP.
Level of evidence: Prognostic study, level III.
Figures
References
-
- Sasser SM, Hunt RC, Faul M, Sugerman D, Pearson WS, Dulski T, Wald MM, Jurkovich GJ, Newgard CD, Lerner EB, et al. Guidelines for field triage of injured patients: recommendations of the National Expert Panel on Field Triage, 2011. MMWR Recomm Rep. 2012;61:1–20. - PubMed
-
- Boyd CR, Tolson MA, Copes WS. Evaluating trauma care: the TRISS method. Trauma Score and the Injury Severity Score. J Trauma. 1987;27:370–378. - PubMed
-
- Champion HR, Sacco WJ, Copes WS, Gann DS, Gennarelli TA, Flanagan ME. A revision of the Trauma Score. J Trauma. 1989;29:623–629. - PubMed
-
- Teasdale G, Murray G, Parker L, Jennett B. Adding up the Glasgow Coma Score. Acta Neurochir Suppl (Wien) 1979;28:13–16. - PubMed
-
- Gill M, Windemuth R, Steele R, Green SM. A comparison of the Glasgow Coma Scale score to simplified alternative scores for the prediction of traumatic brain injury outcomes. Ann Emerg Med. 2005;45:37–42. - PubMed
Publication types
MeSH terms
Grants and funding
LinkOut - more resources
Full Text Sources
Other Literature Sources
Medical
Research Materials
