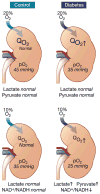
Phenotypic characteristics of diabetic kidney involvement
- PMID: 24978373
- PMCID: PMC4076684
- DOI: 10.1038/ki.2013.552
Phenotypic characteristics of diabetic kidney involvement
Abstract
Understanding phenotypic characteristics of the diabetic kidney is important for the development of therapies to prevent progression of diabetic nephropathy. In addition to glomerular hyperfiltration and kidney growth, major metabolic abnormalities characterize the diabetic kidney. Increased kidney oxygen consumption leads to cortical and medullary hypoxia in diabetes. Decreasing inspired oxygen to 10% reduces pO2, while oxygen consumption remains elevated, lactate increases, and redox potential decreases, but only in the diabetic kidney--a shift to Warburg metabolism.
Conflict of interest statement
Disclosure
There are no conflicts of interest or financial disclosures.
Figures

Comment on
-
High altitude may alter oxygen availability and renal metabolism in diabetics as measured by hyperpolarized [1-(13)C]pyruvate magnetic resonance imaging.Kidney Int. 2014 Jul;86(1):67-74. doi: 10.1038/ki.2013.504. Epub 2013 Dec 18. Kidney Int. 2014. PMID: 24352155
References
-
- Parker TF, 3rd, Blantz R, Hostetter T, et al. The chronic kidney disease initiative. J Am Soc Nephrol. 2004;15:708–16. - PubMed
-
- Fine LG, Bandyopadhay D, Norman JT. Is there a common mechanism for the progression of different types of renal diseases other than proteinuria? Towards the unifying theme of chronic hypoxia. Kidney Int Suppl. 2000;75:S22–6. - PubMed
-
- Nath KA, Croatt AJ, Hostetter TH. Oxygen consumption and oxidant stress in surviving nephrons. Am J Physiol. 1990;258:F1354–1362. - PubMed
-
- Manotham K, Tanaka T, Matsumoto M, et al. Evidence of tubular hypoxia in the early phase in the remnant kidney model. J Am Soc Nephrol. 2004;15:1277–1288. - PubMed
Publication types
MeSH terms
Grants and funding
LinkOut - more resources
Full Text Sources
Other Literature Sources
Medical

