

Uniting statistical and individual-based approaches for animal movement modelling
- PMID: 24979047
- PMCID: PMC4076191
- DOI: 10.1371/journal.pone.0099938
Uniting statistical and individual-based approaches for animal movement modelling
Abstract
The dynamic nature of their internal states and the environment directly shape animals' spatial behaviours and give rise to emergent properties at broader scales in natural systems. However, integrating these dynamic features into habitat selection studies remains challenging, due to practically impossible field work to access internal states and the inability of current statistical models to produce dynamic outputs. To address these issues, we developed a robust method, which combines statistical and individual-based modelling. Using a statistical technique for forward modelling of the IBM has the advantage of being faster for parameterization than a pure inverse modelling technique and allows for robust selection of parameters. Using GPS locations from caribou monitored in Québec, caribou movements were modelled based on generative mechanisms accounting for dynamic variables at a low level of emergence. These variables were accessed by replicating real individuals' movements in parallel sub-models, and movement parameters were then empirically parameterized using Step Selection Functions. The final IBM model was validated using both k-fold cross-validation and emergent patterns validation and was tested for two different scenarios, with varying hardwood encroachment. Our results highlighted a functional response in habitat selection, which suggests that our method was able to capture the complexity of the natural system, and adequately provided projections on future possible states of the system in response to different management plans. This is especially relevant for testing the long-term impact of scenarios corresponding to environmental configurations that have yet to be observed in real systems.
Conflict of interest statement
Figures


 -value vectors for real and simulated individuals for the IBM with the different step selection methods based on the SSF scores of the steps (the best, the
  and the roulette wheel methods) and a simple CRW (which selects any step with equal probability): (a) R is computed over all
  -values, (b) R is computed over
  -values whose 95% confidence intervals exclude 0, (c) rs is computed over all
  -values, and (d) rs is computed over
  -values whose 95% confidence intervals exclude 0. A high correlation coefficient means that simulated individuals select land cover types in a similar fashion to real individuals, hence validating the model. A generalized linear mixed model showed that the best and
  methods performed better than the
  method and the CRW (R on all
  -values: best, t = 1.79, p-value
 0.0738 -
  , t = 5.72, p-value
 0.0001 - CRW, t = −0.55, p-value
 0.5836; R on
  -values whose 95% confidence intervals excluded 0: best, t = 11.33, p-value
 0.0001 -
  , t = 12.55, p-value
 0.0001 - CRW, t = −0.76, p-value
 0.4492; rs on all
  -values: best, t = 9.12, p-value
 0.0001 -
  , t = 11.80, p-value
 0.0001 - CRW, t = −0.56, p-value
 0.5782; rs on
  -values whose 95% confidence intervals excluded 0: best, t = 11.02, p-value
 0.0001 -
  , t = 11.66, p-value
 0.0001 - CRW, t = −1.35, p-value
 0.1757).
 and the roulette wheel methods) and a simple CRW (which selects any step with equal probability). The best and
  methods produced slightly smaller home ranges than the roulette wheel one and the CRW (Kruskal-Wallis test:
  = 26.72, df = 3, p-value
 0.0001).
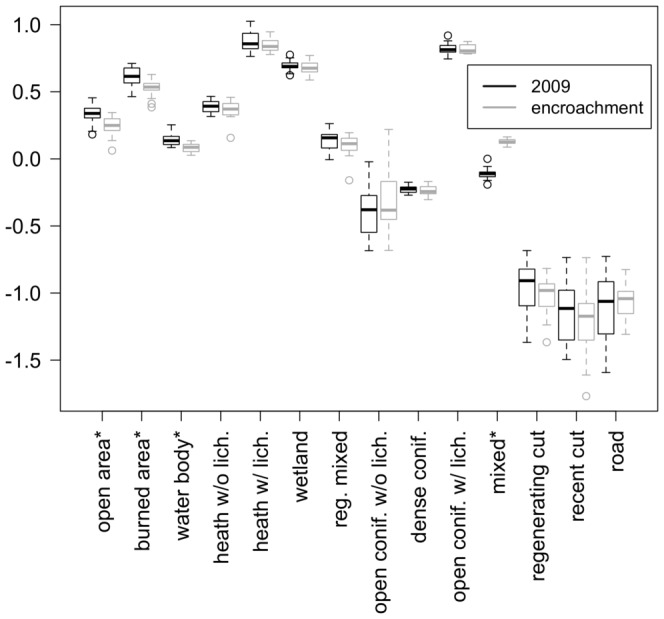
 -values for the 15 landcover types: 1 = fixed open areas, 2 = burned area, 3 = water, 4 = heath without lichen, 5 = heath with lichen, 6 = wetlands, 7 = regenerating mixed forest, 8 = regenerating coniferous stand, 9 = open conifer stand without lichen, 10 = dense mature conifer forest, 11 = open conifer stand with lichen, 12 = mixed/deciduous forest, 13 = regenerating cut, 14 = recent cut, 15 = road. Open conifer stand without lichen is the class of reference and does not appear in the graph. Asterisks indicate landcover types for which a Mann-Whitney test between distributions produced a p-value
 0.05.
0.05.
References
-
- Johnson C, Seip D, Boyce M (2004) A quantitative approach to conservation planning: using resource selection functions to map the distribution of mountain caribou at multiple spatial scales. Ecology 41: 238–251.
-
- Wiegand T, Knauer F, Kaczensky P, Naves J (2004) Expansion of brown bears (Ursus arctos) into the eastern Alps: a spatially explicit population model. Biodiversity and Conservation 13: 79–114.
-
- Brown G, Rettie W, Brooks R, Mallory F (2007) Predicting the impacts of forest management on woodland caribou habitat suitability in black spruce boreal forest. Forest Ecology and Management 245: 137–147.
Publication types
MeSH terms
LinkOut - more resources
Full Text Sources
Other Literature Sources
