. 2014 Nov;121(5):1056-67.
doi: 10.1097/ALN.0000000000000360.

Modeling individual recovery after peripheral nerve injury in rats and the effects of parturition

Affiliations

Modeling individual recovery after peripheral nerve injury in rats and the effects of parturition

Carol A Aschenbrenner et al. Anesthesiology. 2014 Nov.

Abstract

Background: Recovery from pain after surgery exhibits large interindividual variability, with very slow recovery equated to chronic pain. Surgical injury in the postpartum period modestly increases initial recovery after major nerve injury. In this study, the authors use a nerve injury that recovers over 2 to 3 months and apply growth curve modeling to further understand the effect of the postpartum period on speed of recovery.

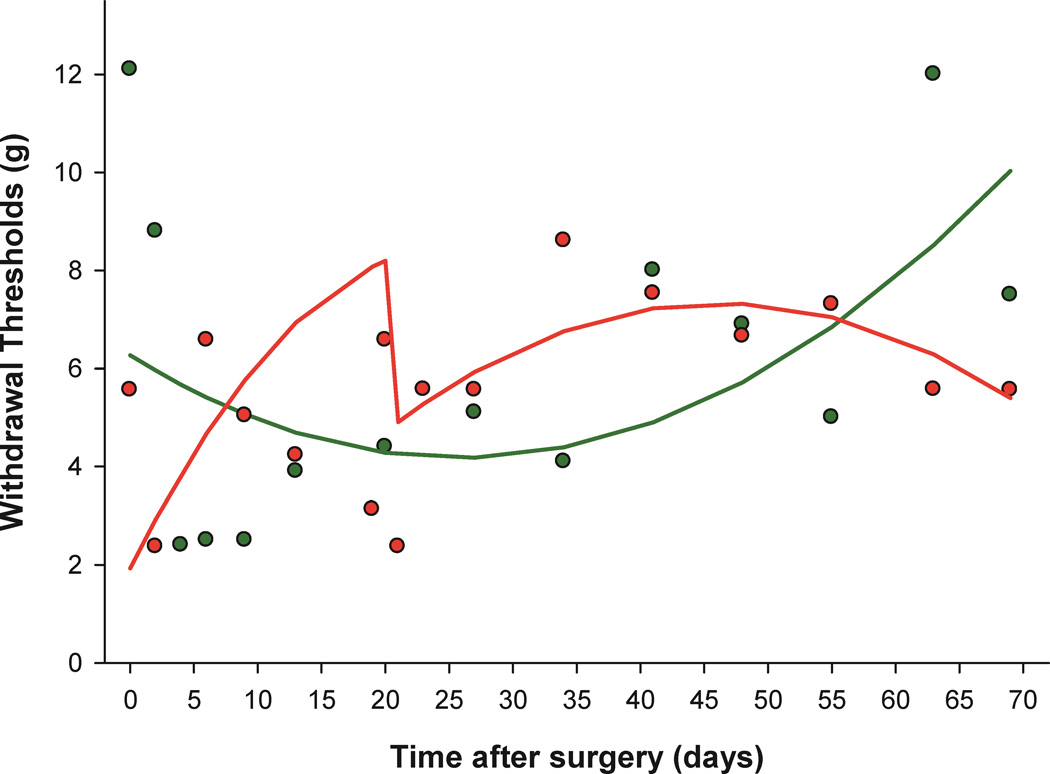
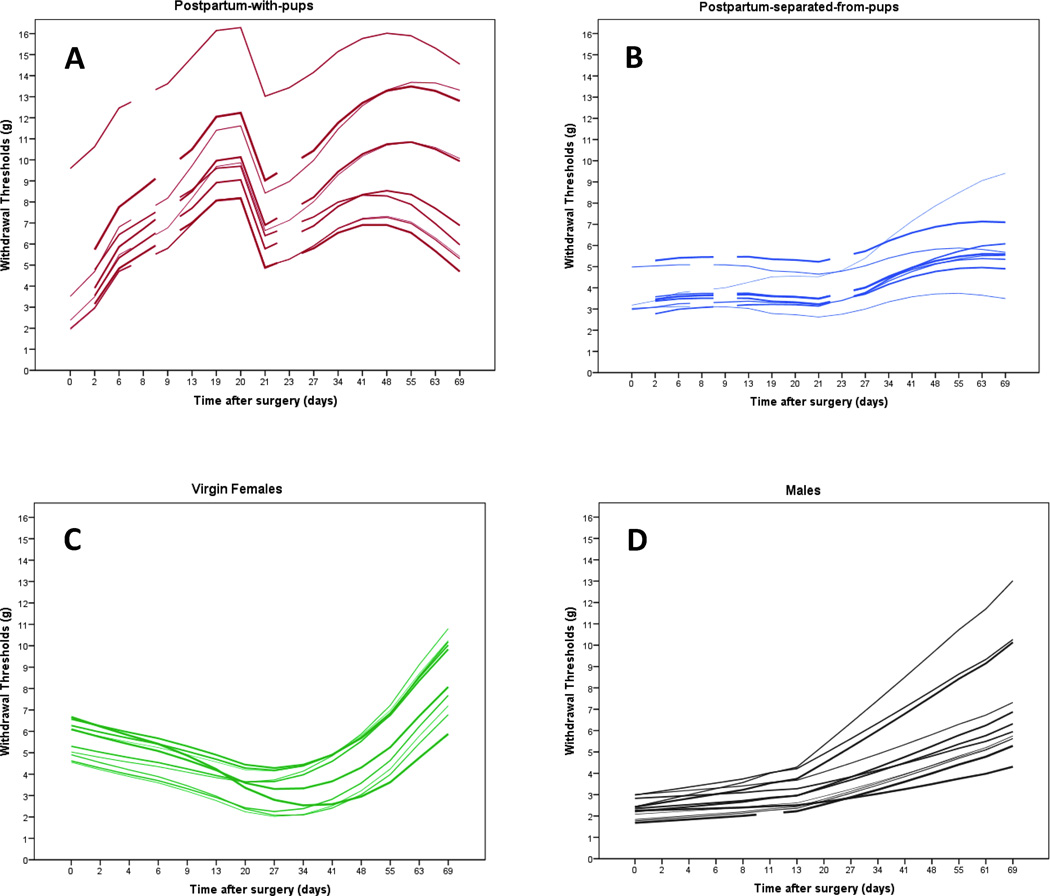
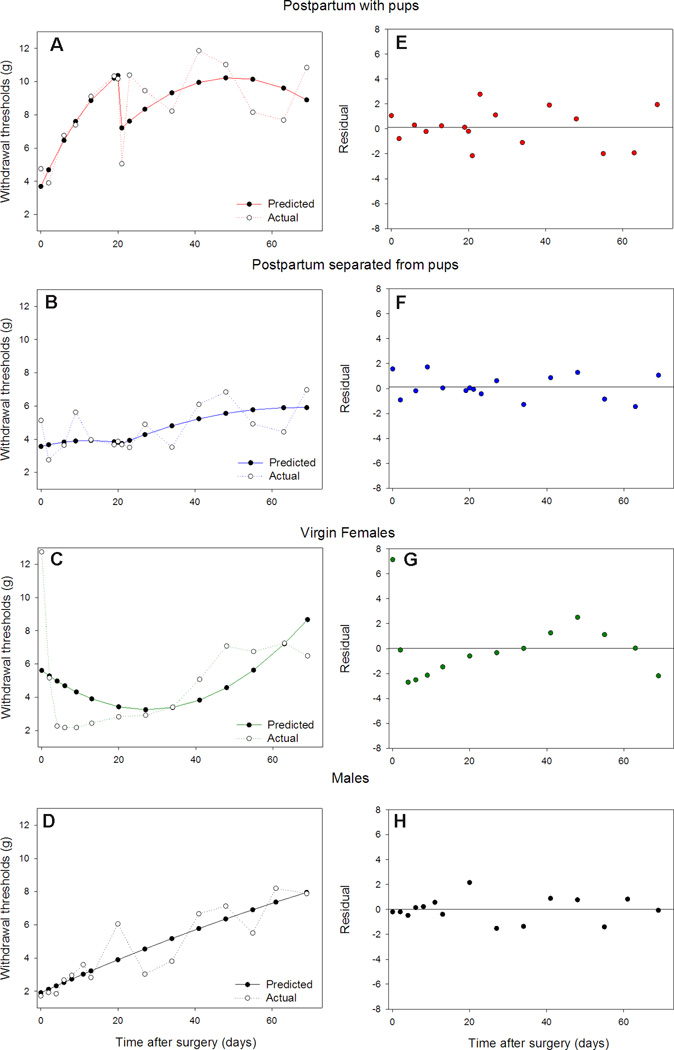
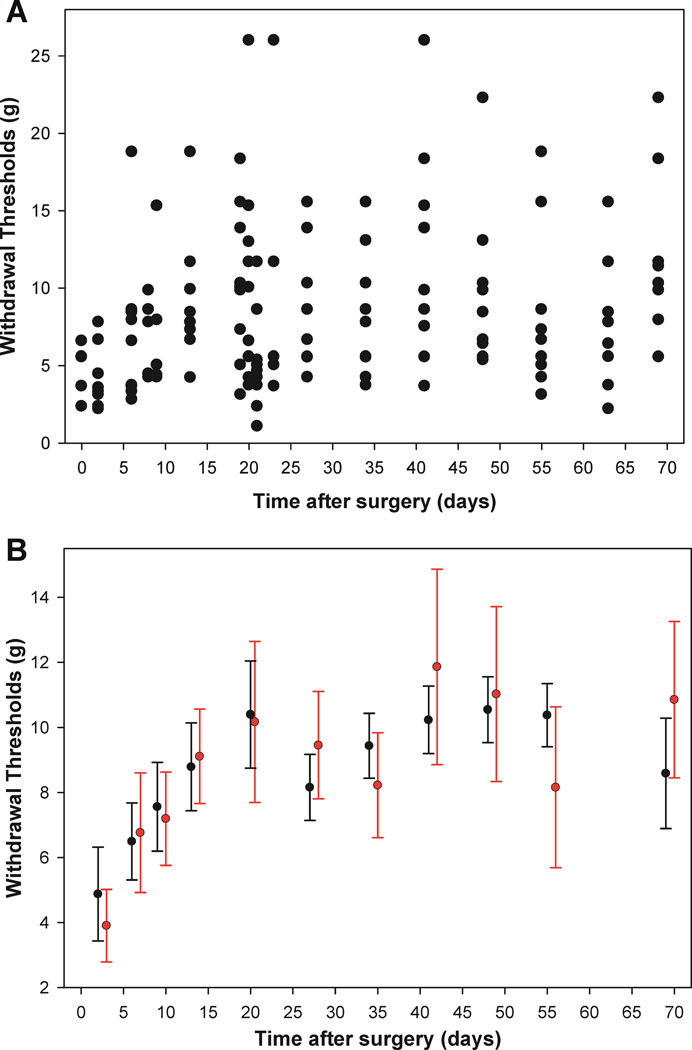
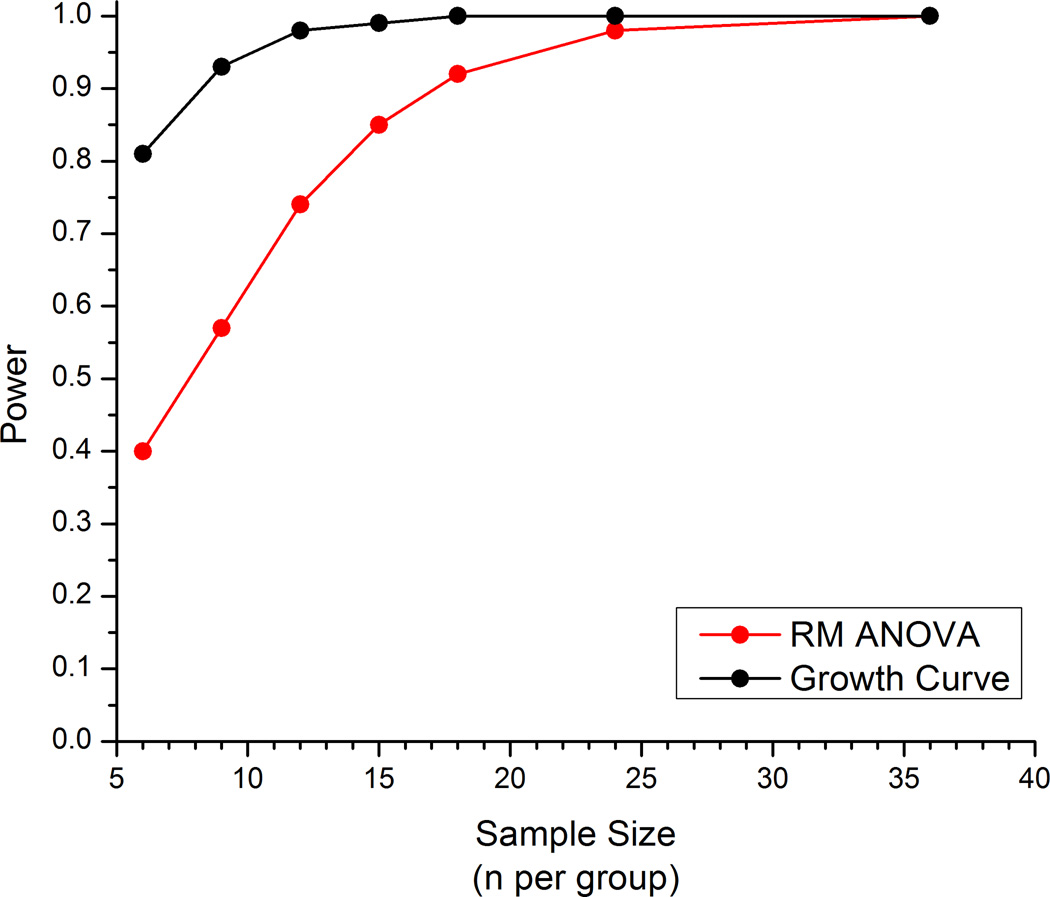
Methods: Withdrawal threshold to mechanical stimulus on the hind paw was determined in 41 Sprague-Dawley rats before and for 10 weeks after partial spinal nerve ligation. Age-matched male and female rats and postpartum females with pups or those separated from pups at delivery were studied. Growth curve analyses were applied to model recovery after surgery despite varying timing of measurements across groups and missing data, and these results were compared with those of two-way repeated-measures ANOVA.

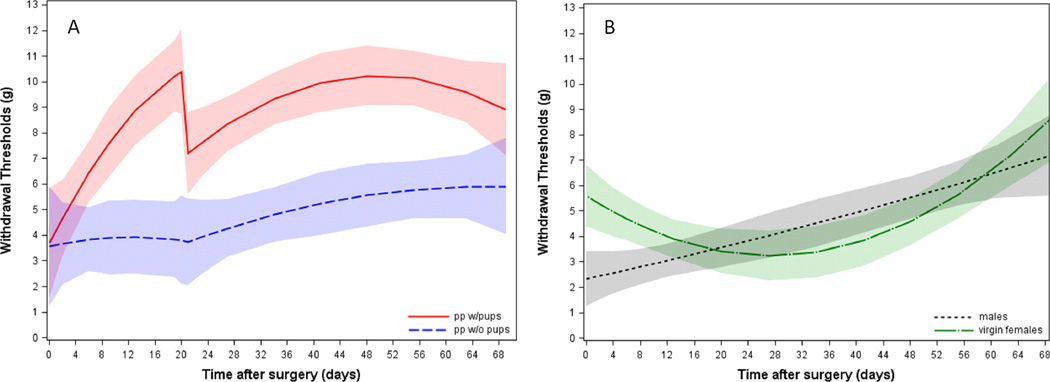
Results: The recovery time course was similar between males and females. In contrast, recovery was hastened in the postpartum groups, with nonoverlapping 95% CIs of modeled trajectories between days 6 and 66 after surgery. CIs were more precise at most time periods with growth curve analysis compared with ANOVA.

Conclusions: The authors describe a method of analysis to quantify recovery from hypersensitivity after surgery in rats with several distinct advantages over traditionally used methods. Study results do not support a sex difference in trajectory of recovery but confirm and extend previous observations that injury at the time of obstetric delivery is associated with an abnormally rapid recovery.


Figures

Figure 1
Figure 1
Withdrawal threshold measurements for two representative subjects from the postpartum-with-pups (red) and virgin females (green) groups exemplifying missing data and differences in timing of measurements. At several time points observations are available from one animal and not the other. The same two representative subject predicted trajectories are overlayed to show model fit.
Figure 2
Figure 2
Postpartum and Non-postpartum Group Trajectories. Lines represent predicted values and shaded areas represent 95% confidence intervals of modeled trajectories. A) Modeled trajectory when partial spinal nerve ligation is performed on Day 0 in postpartum-with-pups (pp w/pups; red) or postpartum-separated-from pups (pp w/o pups; blue) animals. B) Modeled trajectory when partial spinal nerve ligation is performed on Day 0 in virgin females (green) or male (gray) rats.
Figure 3
Figure 3
Spaghetti plots demonstrating individual subject variability. Large degrees of individual differences were observed with a range of intercepts and slopes. Individual subject model predicted trajectories are shown for A)the postpartum-with-pups group;B)the postpartum-separated-from-pups group;C)the virgin females group; andD)the males group.
Figure 4
Figure 4
A, B, C, D) Group trajectories (predicted vs. actual withdrawal thresholds) and residual plots. The solid lines represent the model predicted withdrawal thresholdswhile the dotted lines plot the actual group mean withdrawal threshold by time point forA) the postpartum-with-pups group; B) the postpartum-separated-from-pups group; C) the virgin females group; and D) the males group.E, F, G, H) The dotsrepresent the residual variance by day resulting from the model with a reference line for zero residual variance for E) the postpartum-with-pups group; F) the postpartum-separated-from-pups group; G) the virgin females group; and H) the males group.
Figure 5
Figure 5
A)Scatterplot of actual withdrawal thresholds for the postpartum-with-pups group only demonstrates the large degree of variability observed across subjects. B) The predicted withdrawal thresholds with 95% confidence intervals for both the growth curve model (black) and two-way RM ANOVA model (red) for the postpartum-with-pups group only. The reduction in confidence interval width in the growth curve model illustrates greater precision in the estimates than in the two-way RM ANOVA model.
Figure 6
Figure 6
Plot of statistical power (y-axis) of RM ANOVA model (red) and growth curve model (black) obtained from analyses of simulated data by sample size (n per group) (x-axis). The two simulations estimated two different parameters from the approaches and are not different estimates of the same construct. In the ANOVA simulations, the group*time interaction effect was examined, while a model fit was the focus of the growth curve simulations.

References

    1. Eisenach JC, Pan P, Smiley RM, Lavand'homme P, Landau R, Houle TT. Resolution of pain after childbirth. Anesthesiology. 2013;118:143–151. - PMC - PubMed
    1. Gutierrez S, Liu B, Hayashida K, Houle TT, Eisenach JC. Reversal of peripheral nerve injury-induced hypersensitivity in the postpartum period: Role of spinal oxytocin. Anesthesiology. 2013;118:152–159. - PMC - PubMed
    1. Vickers AJ. Parametric versus non-parametric statistics in the analysis of randomized trials with non-normally distributed data. BMC Med Res Methodol. 2005;5:35. - PMC - PubMed
    1. Singer J. Using SAS PROC MIXED to fit multilevel models, hierarchical models, and individual growth models. J Educ Behav Stat. 1998;24:323–355.
    1. Zautra A, Smith B, Affleck G, Tennen H. Examinations of chronic pain and affect relationships: Applications of a dynamic model of affect. J Consult Clin Psychol. 2001;69:786–795. - PubMed