. 2014 Jun 30:5:4242.
doi: 10.1038/ncomms5242.

FOXO1 inhibition yields functional insulin-producing cells in human gut organoid cultures

Affiliations

FOXO1 inhibition yields functional insulin-producing cells in human gut organoid cultures

Ryotaro Bouchi et al. Nat Commun. .

Abstract

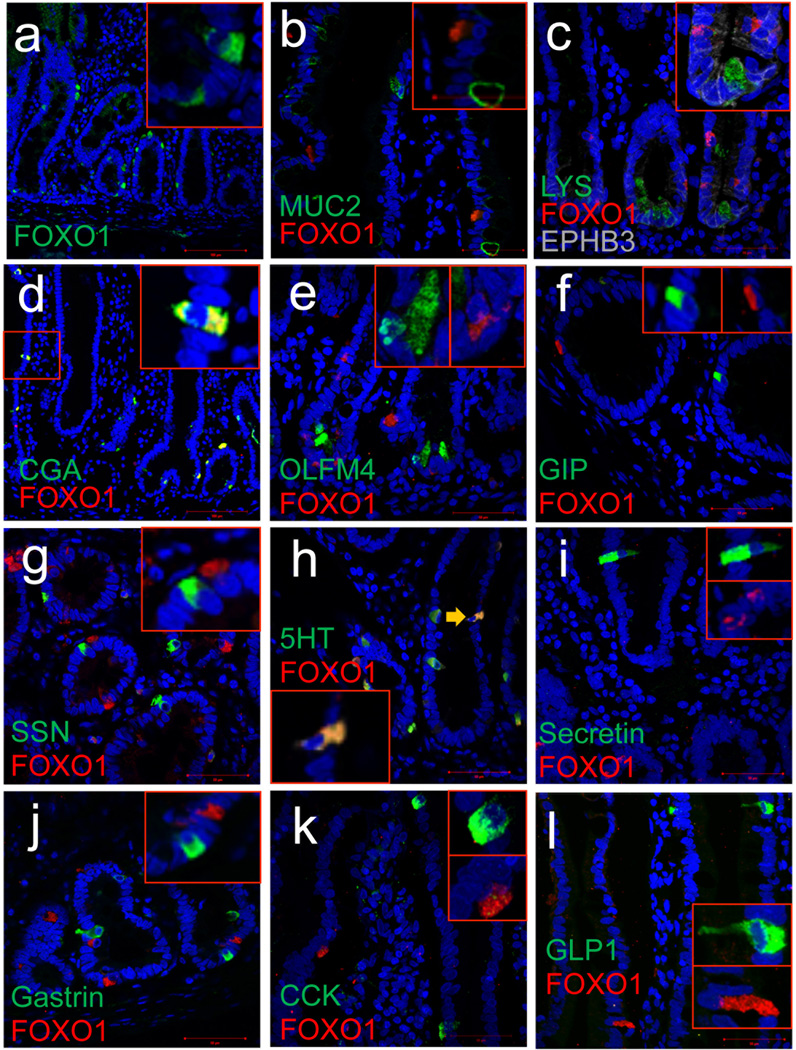
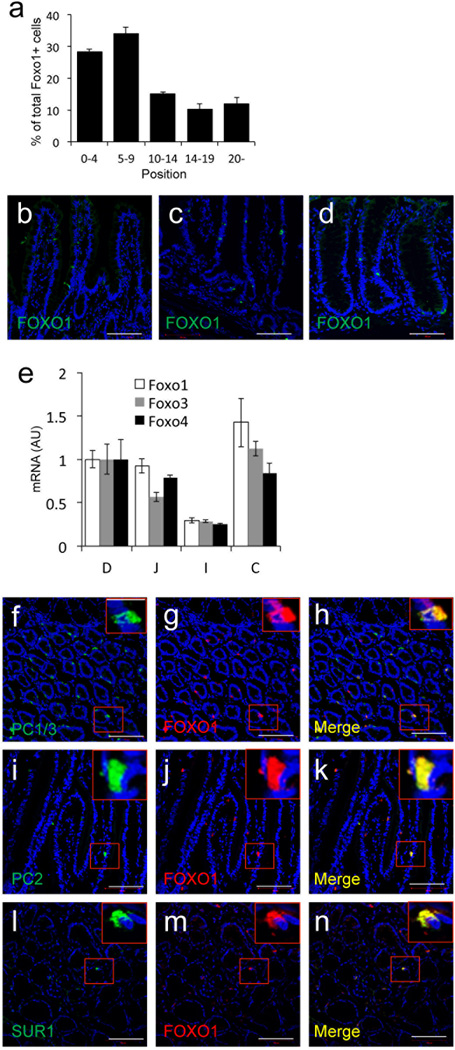
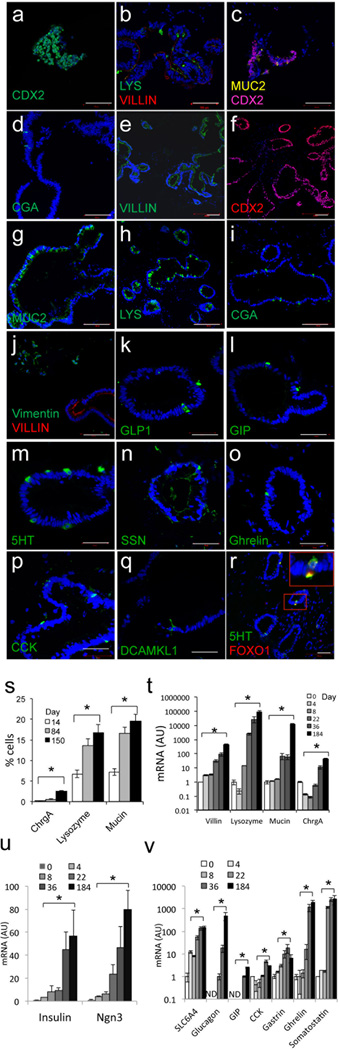
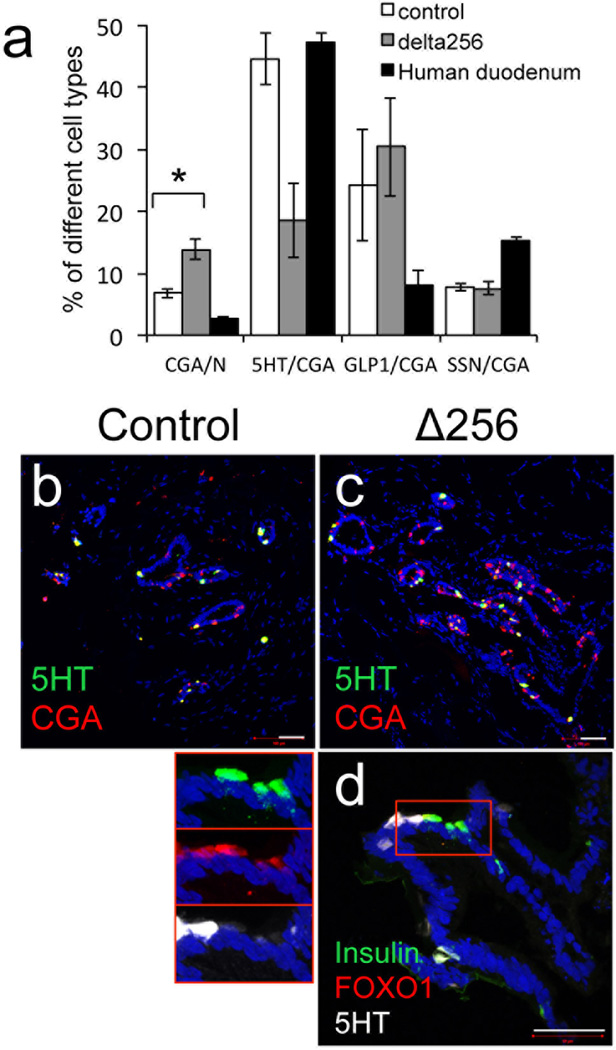
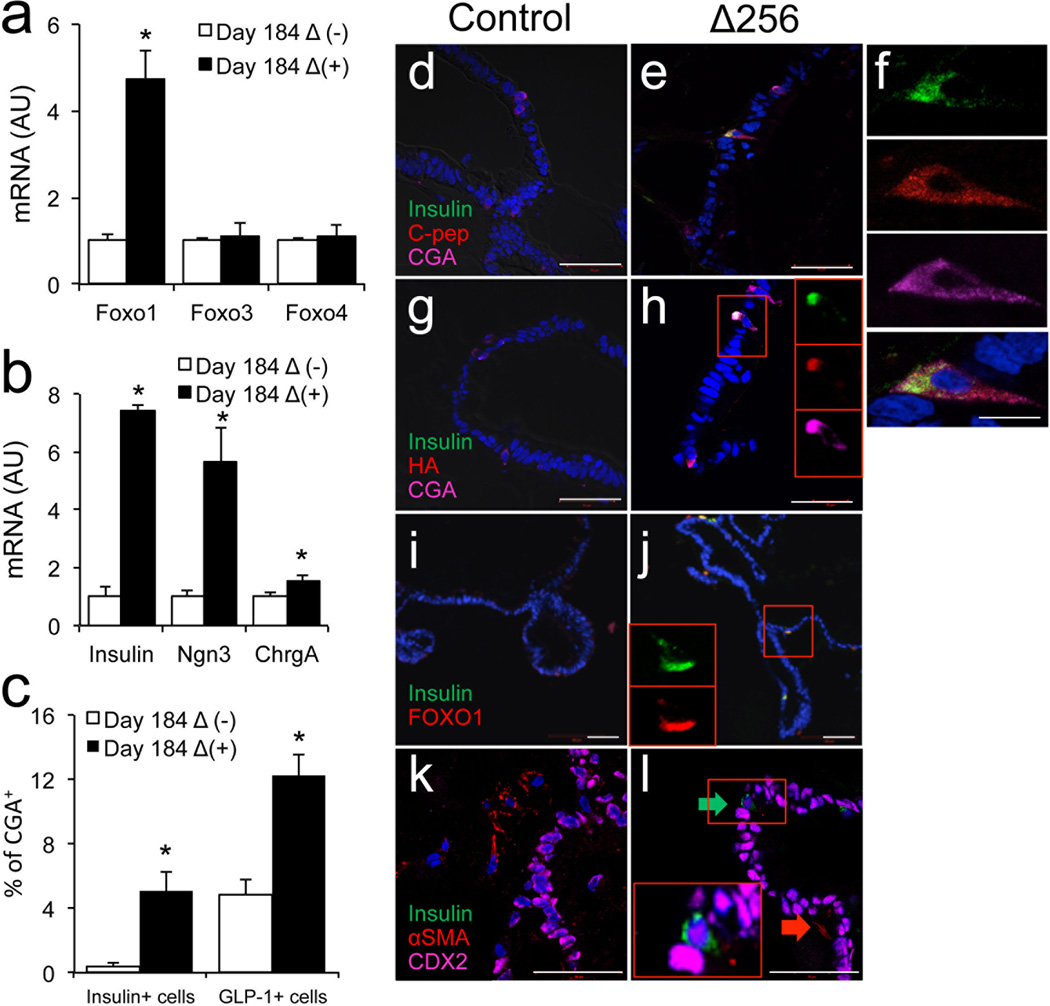
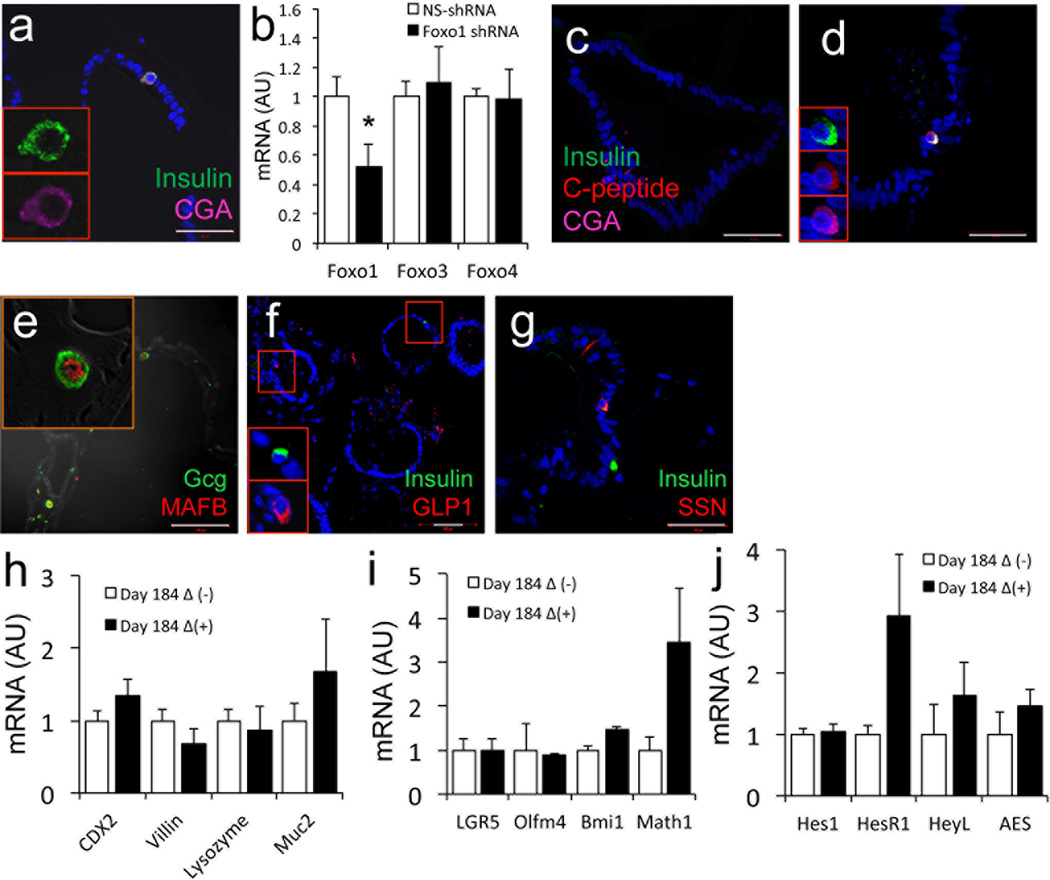
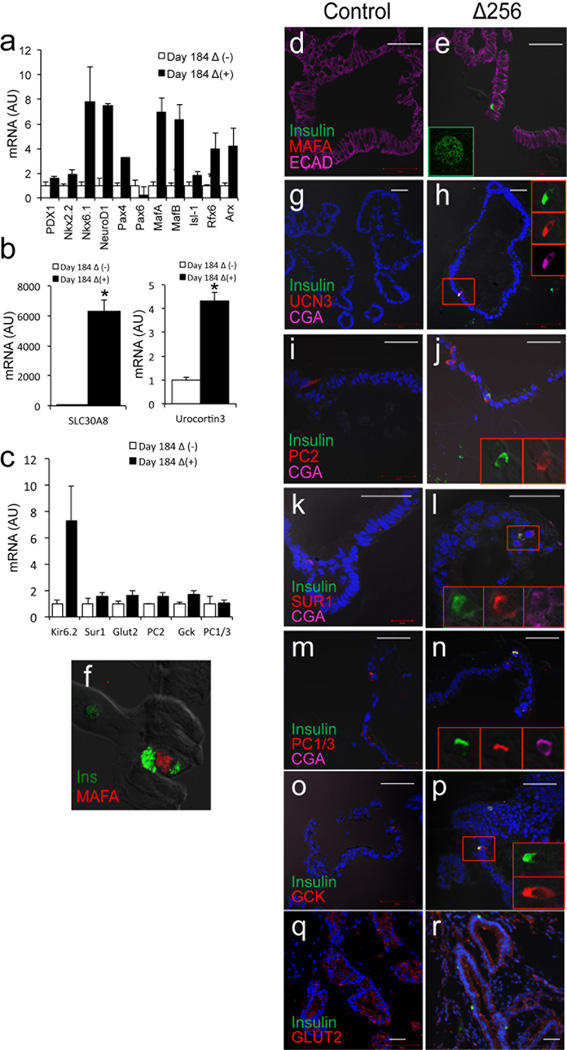
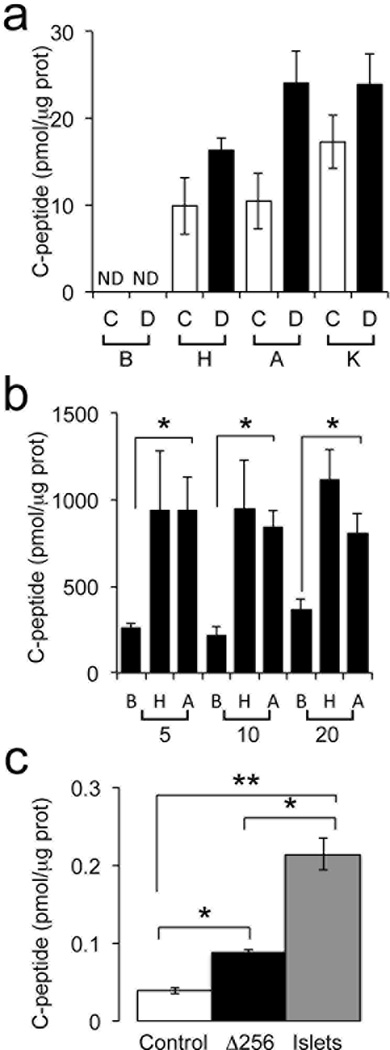
Generation of surrogate sources of insulin-producing β-cells remains a goal of diabetes therapy. While most efforts have been directed at differentiating embryonic or induced pluripotent stem (iPS) cells into β-like-cells through endodermal progenitors, we have shown that gut endocrine progenitor cells of mice can be differentiated into glucose-responsive, insulin-producing cells by ablation of transcription factor Foxo1. Here we show that FOXO1 is present in human gut endocrine progenitor and serotonin-producing cells. Using gut organoids derived from human iPS cells, we show that FOXO1 inhibition using a dominant-negative mutant or lentivirus-encoded small hairpin RNA promotes generation of insulin-positive cells that express all markers of mature pancreatic β-cells, release C-peptide in response to secretagogues and survive in vivo following transplantation into mice. The findings raise the possibility of using gut-targeted FOXO1 inhibition or gut organoids as a source of insulin-producing cells to treat human diabetes.


Figures

Figure 1
Figure 1
Survey of FOXO1 expression in human duodenum. a–e, FOXO1 (red) co-localization with secretory markers, MUCIN2 (MUC2), LYSOXYME (LYS), CHROMOGRANINA (CGA), OLFACTOMEDIN-4 (OLFM4) (all green) and EPHB3 (gray). f–l, Co-localization of FOXO1 with endocrine cell markers GIP, somatostatin (SSN), serotonin (5HT), secretin, gastrin, cholecystokinin (CCK), and GLP1. Scale bars: 100 µm in a–e, and 50 µm in f–l (n=3).
Figure 2
Figure 2
a, Quantitative analysis of the position of FOXO1-positive cells in human duodenum. b–d, FOXO1 immunostaining in (b) jejunum, (c) ileum, (d) colon. e, qPCR analysis of FOXO1 mRNA in human intestine (D: duodenum; J: jejunum; I: ileum; and C: colon). f–n, Immunostaining of FOXO1 with PC1/3, PC2, and SUR1 in human colon. Scale bars: 100 µm (n=3 for histology and qPCR) (*p < 0.05). We present data as means ± SEM.
Figure 3
Figure 3
Marker analysis of 150-day-old human iPS-derived gut organoids. a, CDX2 (green) in 8-day-old organoids; b, LYS (green) and VILLIN (red); c, MUC2 (yellow) and CDX2 (magenta); d, CGA (green) in 14-day-old organoids by immunohistochemistry. e, Villin; f, CDX2; g, MUC2; h, LYS; i, CGA; j; vimentin (green) and VILLIN (red) in 150-day-old gut organoids.. k–r, Analysis of endocrine cells; GLP1, GIP, 5HT, SSN, ghrelin, cholecystokinin (CCK), tuft cells (DCAMKL1), FOXO1 (green) and 5HT (red) in 150-day-old organoids. s, Quantification of CGA-, LYS- and MUC2-positive cells by immunohistochemistry. t–u, Time course qPCR analysis of VILLIN, LYSOZYME, MUCIN2 and CGA (t); INSULIN and NEUROG3 (u); SLC6A4 (serotonin transporter), GLUCAGON, GIP, CCK, GASTRIN, GHRELIN, and SSN during gut differentiation. Scale bars: 100 µm in panels a–j; 50 µm in panels k–r (n=3 each for histology and qPCR) (*p < 0.05). We present data as means ± SEM.
Figure 4
Figure 4
Changes to enteroendocrine cells following FOXO1 inhibition. a, Quantification of cells expressing CGA, 5HT, GLP1 and SSN in 230-day-old gut organoids transduced with control (empty bars), HA-Δ256 FOXO1 adenovirus (gray bars), or human duodenum (black bars). b–d, Immunohistochemistry with 5HT (green) and CGA (red) in 230-day-old gut organoids transduced with HA-Δ256 FOXO1 (l) or control adenovirus (m). e, Immunohistochemistry of insulin (green), FOXO1 (red) and 5HT (white) in 230-day-old gut organoids transduced with HA-Δ256 FOXO1 adenovirus. Insets on the left show magnifications of a cluster of 5HT-, FOXO1-, and insulin-positive cells. Scale bars: 50 µm (n=3 for histology and qPCR) (*p < 0.05 vs. organoids transduced with control shRNA lentivirus or HA-Δ256 adenovirus). We present data as means ± SEM.
Figure 5
Figure 5
Insulin-positive cells in 184-day-old human gut organoids. a–b, qPCR analysis of different markers in gut organoids transduced with control (empty bars) or HA-Δ256 FOXO1 adenovirus (black bars). c, Quantification of insulin- and GLP1-positive cells in gut organoids transduced with control (empty bars) or HA-Δ256 FOXO1 adenovirus (black bars). d–e, Immunohistochemistry with insulin (green), C-peptide (red), and CGA (magenta). f, Magnification of a typical flask-shaped insulin-positive cell from panel e. g–h, Co-immunohistochemistry with insulin (green), HA (to detect HA-Δ256 Foxo1 adenovirus) (red), and CGA (magenta). i–j, Co-immunohistochemistry with insulin (green) and FOXO1 (red), or (k, l) insulin (green), α-SMA (red) and CDX2 (magenta). Insets in h, j, and l show magnifications of individual cells. DAPI (blue) was used throughout to visualize DNA. Scale bars: 50 µm in a–e; 10 µm in f (n=3–6 for qPCR and 3 for histology) (* p < 0.05). We present quantitative data as means ± SEM.
Figure 6
Figure 6
Pancreatic lineage marker analysis. a, Immunohistochemistry with antibodies against insulin (green) and CGA (magenta) in 36-day-old gut organoids transduced with HA-Δ256 FOXO1 adenovirus. b, qPCR analysis of 230-day-old gut organoids transduced with control (empty bars) or FOXO1 lentiviral shRNA (black bars). c–d, Immunohistochemistry with anti-insulin (green) and CGA (magenta) antibodies in 230-day-old gut organoids transduced with control or FOXO1 shRNA lentivirus. e, Immunohistochemistry with glucagon (green) and MAFB (red); f, insulin (green) and GLP-1 (red); g, insulin (green) and somatostatin (red) in 184-day-old gut organoids transduced with HA-Δ256 adenovirus. h–j, qPCR analysis in 184-day-old gut organoids transduced with control (empty bars) or HA-Δ256 adenovirus (black bars) of transcripts encoding (h) intestinal lineage markers, (i) intestinal stem cell and pan-secretory lineage markers, and (j) genes associated with Notch signaling.
Figure 7
Figure 7
Pancreatic marker analysis in 184-day-old gut organoids. a–c, qPCR analysis of transcripts of markers associated with β-cell specification and maturation in organoids transduced with control (empty bars) or HA-Δ256 FOXO1 adenovirus (black bars). d–r, Colocalization of insulin (green) with (d–f) MAFA (The inset in panel e shows green MafA immunoreactivity in human pancreatic islets), (g–h) Urocortin-3, (i–j) PC2, (k–l) SUR1, (m–n) PC1/3, (o–p) glucokinase, and (q, r) glucose transporter 2 (all in red). Scale bars: 50 µm in d–r (n=3–6 for qPCR, 3 for histochemistry) (*p < 0.05 vs. organoids transduced with control virus). We present data as means ± SEM.
Figure 8
Figure 8
Human C-peptide assay using 200-day-old human gut organoids and pancreatic islets. a, Human C-peptide release from gut organoids normalized by protein levels in organoid lysates. C: control adenovirus; D: HA-Δ256 FOXO1 adenovirus, B: basal glucose (2 mM); H: high glucose (22mM); A: arginine (10 mM); K: KCl (30 mM); ND: not detected. b, C-peptide secretion by human islets. Abbreviations are the same as in panel a. The numbers below the brackets refer to number of islets used. c, C-peptide content in gut organoids and human islets *p < 0.05 vs. organoids transduced with control virus (panel c) or basal vs. glucose- and arginine-stimulated conditions (panel b) (** p < 0.05 vs. human islets in panel c). We present data as means ± SEM (n = 3).

References

    1. Schulz TC, et al. A scalable system for production of functional pancreartic progenitors from human embryonic stem cells. PLoS One. 2012;7:e37004. - PMC - PubMed
    1. Blum B, et al. Functional beta-cell maturation is marked by an increased glucose threshold and by expression of urocortin 3. Nature biotechnology. 2012;30:261–264. - PMC - PubMed
    1. Hua H, et al. iPSC-derived beta cells model diabetes due to glucokinase deficiency. J Clin Invest. 2013;123:3146–3153. - PMC - PubMed
    1. Maehr R, et al. Generation of pluripotent stem cells from patients with type 1 diabetes. Proc Natl Acad Sci U S A. 2009;106:15768–15773. - PMC - PubMed
    1. Schonhoff SE, Giel-Moloney M, Leiter AB. Minireview: Development and differentiation of gut endocrine cells. Endocrinology. 2004;145:2639–2644. - PubMed

Publication types