. 2014 Jul 1;111(26):9538-42.
doi: 10.1073/pnas.1321656111. Epub 2014 Jun 16.

Multiannual forecasting of seasonal influenza dynamics reveals climatic and evolutionary drivers

Affiliations

Multiannual forecasting of seasonal influenza dynamics reveals climatic and evolutionary drivers

Jacob Bock Axelsen et al. Proc Natl Acad Sci U S A. .

Abstract

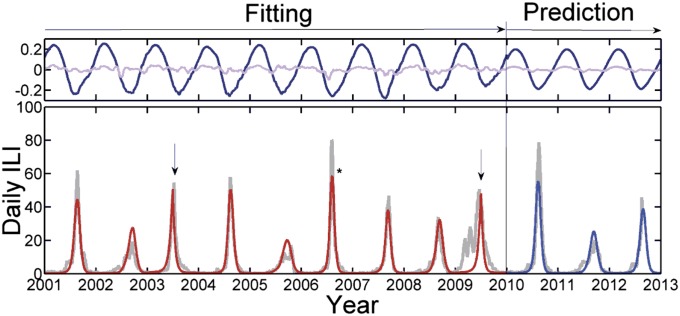
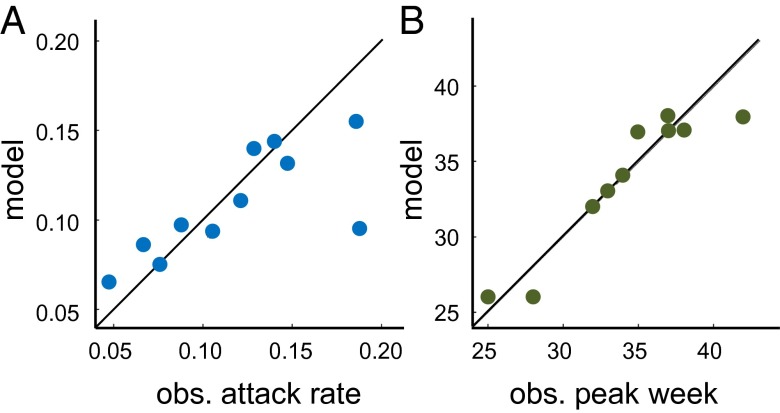
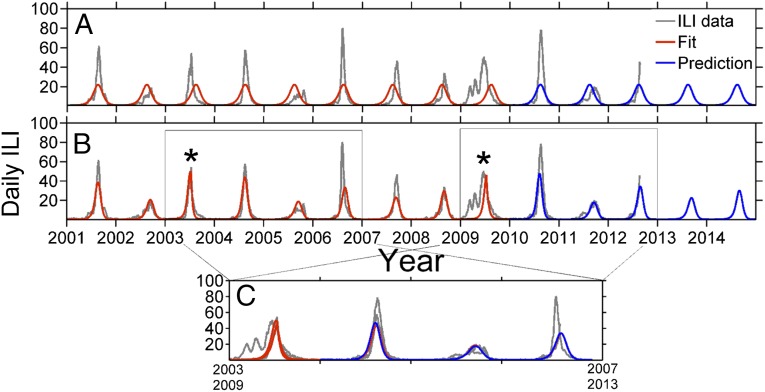
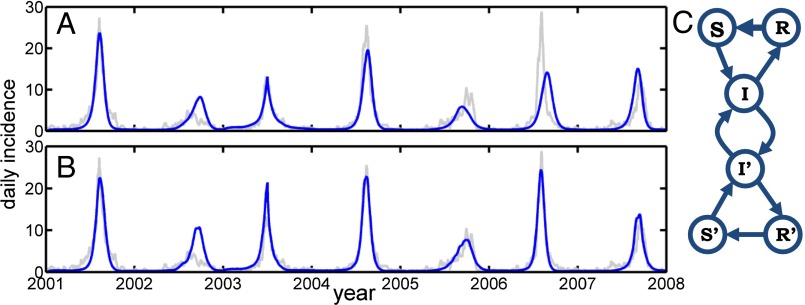
Human influenza occurs annually in most temperate climatic zones of the world, with epidemics peaking in the cold winter months. Considerable debate surrounds the relative role of epidemic dynamics, viral evolution, and climatic drivers in driving year-to-year variability of outbreaks. The ultimate test of understanding is prediction; however, existing influenza models rarely forecast beyond a single year at best. Here, we use a simple epidemiological model to reveal multiannual predictability based on high-quality influenza surveillance data for Israel; the model fit is corroborated by simple metapopulation comparisons within Israel. Successful forecasts are driven by temperature, humidity, antigenic drift, and immunity loss. Essentially, influenza dynamics are a balance between large perturbations following significant antigenic jumps, interspersed with nonlinear epidemic dynamics tuned by climatic forcing.

Keywords: Bayesian epidemic model; climate; infectious disease; model forecasting; predictive model.


Conflict of interest statement

The authors declare no conflict of interest.

Figures

Fig. 1.
Fig. 1.
(Lower) The smoothed daily ILI cases reported in Tel Aviv (light gray), with June 1 indicated on the x-axis for each year. Time series from the climate-driven deterministic SIRS model fitted to the ILI data (2001–2010) is shown (red), with fit correlation r = 0.94 to the period leading up to the pandemic in 2009. (Upper) The climate data consist of centered, normalized daily temperature (dark blue) and relative humidity readings (light violet), both scaled according to estimated weight. The pure prediction from June 1, 2010 is driven by the average climate of all years with fit r = 0.93. The outbreaks dominated by influenza B are indicated, and the asterisk highlights the abnormally high amplitude of 2006–2007. The epochal jumps in antigenic drift are indicated with arrows.
Fig. 2.
Fig. 2.
Quality of model fit as assessed by correspondence of (A) attack rate at r = 0.55, P = 0.01. The main outlier in the match of attack rates is the H1N1 outbreak in 2009, without which the fit exceeds r = 0.9. (B) Peak epidemic week vs. model fit correspondence is r = 0.94, P < 0.001.
Fig. 3.
Fig. 3.
(A) Model outcome of fitting (red) a pure sinusoidal seasonality driver: r = 0.65. The prediction (blue) is the continuation of the model after the fitting period ends. (B) Model outcome by including only antigenic jumps (*) together with the pure seasonality driver: r = 0.84. (C) Data collapse showing the HHL(H) motif (gray shade) also exhibited by the model (red and blue).
Fig. 4.
Fig. 4.
Jerusalem ILI. (A) Data (gray) and model (blue) of a fit to Jerusalem influenza epidemics, r = 0.84. We fit Jerusalem and Tel Aviv simultaneously, although uncoupled, with the same universal R0. (B) The metapopulation model with mutual exchange of infectives between Tel Aviv and Jerusalem, r = 0.94. (C) Network diagram of the coupled populations.

References

    1. Potter CW. A history of influenza. J Appl Microbiol. 2001;91(4):572–579. - PubMed
    1. Cox NJ, Subbarao K. Global epidemiology of influenza: past and present. Annu Rev Med. 2000;51:407–421. - PubMed
    1. Shaman J, Kohn M. Absolute humidity modulates influenza survival, transmission, and seasonality. Proc Natl Acad Sci USA. 2009;106(9):3243–3248. - PMC - PubMed
    1. Finkenstädt BF, Morton A, Rand DA. Modelling antigenic drift in weekly flu incidence. Stat Med. 2005;24(22):3447–3461. - PubMed
    1. Finkelman BS, et al. Global patterns in seasonal activity of influenza A/H3N2, A/H1N1, and B from 1997 to 2005: Viral coexistence and latitudinal gradients. PLoS One. 2007;2(12):e1296. - PMC - PubMed

Publication types

LinkOut - more resources