. 2014 Jul 1;111(26):E2636-45.
doi: 10.1073/pnas.1404855111. Epub 2014 Jun 16.

Centrosomes are autocatalytic droplets of pericentriolar material organized by centrioles

Affiliations

Centrosomes are autocatalytic droplets of pericentriolar material organized by centrioles

David Zwicker et al. Proc Natl Acad Sci U S A. .

Abstract

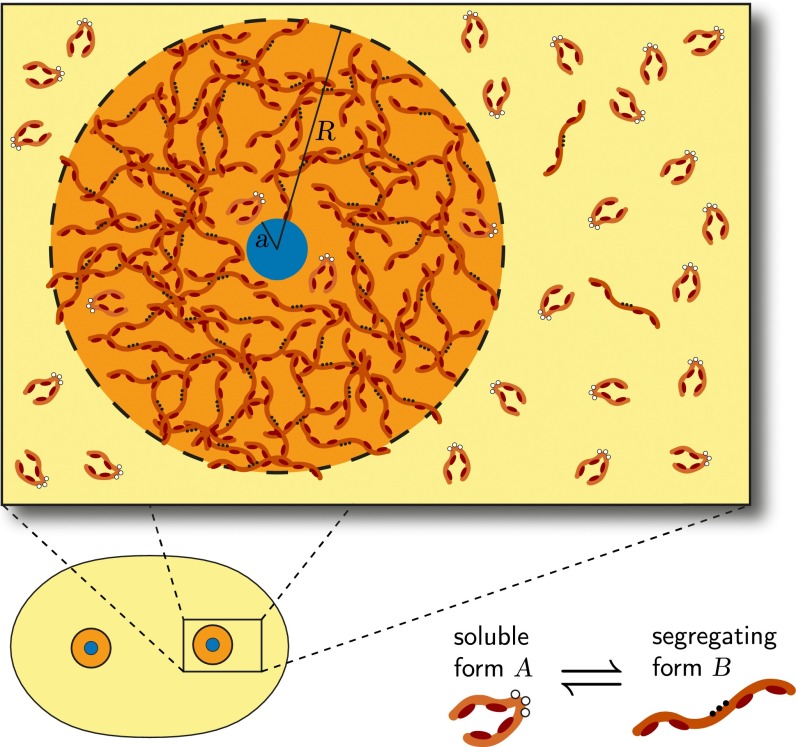
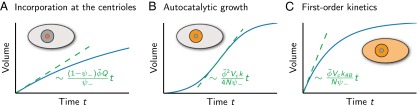
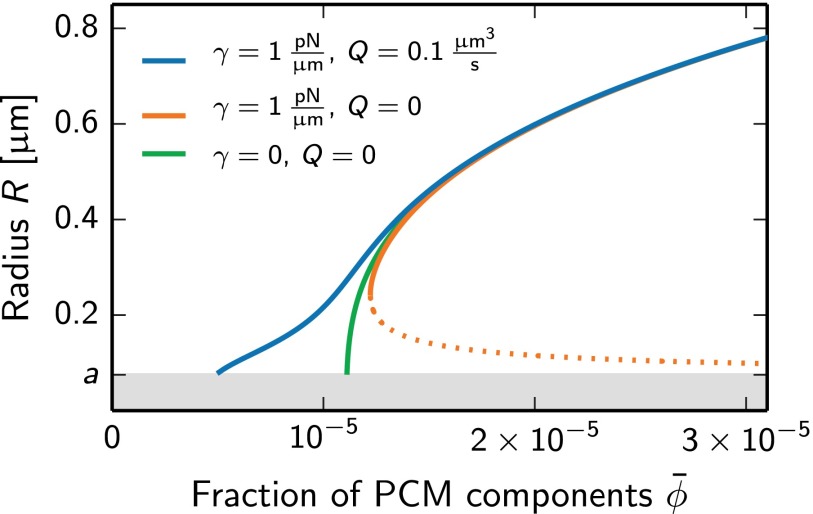
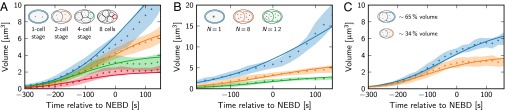
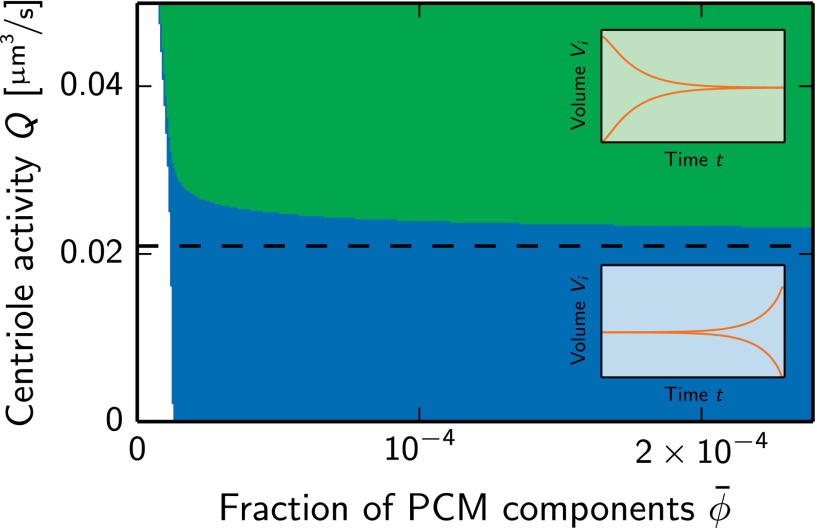
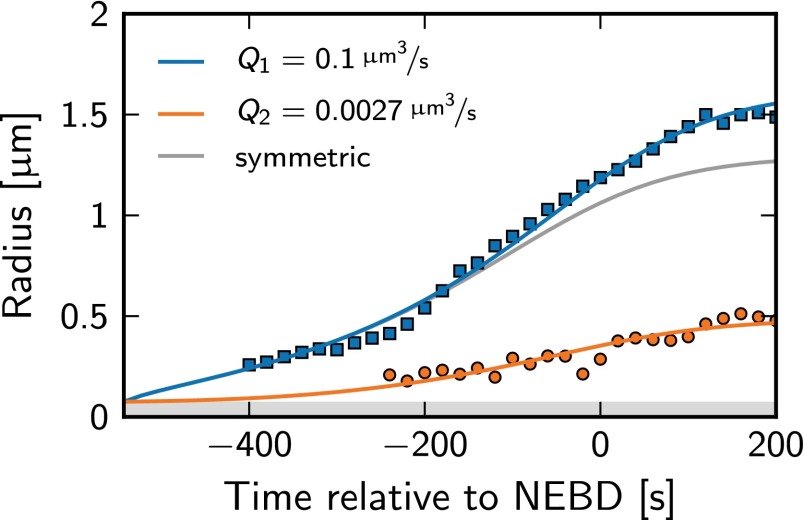
Centrosomes are highly dynamic, spherical organelles without a membrane. Their physical nature and their assembly are not understood. Using the concept of phase separation, we propose a theoretical description of centrosomes as liquid droplets. In our model, centrosome material occurs in a form soluble in the cytosol and a form that tends to undergo phase separation from the cytosol. We show that an autocatalytic chemical transition between these forms accounts for the temporal evolution observed in experiments. Interestingly, the nucleation of centrosomes can be controlled by an enzymatic activity of the centrioles, which are present at the core of all centrosomes. This nonequilibrium feature also allows for multiple stable centrosomes, a situation that is unstable in equilibrium phase separation. Our theory explains the growth dynamics of centrosomes for all cell sizes down to the eight-cell stage of the Caenorhabditis elegans embryo, and it also accounts for data acquired in experiments with aberrant numbers of centrosomes and altered cell volumes. Furthermore, the model can describe unequal centrosome sizes observed in cells with perturbed centrioles. We also propose an interpretation of the molecular details of the involved proteins in the case of C. elegans. Our example suggests a general picture of the organization of membraneless organelles.


Conflict of interest statement

The authors declare no conflict of interest.

Figures

Fig. 1.
Fig. 1.
Representation of a centrosome consisting of centrioles (blue) surrounded by a dense phase (orange) of PCM. In our model, the PCM components exist in two conformations: a form A that dissolves in the cytosol (globular shape) and a form B that segregates from the cytosol in a droplet phase (elongated shape). The dynamics of the system are governed by diffusion of the components and transitions between the A and B forms in the bulk and at the centrioles. (Lower Right) Phosphorylating the PCM components (open white circles becoming solid black circles) could induce a conformational change, which exposes binding sites (dark red patches). (Lower Left) Schematic representation of a cell with two centrosomes.
Fig. 2.
Fig. 2.
Droplet volume (blue solid lines) as a function of time for three scenarios of reaction-limited droplet growth. (A) Droplet growth by centriole activity. Droplet material is produced at the centrioles only (orange region). (B) Autocatalytic droplet growth. Droplet material is produced inside the droplet only. (C) Droplet growth by a first-order reaction AB corresponding to droplet material production in the whole cell. The maximal volume growth rate for each case is indicated by dashed lines, and their corresponding time dependence is given (green).
Fig. 3.
Fig. 3.
Radii of stationary, autocatalytic droplets as a function of the average volume fraction ϕ¯ of PCM components for different values of surface tension γ and centriole activity Q. Solid lines indicate stable steady states, and dotted lines correspond to unstable states. Steady states were obtained by solving Eqs. 18 in a spherical geometry and the associated stability was obtained by linear stability analysis. The gray area marks the centrioles of radius a = 75 nm. Additional model parameter values are Vc = 104 μm3, ψ = 0.1, ψ+ = 0, DA/B=5μm2/s, kAB = 0, k = 100 s−1, kBA = 10−3 s−1, and β±=108μm2/pN.
Fig. 4.
Fig. 4.
Comparison of the theory (lines) to experimental data (dots, mean; shaded area indicates standard deviation) of centrosome growth in C. elegans. The centrosome volume is shown as a function of time. Time t = 0 corresponds to nuclear envelop breakdown (NEBD). (A) Wild-type data for several cell sizes ranging from the one- to the eight-cell stage with cell volumes given in Table 1 (sample size n = 64, 54, 56, 51, from top to bottom). (B) Data from cells with an aberrant number N of centrosomes [N = 1, zyg-1(b1) embryos; N = 8, 12, zyg-1(it29) embryos; sample size n = 15, 16, 12, from top to bottom]. (C) Data from ani-2(RNAi) embryos with altered cell volumes (quantified fraction of wild-type volume is indicated; sample size n = 12, 18, from top to bottom). In A, the autocatalytic reaction rate constant k = 100 s−1, the average fraction of PCM components ϕ¯=2×10⁴, and the initial centrosome volumes V0 are determined by a fit of theoretical curves to the data. k and ϕ¯ are used in B and C, where the initial centrosome volumes are determined by a fit to the data. Vc is an additional fit parameter in C. All other model parameters have only a weak influence and are taken from Table 2.
Fig. 5.
Fig. 5.
Stability diagram of a pair of centrosomes as a function of the average fraction ϕ¯ of PCM components and the centriole activity Q. Two centrosomes are stable and have the same volume in the green region. Conversely, one centrosome grows at the expense of the other in the blue region. The dashed line indicates the threshold Qstab given in Eq. 13 and parameter values are given in Table 2. Insets show schematics of the centrosome volumes as a function of time in the respective regions. These dynamics and the associated stability are obtained from a numerical analysis of a simplified model of centrosome growth (Appendix: Autocatalytic Growth of Multiple Droplets).
Fig. 6.
Fig. 6.
Radii of two centrosomes with unequal centrioles as a function of time. The solid lines show a fit of the theory to the experimental data (squares and circles) obtained in the two-cell stage (AB cell) of C. elegans where the protein SAS-4 has been partly depleted. Fit parameters are the catalytic activity Q2 of the centriole pair of the smaller centrosome, the average fraction ϕ¯ of PCM components, and the time of growth initiation. The remaining parameters are taken from Table 2. The theoretical growth curve obtained with the same parameters in the symmetric case, Q1=Q2=0.1μm3/s, is also shown (gray).

References

    1. Travis J. Mysteries of the cell. How does the cell position its proteins? Science. 2011;334(6059):1048–1049. - PubMed
    1. Chan YH, Marshall WF. Scaling properties of cell and organelle size. Organogenesis. 2010;6(2):88–96. - PMC - PubMed
    1. Goehring NW, Hyman AA. Organelle growth control through limiting pools of cytoplasmic components. Curr Biol. 2012;22(9):R330–R339. - PubMed
    1. Brangwynne C. Soft active aggregates: Mechanics, dynamics and self-assembly of liquid-like intracellular protein bodies. Soft Matter. 2011;7:3052–3059.
    1. Hyman AA, Brangwynne CP. Beyond Stereospecificity: Liquids and Mesoscale Organization of Cytoplasm. Dev Cell. 2011;21(1):14–16. - PubMed

Publication types