. 2014 Jun 30;15(6):R88.
doi: 10.1186/gb-2014-15-6-r88.

Human genomic regions with exceptionally high levels of population differentiation identified from 911 whole-genome sequences

Collaborators

Human genomic regions with exceptionally high levels of population differentiation identified from 911 whole-genome sequences

Vincenza Colonna et al. Genome Biol. .

Abstract

Background: Population differentiation has proved to be effective for identifying loci under geographically localized positive selection, and has the potential to identify loci subject to balancing selection. We have previously investigated the pattern of genetic differentiation among human populations at 36.8 million genomic variants to identify sites in the genome showing high frequency differences. Here, we extend this dataset to include additional variants, survey sites with low levels of differentiation, and evaluate the extent to which highly differentiated sites are likely to result from selective or other processes.

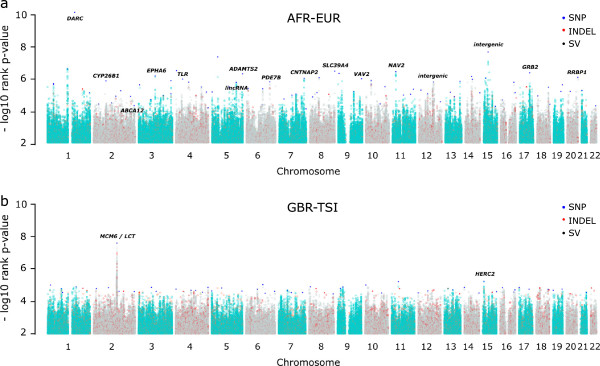
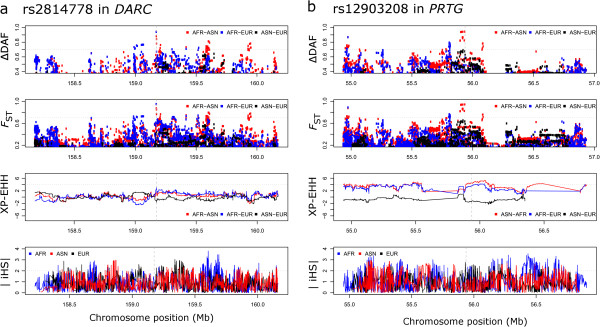
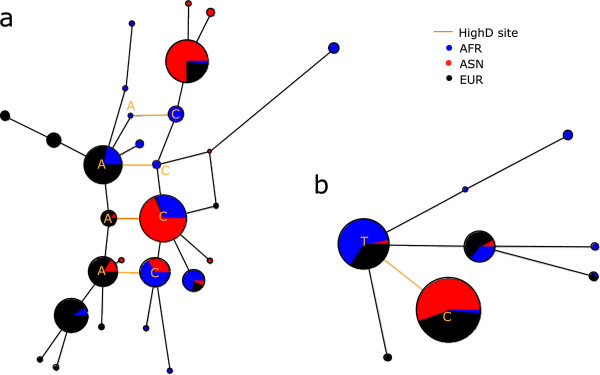
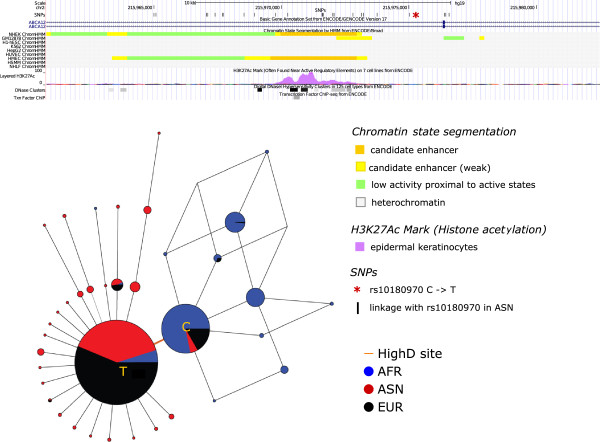
Results: We demonstrate that while sites with low differentiation represent sampling effects rather than balancing selection, sites showing extremely high population differentiation are enriched for positive selection events and that one half may be the result of classic selective sweeps. Among these, we rediscover known examples, where we actually identify the established functional SNP, and discover novel examples including the genes ABCA12, CALD1 and ZNF804, which we speculate may be linked to adaptations in skin, calcium metabolism and defense, respectively.

Conclusions: We identify known and many novel candidate regions for geographically restricted positive selection, and suggest several directions for further research.


Figures

Figure 1
Figure 1
Manhattan plots of rank P-values for genome-wide pairwise derived allele frequency differences (ΔDAFs). (a,b) As an example, we report here between-continental populations (AFR-EUR) (a) and within continental-populations (GBR-TSI) (b) comparisons. Only the top percentile of the 36.8 million variants is represented. Each dot represents the genome-wide ΔDAF rank P-value at a variable site between two populations. Chromosomes are represented by alternating turquoise and grey colors; red, blue and black dots represent INDEL, SNP and SV sites, respectively, that have been identified as highly differentiated (HighD sites). Gene/region names are shown for some of the top HighD sites.
Figure 2
Figure 2
Sensitivity to migration rate (m_rate) of the expected number of HighD sites from simulations under neutrality. The dashed line represents the observed number of HighD sites. Simulations of the AFR-ASN comparison are shown here; results for AFR-EUR and ASN-EUR, and for simulations using alternative demographic models, are reported in Figure S8 in Additional file 2.
Figure 3
Figure 3
Overlap of genes hosting HighD sites with genes previously identified as putatively under positive selection (blue bars). For comparison, the average value and standard deviation relative to 100 control sets of randomly selected genes (gray bar) are reported. High DeltaDAF HighD sites are those whose ΔDAF is ranked in the fourth quartile.
Figure 4
Figure 4
Population-specific values at HighD sites. (a) iHS values; (b) XP-EHH values. In both cases values of the two statistics relative to randomly selected genomic variable sites matched for allele frequency and distance from gene are also shown (indicated as ‘matched’ or ‘m_ ’, gray lines). P-values refer to two-sample Kolmogorov-Smirnov tests between iHS or XP-EHH distributions in HighD and matched sites. In (b), for every population XP-EHH was calculated using as reference the two others (two shades of pink or two line types).
Figure 5
Figure 5
Examples of genomic regions hosting HighD sites. (a) Known examples; (b) novel examples. Comparison with other statistics informative for positive selection is also reported. Dashed vertical grey lines in the plots indicate the position of the HighD site. In the case of DARC, this HighD site corresponds to the known functional polymorphism rs2814778. Dotted horizontal grey lines indicate reference thresholds taken from the literature for statistics for XP-EHH and iHS, or arbitrary for FST, and as chosen in this study for ΔDAF.
Figure 6
Figure 6
Examples of likely selection. (a) On standing variation (C>A at rs71551254 in CALN1) and (b) classic sweep (T > C at rs2553449 in GSTCD) inferred from high and low Levenshtein distances, respectively.
Figure 7
Figure 7
Functional annotations in the genomic region surrounding the HighD site in ABCA12, and a median-joining network of the haplotypes surrounding the site. Haplotypes are derived from sites in linkage disequilibrium (D’ = 1) with the HighD site in ASN populations.

References

    1. Darwin C. The Origin of Species. 1859.
    1. Pritchard JK, Pickrell JK, Coop G. The genetics of human adaptation: hard sweeps, soft sweeps, and polygenic adaptation. Curr Biol. 2010;20:R208–215. - PMC - PubMed
    1. Darwin C. The Descent of Man and Selection in Relation to Sex. 1871.
    1. Charlesworth D. Balancing selection and its effects on sequences in nearby genome regions. PLoS Genet. 2006;2:e64. - PMC - PubMed
    1. Jobling MA, Hollox EJ, Hurles ME, Kivisild T, Tyler-Smith C. Human Evolutionary Genetics. 2. Garland Science: Abingdon, UK; 2013.

Publication types

LinkOut - more resources