. 2014 Jun 30:3:e03275.
doi: 10.7554/eLife.03275.

Prediction and characterization of enzymatic activities guided by sequence similarity and genome neighborhood networks

Affiliations

Prediction and characterization of enzymatic activities guided by sequence similarity and genome neighborhood networks

Suwen Zhao et al. Elife. .

Abstract

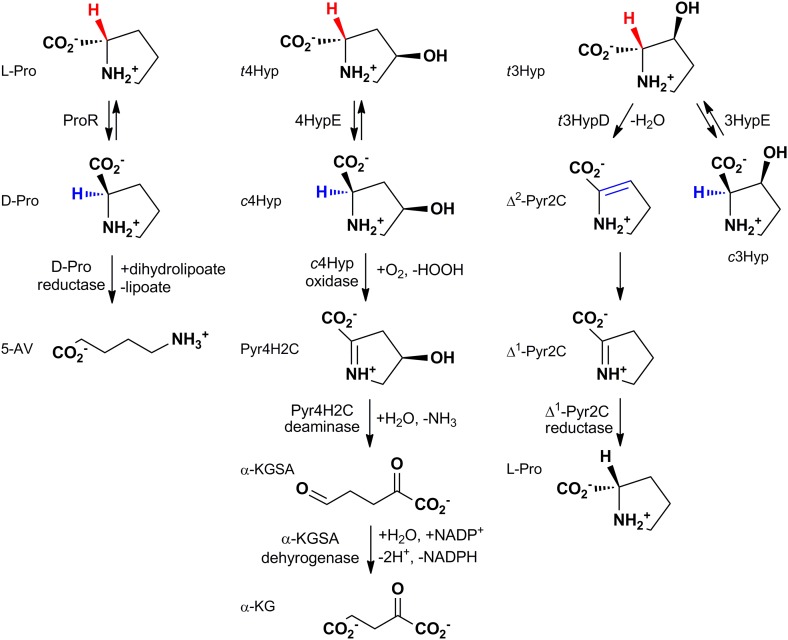
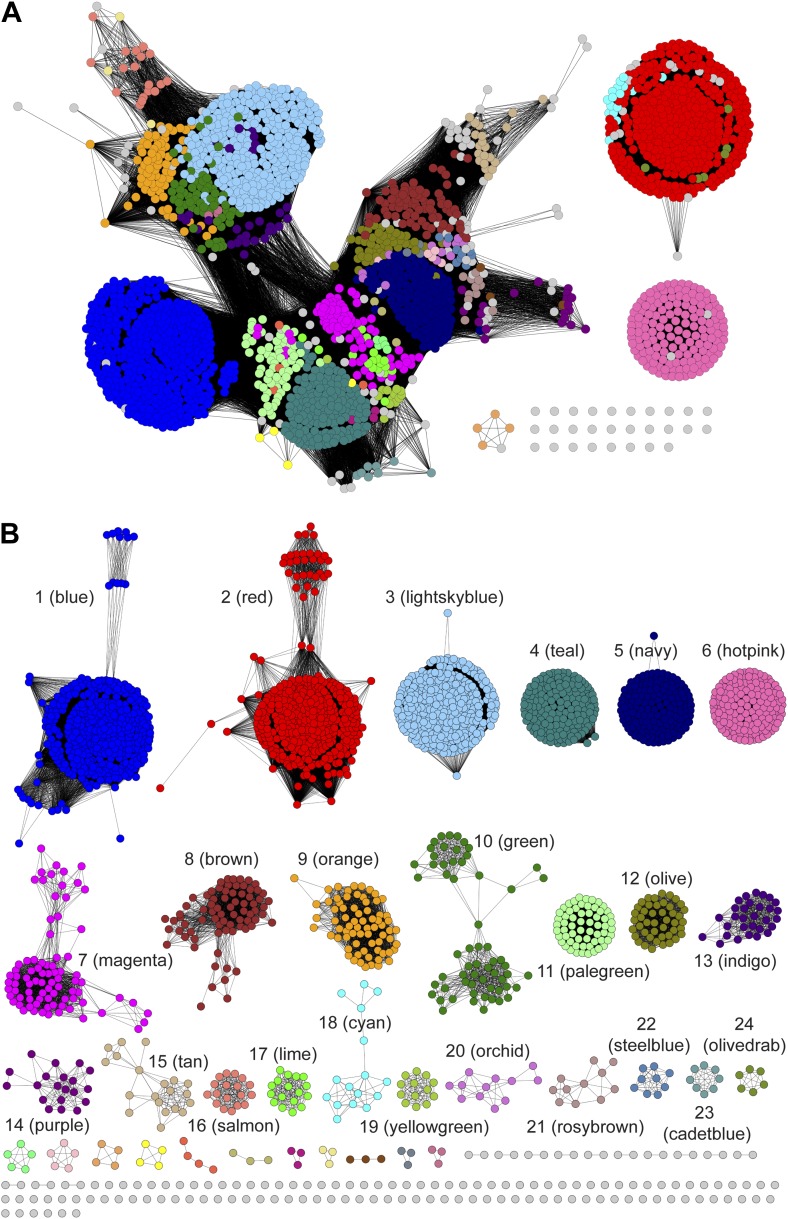
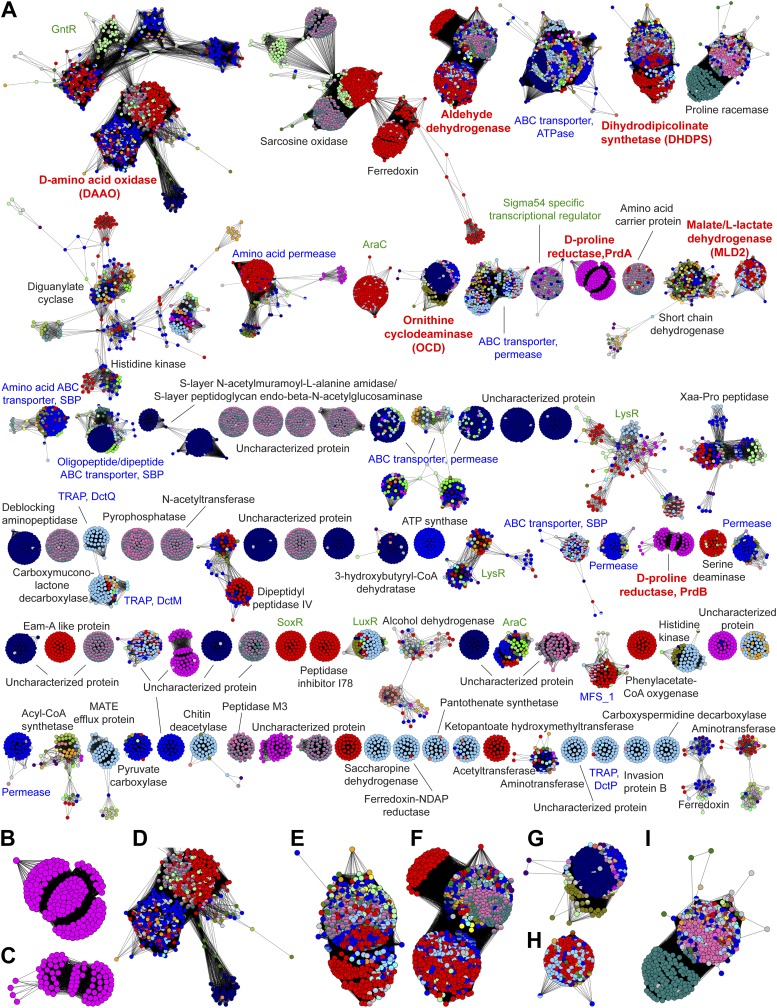
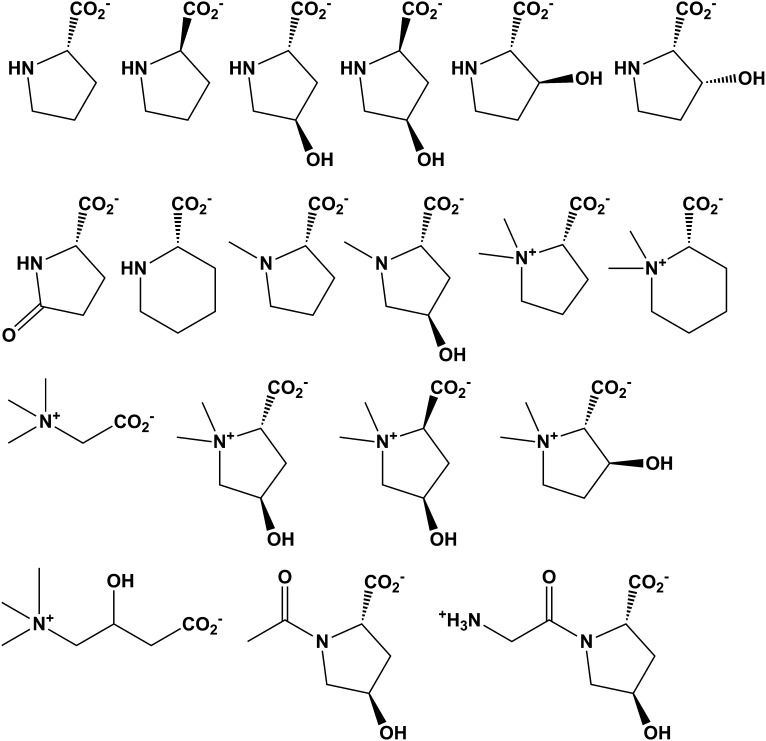
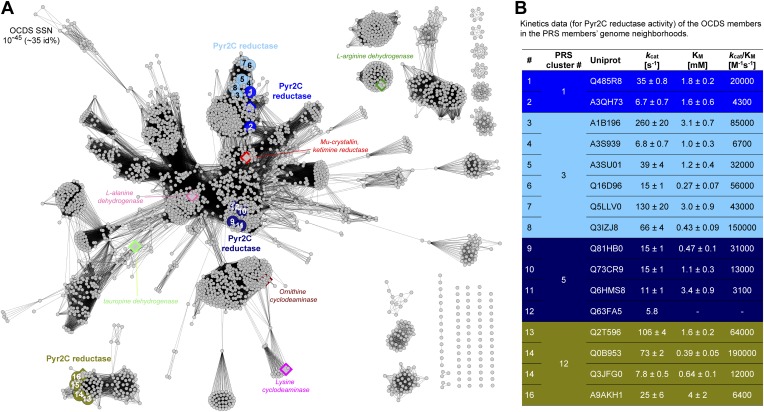
Metabolic pathways in eubacteria and archaea often are encoded by operons and/or gene clusters (genome neighborhoods) that provide important clues for assignment of both enzyme functions and metabolic pathways. We describe a bioinformatic approach (genome neighborhood network; GNN) that enables large scale prediction of the in vitro enzymatic activities and in vivo physiological functions (metabolic pathways) of uncharacterized enzymes in protein families. We demonstrate the utility of the GNN approach by predicting in vitro activities and in vivo functions in the proline racemase superfamily (PRS; InterPro IPR008794). The predictions were verified by measuring in vitro activities for 51 proteins in 12 families in the PRS that represent ∼85% of the sequences; in vitro activities of pathway enzymes, carbon/nitrogen source phenotypes, and/or transcriptomic studies confirmed the predicted pathways. The synergistic use of sequence similarity networks3 and GNNs will facilitate the discovery of the components of novel, uncharacterized metabolic pathways in sequenced genomes.

Keywords: biochemistry; functional assignment; genome neighborhood network; sequence similarity network.


Conflict of interest statement

The authors declare that no competing interests exist.

Figures

Figure 1.
Figure 1.. The reactions catalyzed by proline racemase (ProR), 4R-hydroxyproline 2-epimerase (4HypE), and trans-3-hydroxy-L-proline dehydratase (t3HypD) and the metabolic pathways in which they participate.
cHyp oxidase, Pyr4H2C deaminase, α-KGSA dehydrogenase, and Δ1-Pyr2C reductase belong to the D-amino acid oxidase (DAAO), dihydrodipicolinate synthase (DHDPS), aldehyde dehydrogenase, and ornithine cyclodeaminase (OCD) (or malate/L-lactate dehydrogenase 2 [MLD2]) superfamilies, respectively. Abbreviations: L-Pro: L-proline; D-Pro: D-proline; 5-AV: 5-aminovalerate; t4Hyp: trans-4-hydroxy-L-proline; c4Hyp: cis-4-hydroxy-D-proline; Pyr4H2C: Δ1-pyrroline 4-hydroxy 2-carboxylate; α-KGSA: α-ketoglutarate semialdehyde; α-KG: α-ketoglutarate; t3Hyp: trans-3-hyroxy-L-proline; Δ2-Pyr2C: Δ2-pyrroline 2-carboxylate; Δ1-Pyr2C: Δ1-pyrroline 2-carboxylate. DOI: http://dx.doi.org/10.7554/eLife.03275.003
Figure 2.
Figure 2.. Sequence similarity networks (SSNs) for the PRS.
(A) The SSN displayed with an e-value threshold of 10−55 (∼35% sequence identity). (B) The SSN displayed with an e-value threshold of 10−110 (∼60% sequence identity). DOI: http://dx.doi.org/10.7554/eLife.03275.004
Figure 3.
Figure 3.. The genome neighborhood network (GGN) for the PRS.
(A) The GNN displayed with an e-value threshold of 10−20. The nodes are colored by the color of query nodes in the SSN (Figure 2A). The clusters are labeled with the UniProtKB/TrEMBL annotations. (B–I) Selected superfamily clusters from the GNN showing node colors. (B) D-proline reductase PrdA. (C) D-proline reductase, PrdB. (D) D-amino acid oxidase (DAAO). (E) Dihydrodipicolinate synthase (DHDPS). (F) Aldehyde dehydrogenase. (G) Ornithine cyclodeaminase (OCD). (H) Malate/L-lactate dehydrogenase 2 (MLD2). (I) Proline racemase. DOI: http://dx.doi.org/10.7554/eLife.03275.005
Figure 4.
Figure 4.. Library of proline and proline betaine derivatives tested for ESI-MS screening.
These substrates were divided into four groups to avoid mass duplication. DOI: http://dx.doi.org/10.7554/eLife.03275.006
Figure 5.
Figure 5.. Structures of members of the PRS.
(A) Structure of Q4KGU2 (locus tag: PFL_1412; cluster 2) with PYC illustrating the utilization of the carboxyl group to bridge the N-terminal amide backbone groups of two opposing α-helices. While In B9K4G4 (D) and B9JQV3 (C) the relative positions of residues that coordinate the prolyl nitrogen (Asp 232, His 90) are conserved His 90 is replaced by a Ser. (B) Structure of Q4KGU2 with t4Hyp illustrating the interactions Q4KGU2 with the 4-hydroxyl group and the relative positions of the two catalytic cysteine residues. (C) Structure of B9JQV3 (locus tag: Avi_0518, cluster 9) with t4Hyp illustrating the interactions of B9JQV3 with the 4-hydroxyl group of t4Hyp and the relative positions of the catalytic Ser (Ser 93, trans→cis) and Cys (Cys 236, cis→trans). (D) Structure of B9K4G4 (Avi_7022, cluster 3) with PYC illustrating the position of the catalytic Ser (Ser 90, dehydration), and the non-catalytic orientation of Thr 256 which replaces the Cys observed in Cys/Cys containing PRS members. In addition, the catalytic Ser (Ser 90) is positioned by hydrogen bonding interactions between the side chain of Asn 93 (shown) and the backbone nitrogen of Asn 93 (not shown). Based on this work, all ProR family members with a catalytic Ser at this position (including B9JQV3, determined here) are proposed to have this motif. DOI: http://dx.doi.org/10.7554/eLife.03275.012
Figure 6.
Figure 6.. Sequence divergent members of the ornithine cyclodeaminase superfamily (OCDS) have been the assigned novel pyrroline-2-carboxylate reductase (Pyr2C reductase) function in this work.
(A) The OCDS SSN displayed at the e-value cutoff 10−45 (∼35% sequence identity). The Pyr2C reductase function is located in four clusters; these proteins are shown in large colored circles, labeled from 1 to 16, and color-coded by the colors of the PRS query sequences shown in Figure 2B. Proteins representing several previously characterized functions in the OCDS are shown by large diamonds, with borders in hotpink (L-alanine dehydrogenase [Schröder et al., 2004]), brown (ornithine cyclodeaminase [Goodman et al., 2004]), magenta (lysine cyclodeaminase [Gatto et al., 2006]), red (ketamine reductase [Hallen et al., 2011]), green (L-arginine dehydrogenase [Li and Lu, 2009]) and palegreen (tauropine dehydrogenase [Kan-No et al., 2005; Plese et al., 2008]), respectively. Their annotations are shown in italics. The diamonds with blue and olive borders are Pyr2C reductases recently characterized by Watanabe et al. (2014). (B) Kinetics data for the Pyr2C reductase activity for the 16 members of the OCDS shown in panel A using NADPH as the cosubstrate. DOI: http://dx.doi.org/10.7554/eLife.03275.014
Figure 7.
Figure 7.. Mapping members of GNN clusters back to the SSN for the PRS.
(A) SSN for the PRS with cluster numbers. (B) D-amino acid oxidase (DAAO). (C) Dihydrodipicolinate synthase (DHDPS). (D) Aldehyde dehydrogenase. (E) Ornithine cyclodeaminase (OCD). (F) Malate/L-lactate dehydrogenase 2 (MLD2). (G) The color scheme for B–F. DOI: http://dx.doi.org/10.7554/eLife.03275.016
Figure 8.
Figure 8.. Experimentally characterized enzymes reported by Swiss-Prot (small colored circles) and newly characterized in this work (large colored circles).
Colors match the color scheme in Figure 2B. DOI: http://dx.doi.org/10.7554/eLife.03275.017
Figure 9.
Figure 9.. Demonstration of the 4HypE, 3HypE, and t3HypD reactions by 1H NMR.
(A) 1H NMR spectra of the 4Hyp substrate mixture in 25 mM Na+-phosphate buffer, pD 8, in D2O (top) and 4Hyp mixture with A3QFI1 (cluster 1, blue) showing 4Hyp epimerization (bottom). The red arrow indicates the proton at C2 for epimerization. The enzyme was stored in glycerol, so the spectra show resonances for glycerol between 3.4 and 3.7 ppm. (B) 1H NMR spectra of the t3Hyp substrate mixture in 25 mM Na+-phosphate buffer, pD 8, in D2O (top), t3Hyp mixture with D0B556 (cluster 3, light sky blue) showing 3Hyp epimerization (middle), and t3Hyp mixture with B9K4G4 (cluster 3, light sky blue) showing t3Hyp dehydration (bottom). The red arrow indicates the proton at C2 for epimerization; the green arrow indicates the proton at C3 for dehydration. DOI: http://dx.doi.org/10.7554/eLife.03275.018
Figure 10.
Figure 10.. Representative 1H NMR spectra for △1-pyrroline-2-carboxylate (△1-Pyr2C) reductase activity.
(A) 1H NMR spectrum of △1-Pyr2C substrate in sodium phosphate, pD 8.0, in D2O. (B) 1H NMR spectrum of Q7CVK1 (locus tag: Atu4676) incubated with △1-Pyr2C, NADPH, and the cofactor regeneration system of alcohol dehydrogenase (NADP+-dependent) and isopropanol in sodium phosphate, pD 8.0 in D2O. (C) 1H NMR spectrum of L-proline in 25 mM sodium phosphate, pD 8.0, in D2O. DOI: http://dx.doi.org/10.7554/eLife.03275.019

References

    1. Adams E, Frank L. 1980. Metabolism of proline and the hydroxyprolines. Annual Review of Biochemistry 49:1005–1061. doi: 10.1146/annurev.bi.49.070180.005041 - DOI - PubMed
    1. Adams PD, Gopal K, Grosse-Kunstleve RW, Hung LW, Ioerger TR, McCoy AJ, Moriarty NW, Pai RK, Read RJ, Romo TD, Sacchettini JC, Sauter NK, Storoni LC, Terwilliger TC. 2004. Recent developments in the PHENIX software for automated crystallographic structure determination. Journal of Synchrotron Radiation 11:53–55. doi: 10.1107/S0909049503024130 - DOI - PubMed
    1. Atkinson HJ, Morris JH, Ferrin TE, Babbitt PC. 2004. Using sequence similarity networks for visualization of relationships across diverse protein superfamilies. PLOS ONE 4:e4345. doi: 10.1371/journal.pone.0004345 - DOI - PMC - PubMed
    1. Barber AE, Babbitt PC. 2012. Pythoscape: a framework for generation of large protein similarity networks. Bioinformatics 28:2845–2846. doi: 10.1093/bioinformatics/bts532 - DOI - PMC - PubMed
    1. Battye TG, Kontogiannis L, Johnson O, Powell HR, Leslie AG. 2011. iMOSFLM: a new graphical interface for diffraction-image processing with MOSFLM. Acta Crystallographica Section D, Biological Crystallography 67:271–281. doi: 10.1107/S0907444910048675 - DOI - PMC - PubMed

Publication types

Associated data