Gamma-tocotrienol and hydroxy-chavicol synergistically inhibits growth and induces apoptosis of human glioma cells
- PMID: 24980711
- PMCID: PMC4087240
- DOI: 10.1186/1472-6882-14-213
Gamma-tocotrienol and hydroxy-chavicol synergistically inhibits growth and induces apoptosis of human glioma cells
Abstract
Background: Gamma-tocotrienol (GTT), an isomer of vitamin E and hydroxy-chavicol (HC), a major bioactive compound in Piper betle, has been reported to possess anti-carcinogenic properties by modulating different cellular signaling events. One possible strategy to overcome multi-drug resistance and high toxic doses of treatment is by applying combinational therapy especially using natural bioactives in cancer treatment.
Methods: In this study, we investigated the interaction of GTT and HC and its mode of cell death on glioma cell lines. GTT or HC alone and in combination were tested for cytotoxicity on glioma cell lines 1321N1 (Grade II), SW1783 (Grade III) and LN18 (Grade IV) by [3-(4,5-dimethylthiazol-2- yl)-5-(3-carboxymethoxy-phenyl)-2-(4-sulfophenyl)- 2H- tetrazolium, inner salt] MTS assay. The interactions of each combination were evaluated by using the combination index (CI) obtained from an isobologram.
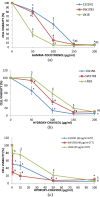
Results: Individually, GTT or HC displayed mild growth inhibitory effects against glioma cancer cell lines at concentration values ranging from 42-100 μg/ml and 75-119 μg/ml respectively. However, the combination of sub-lethal doses of GTT + HC dramatically enhanced the inhibition of glioma cancer cell proliferation and exhibited a strong synergistic effect on 1321N1 with CI of 0.55, and CI = 0.54 for SW1783. While in LN18 cells, moderate synergistic interaction of GTT + HC was observed with CI value of 0.73. Exposure of grade II, III and IV cells to combined treatments for 24 hours led to increased apoptosis as determined by annexin-V FITC/PI staining and caspase-3 apoptosis assay, showing caspase-3 activation of 27%, 7.1% and 79% respectively.
Conclusion: In conclusion, combined treatments with sub-effective doses of GTT and HC resulted in synergistic inhibition of cell proliferation through the induction of apoptosis of human glioma cells in vitro.
Figures


Similar articles
-
Transcriptome analysis reveals the molecular mechanisms of combined gamma-tocotrienol and hydroxychavicol in preventing the proliferation of 1321N1, SW1783, and LN18 glioma cancer cells.J Physiol Biochem. 2019 Nov;75(4):499-517. doi: 10.1007/s13105-019-00699-z. Epub 2019 Aug 14. J Physiol Biochem. 2019. PMID: 31414341
-
Hydroxychavicol as a potential anticancer agent (Review).Oncol Lett. 2022 Dec 5;25(1):34. doi: 10.3892/ol.2022.13620. eCollection 2023 Jan. Oncol Lett. 2022. PMID: 36589673 Free PMC article. Review.
-
Inhibitory Mechanism of Combined Hydroxychavicol With Epigallocatechin-3-Gallate Against Glioma Cancer Cell Lines: A Transcriptomic Analysis.Front Pharmacol. 2022 Mar 22;13:844199. doi: 10.3389/fphar.2022.844199. eCollection 2022. Front Pharmacol. 2022. PMID: 35392560 Free PMC article.
-
Tocotrienol-rich fraction, [6]-gingerol and epigallocatechin gallate inhibit proliferation and induce apoptosis of glioma cancer cells.Molecules. 2014 Sep 12;19(9):14528-41. doi: 10.3390/molecules190914528. Molecules. 2014. PMID: 25221872 Free PMC article.
-
Enhancement of apoptotic activities on brain cancer cells via the combination of γ-tocotrienol and jerantinine A.Phytomedicine. 2017 Jul 1;30:74-84. doi: 10.1016/j.phymed.2017.03.004. Epub 2017 Mar 10. Phytomedicine. 2017. PMID: 28545672
Cited by
-
Transcriptome analysis reveals the molecular mechanisms of combined gamma-tocotrienol and hydroxychavicol in preventing the proliferation of 1321N1, SW1783, and LN18 glioma cancer cells.J Physiol Biochem. 2019 Nov;75(4):499-517. doi: 10.1007/s13105-019-00699-z. Epub 2019 Aug 14. J Physiol Biochem. 2019. PMID: 31414341
-
Hydroxychavicol as a potential anticancer agent (Review).Oncol Lett. 2022 Dec 5;25(1):34. doi: 10.3892/ol.2022.13620. eCollection 2023 Jan. Oncol Lett. 2022. PMID: 36589673 Free PMC article. Review.
-
XIAP as a Target of New Small Organic Natural Molecules Inducing Human Cancer Cell Death.Cancers (Basel). 2019 Sep 9;11(9):1336. doi: 10.3390/cancers11091336. Cancers (Basel). 2019. PMID: 31505859 Free PMC article.
-
Inhibitory Mechanism of Combined Hydroxychavicol With Epigallocatechin-3-Gallate Against Glioma Cancer Cell Lines: A Transcriptomic Analysis.Front Pharmacol. 2022 Mar 22;13:844199. doi: 10.3389/fphar.2022.844199. eCollection 2022. Front Pharmacol. 2022. PMID: 35392560 Free PMC article.
-
Hydroxychavicol, a polyphenol from Piper betle leaf extract, induces cell cycle arrest and apoptosis in TP53-resistant HT-29 colon cancer cells.J Zhejiang Univ Sci B. 2021 Feb 15;22(2):112-122. doi: 10.1631/jzus.B2000446. J Zhejiang Univ Sci B. 2021. PMID: 33615752 Free PMC article.
References
-
- Wrensch M, Rice T, Miike R, McMillan A, Lamborn KR, Aldape K, Prados MD. Diagnostic, treatment, and demographic factors influencing survival in a population-based study of adult glioma patients in the San Francisco Bay Area. Neuro Oncol. 2006;8(1):12–26. doi: 10.1215/S1522851705000268. - DOI - PMC - PubMed
-
- Miller CR, Perry A. Glioblastoma. Arch Pathol Lab Med. 2007;131(3):397–406. - PubMed
-
- Stupp R, Hegi ME, Mason WP, van den Bent MJ, Taphoorn MJ, Janzer RC, Ludwin SK, Allgeier A, Fisher B, Belanger K, Hau P, Brandes AA, Gijtenbeek J, Marosi C, Vecht CJ, Mokhtari K, Wesseling P, Villa S, Eisenhauer E, Gorlia T, Weller M, Lacombe D, Cairncross JG, Mirimanoff RO. Effects of radiotherapy with concomitant and adjuvant temozolomide versus radiotherapy alone on survival in glioblastoma in a randomised phase III study: 5-year analysis of the EORTC-NCIC trial. Lancet Oncol. 2009;10(5):459–466. doi: 10.1016/S1470-2045(09)70025-7. - DOI - PubMed
-
- Wagner H, Ulrich-Merzenich G. Synergy research: approaching a new generation of phytopharmaceuticals. Phytomedicine. 2009;16(2–3):97–110. - PubMed
Publication types
MeSH terms
Substances
LinkOut - more resources
Full Text Sources
Other Literature Sources
Medical
Research Materials
Miscellaneous

