Comparative Study
. 2014 Sep;109(9):1304-11.
doi: 10.1038/ajg.2014.29. Epub 2014 Jul 1.

Patient perception of treatment burden is high in celiac disease compared with other common conditions

Affiliations
Comparative Study

Patient perception of treatment burden is high in celiac disease compared with other common conditions

Sveta Shah et al. Am J Gastroenterol. 2014 Sep.

Abstract

Objectives: The only treatment for celiac disease (CD) is life-long adherence to a gluten-free diet (GFD). Noncompliance is associated with signs and symptoms of CD, yet long-term adherence rates are poor. It is not known how the burden of the GFD compares with other medical treatments, and there are limited data on the socioeconomic factors influencing treatment adherence. In this study, we compared treatment burden and health state in CD compared with other chronic illnesses and evaluated the relationship between treatment burden and adherence.

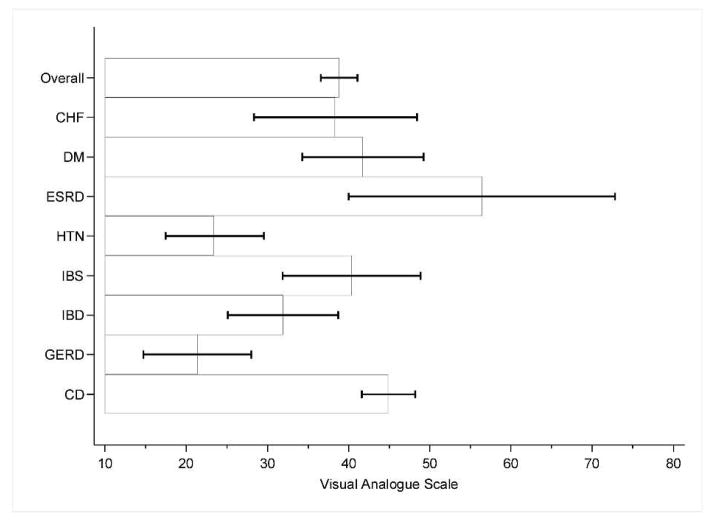
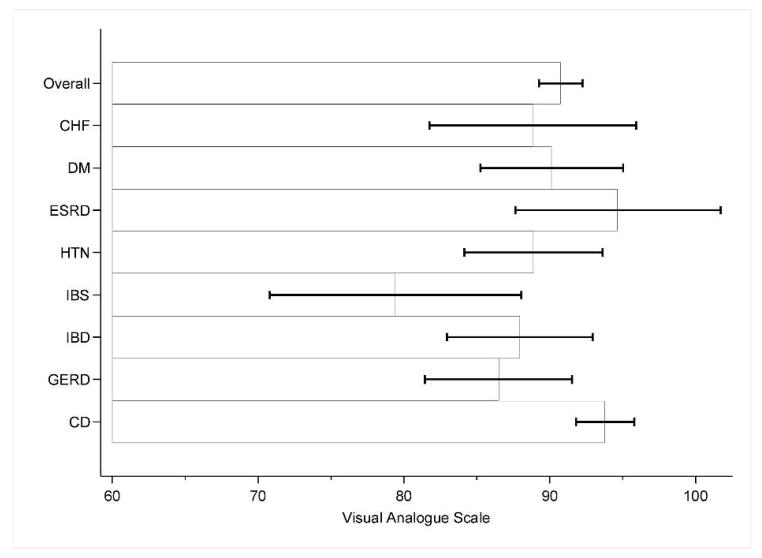
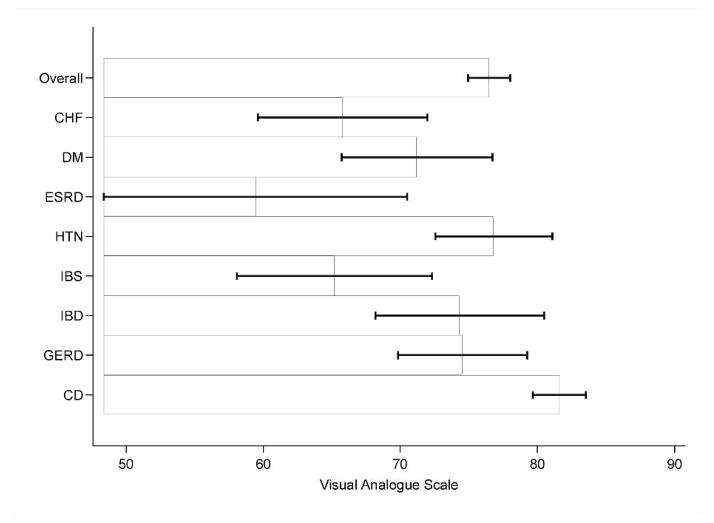
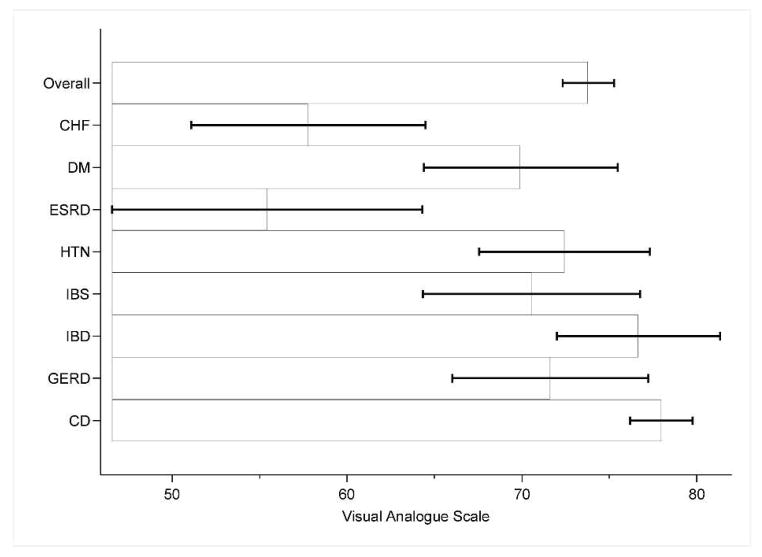
Methods: Survey was mailed to participants with CD, gastroesophageal reflux disease (GERD), irritable bowel syndrome, inflammatory bowel disease, hypertension (HTN), diabetes mellitus (DM), congestive heart failure, and end-stage renal disease (ESRD) on dialysis. Surveys included demographic information and visual analog scales measuring treatment burden, importance of treatment, disease-specific health status, and overall health status.

Results: We collected surveys from 341 celiac and 368 non-celiac participants. Celiac participants reported high treatment burden, greater than participants with GERD or HTN and comparable to ESRD. Conversely, patients with CD reported the highest health state of all groups. Factors associated with high treatment burden in CD included poor adherence, concern regarding food cost, eating outside the home, higher income, lack of college education, and time limitations in preparing food. Poor adherence in CD was associated with increased symptoms, income, and low perceived importance of treatment.

Conclusions: Participants with CD have high treatment burden but also excellent overall health status in comparison with other chronic medical conditions. The significant burden of dietary therapy for CD argues for the need for safe adjuvant treatment, as well as interventions designed to lower the perceived burden of the GFD.


Conflict of interest statement

Conflicts of interest: Sveta Shah, Mona Akbari, Rohini Vanga, Joshua Hansen, Arjun Bhansali, Sohaib Tariq, Melinda Dennis: None

Ciarán P. Kelly: None

Daniel Leffler: consulting and/or research support from: Shire Therapeutics, Prometheus Laboratories, Alba Pharmaceuticals, Alvine Therapeutics

Figures

Figure 1
Figure 1
Treatment burden of celiac disease in comparison with non-celiac chronic illnesses *CD= Celiac disease, HTN= Hypertension, DM=Diabetes Mellitus, CHF=Congestive heart failure, ESRD=End-stage renal disease, GERD=gastroesophageal reflux disease, IBD=inflammatory bowel disease, IBS=irritable bowel syndrome **VAS: score of zero=very easy, score of one hundred=very difficult ***Mean Scores: CD 44.9 (SD 30.9), GERD 21.3 (SD 25.3), HTN 23.5 (SD 25.7), IBD 31.9 (SD 27.7), CHF 38.5 (SD 31), IBS 40.4 (SD 24.4), DM 41.7 (SD 30.4), ESRD 56.4 (SD 31.9) ****Based on results of post-hoc multiple comparisons, treatment burden was statistically significant for the following groups: CD vs GERD (p value < 0.001), CD vs HTN (p value < 0.001), GERD vs ESRD (p value 0.01), GERD vs DM (p value 0.04). Error bars represent 95% confidence intervals.
Figure 2
Figure 2
Perceived importance of treatment of celiac disease in comparison with non-celiac chronic illnesses *CD= Celiac disease, HTN= Hypertension, DM=Diabetes Mellitus, CHF=Congestive heart failure, ESRD=End-stage renal disease, GERD=gastroesophageal reflux disease, IBD=inflammatory bowel disease, IBS=irritable bowel syndrome **VAS: score of zero=not important at all, score of one hundred=very important ***Mean Scores: CD 93.8 (SD 18.6), HTN 88.9 (SD 20.4), GERD 86.5 (SD 19.7), IBD 88.0 (SD 19.9), CHF 88.8 (SD 22.4), IBS 79.4 (SD 25.5), DM 90.1(SD 20.4), ESRD 94.7 (SD 14.2) ****Based on results of post-hoc multiple comparisons, importance of treatment was statistically significant for the following groups: CD vs IBS (p value 0.016). Error bars represent 95% confidence intervals.
Figure 3
Figure 3
Perceived disease-specific health of celiac disease in comparison with non-celiac chronic illnesses *CD= Celiac disease, HTN= Hypertension, DM=Diabetes Mellitus, CHF=Congestive heart failure, ESRD=End-stage renal disease, GERD=gastroesophageal reflux disease, IBD=inflammatory bowel disease, IBS=irritable bowel syndrome **VAS: score of zero=best imaginable health, score of one hundred=worst imaginable health ***Mean Scores: CD 81.6 (SD 18), GERD 74.6 (SD 18.4), HTN 76.8(18.4), IBD 74.3 (SD 24.9), CHF 65.8 (SD 19.4), IBS 65.2 (SD 20.7), DM 71.2 (SD 22.7), ESRD 59.4 (SD 22.2) ****Based on results of post-hoc multiple comparisons, disease specific health was statistically significant for the following groups: CD vs IBS (p value 0.003), CD vs ESRD (p value 0.003), CD vs DM (p value 0.028), CD vs CHF (p value 0.002). Error bars represent 95% confidence intervals.
Figure 4
Figure 4
Perceived overall health state of celiac disease in comparison with non-celiac chronic illnesses *CD= Celiac disease, HTN= Hypertension, DM=Diabetes Mellitus, CHF=Congestive heart failure, ESRD=End-stage renal disease, GERD=gastroesophageal reflux disease, IBD=inflammatory bowel disease, IBS=irritable bowel syndrome **VAS: score of zero=best imaginable health, score of one hundred=worst imaginable health ***Mean Scores: CD 78 (SD 16.7), GERD 71.6 (SD 21.6) ,HTN 72.4 (SD 20.9), IBD 76.7 (SD 19.1), CHF 57.8 (SD 21.2), IBS 70.5 (SD 18.1), DM 69.9 (SD 23), ESRD 55.4 (SD 17.8) ****Based on results of post-hoc multiple comparisons, overall health was statistically significant for the following groups: CD vs ESRD (p value 0.001), CD vs CHF (p value < 0.001), IBD vs ESRD (p value 0.014), IBD vs CHF (p value 0.001), HTN vs CHF (p value 0.029). Error bars represent 95% confidence intervals.

References

    1. Lohi S, Mustalahti K, Kaukinen K, Laurila K, Collin P, Rissanen H, et al. Increasing prevalence of coeliac disease over time. Alimentary Pharmacology & Therapeutics. 2007;26(9):1217–25. - PubMed
    1. Fasano A, Berti I, Gerarduzzi T, Not T, Colletti RB, Drago S, et al. Prevalence of celiac disease in at-risk and not-at-risk groups in the United States: a large multicenter study. Archives of Internal Medicine. 2003;163(3):286–92. - PubMed
    1. Farrell RJ, Kelly CP. Celiac sprue. The New England journal of medicine. 2002;346(3):180–8. - PubMed
    1. Rubio-Tapia A, Ludvigsson JF, Brantner TL, Murray JA, Everhart JE. The prevalence of celiac disease in the United States. Am J Gastroenterol. 2012;107(10):1538–44. quiz 7, 45. - PubMed
    1. Gujral N, Freeman HJ, Thomson AB. Celiac disease: prevalence, diagnosis, pathogenesis and treatment. World J Gastroenterol. 2012;18(42):6036–59. - PMC - PubMed

Publication types

MeSH terms