

Pleiotropic genes for metabolic syndrome and inflammation
- PMID: 24981077
- PMCID: PMC4122618
- DOI: 10.1016/j.ymgme.2014.04.007
Pleiotropic genes for metabolic syndrome and inflammation
Abstract
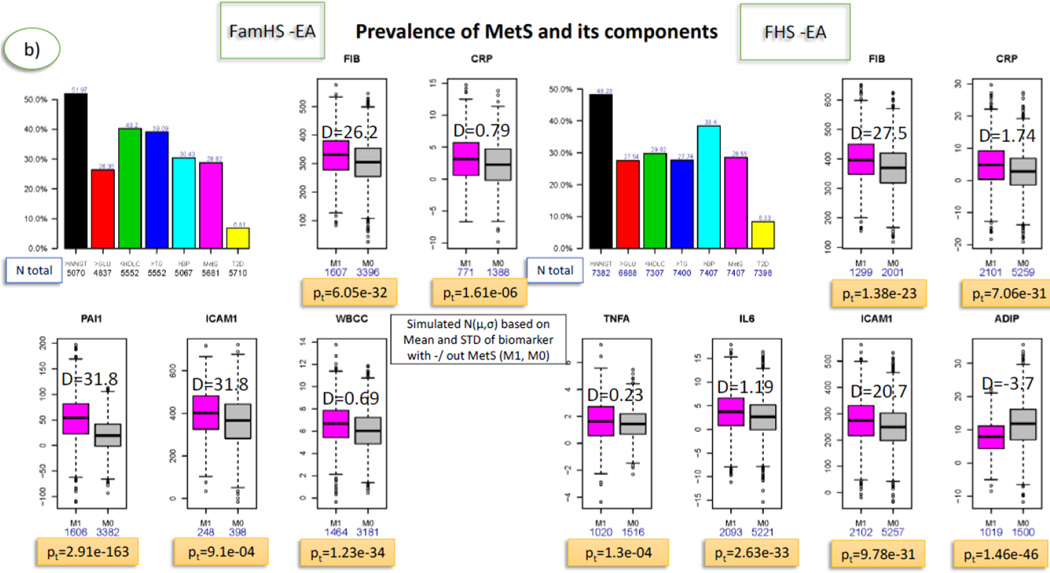
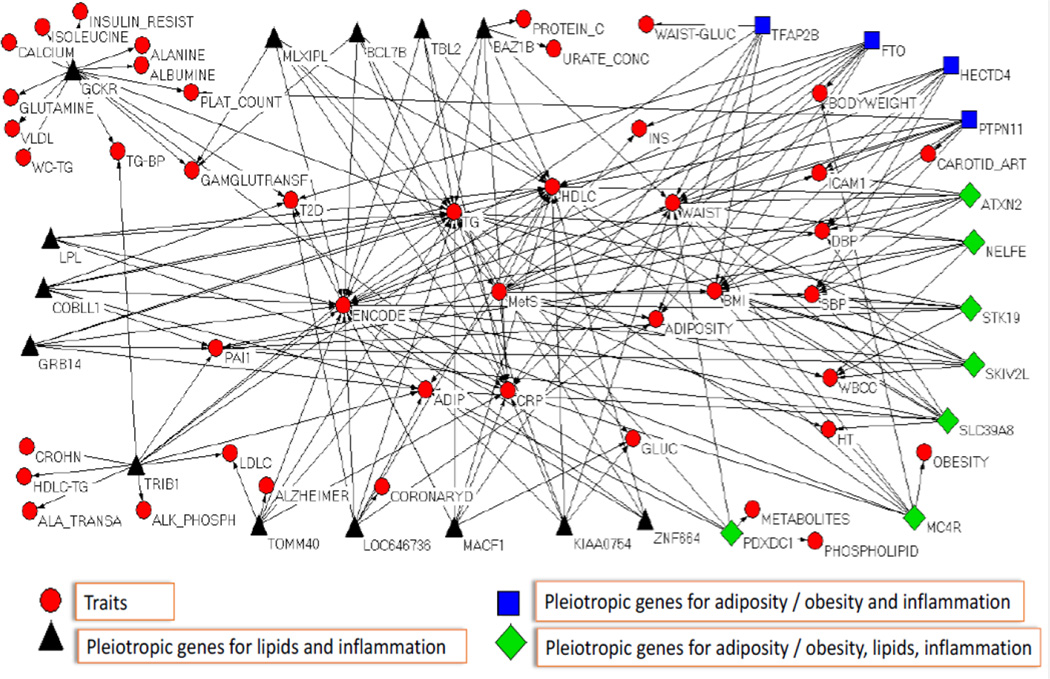
Metabolic syndrome (MetS) has become a health and financial burden worldwide. The MetS definition captures clustering of risk factors that predict higher risk for diabetes mellitus and cardiovascular disease. Our study hypothesis is that additional to genes influencing individual MetS risk factors, genetic variants exist that influence MetS and inflammatory markers forming a predisposing MetS genetic network. To test this hypothesis a staged approach was undertaken. (a) We analyzed 17 metabolic and inflammatory traits in more than 85,500 participants from 14 large epidemiological studies within the Cross Consortia Pleiotropy Group. Individuals classified with MetS (NCEP definition), versus those without, showed on average significantly different levels for most inflammatory markers studied. (b) Paired average correlations between 8 metabolic traits and 9 inflammatory markers from the same studies as above, estimated with two methods, and factor analyses on large simulated data, helped in identifying 8 combinations of traits for follow-up in meta-analyses, out of 130,305 possible combinations between metabolic traits and inflammatory markers studied. (c) We performed correlated meta-analyses for 8 metabolic traits and 6 inflammatory markers by using existing GWAS published genetic summary results, with about 2.5 million SNPs from twelve predominantly largest GWAS consortia. These analyses yielded 130 unique SNPs/genes with pleiotropic associations (a SNP/gene associating at least one metabolic trait and one inflammatory marker). Of them twenty-five variants (seven loci newly reported) are proposed as MetS candidates. They map to genes MACF1, KIAA0754, GCKR, GRB14, COBLL1, LOC646736-IRS1, SLC39A8, NELFE, SKIV2L, STK19, TFAP2B, BAZ1B, BCL7B, TBL2, MLXIPL, LPL, TRIB1, ATXN2, HECTD4, PTPN11, ZNF664, PDXDC1, FTO, MC4R and TOMM40. Based on large data evidence, we conclude that inflammation is a feature of MetS and several gene variants show pleiotropic genetic associations across phenotypes and might explain a part of MetS correlated genetic architecture. These findings warrant further functional investigation.
Keywords: Inflammatory markers; Meta-analysis; Metabolic syndrome; Pleiotropic associations; Regulome.
Copyright © 2014 Elsevier Inc. All rights reserved.
Conflict of interest statement
All authors have no conflict of interest to declare.
Figures
References
-
- Grundy SM, Hansen B, Smith SC, Jr, Cleeman JI, Kahn RA. A. American Heart, L. National Heart, I. Blood, A. American Diabetes, Clinical management of metabolic syndrome: report of the American Heart Association/National Heart, Lung, and Blood Institute/American Diabetes Association conference on scientific issues related to management. Circulation. 2004;109:551–556. - PubMed
-
- Galassi A, Reynolds K, He J. Metabolic syndrome and risk of cardiovascular disease: a meta-analysis. The American journal of medicine. 2006;119:812–819. - PubMed
-
- Eckel RH, Grundy SM, Zimmet PZ. The metabolic syndrome. Lancet. 2005;365:1415–1428. - PubMed
Publication types
MeSH terms
Substances
Grants and funding
- U10 HL054464/HL/NHLBI NIH HHS/United States
- N01-HC-95100/HC/NHLBI NIH HHS/United States
- 1R01 HL64753/HL/NHLBI NIH HHS/United States
- R01 DK078616/DK/NIDDK NIH HHS/United States
- UL1 TR000430/TR/NCATS NIH HHS/United States
- N02-HL-6-4278/HL/NHLBI NIH HHS/United States
- R01 HL071025/HL/NHLBI NIH HHS/United States
- N01-HC-25195/HC/NHLBI NIH HHS/United States
- N01 HC045204/HL/NHLBI NIH HHS/United States
- HL081331/HL/NHLBI NIH HHS/United States
- N01 HC095095/HL/NHLBI NIH HHS/United States
- N01-HC-45205/HC/NHLBI NIH HHS/United States
- Z01 AG000932/ImNIH/Intramural NIH HHS/United States
- N01-HC-05187/HC/NHLBI NIH HHS/United States
- HL054481/HL/NHLBI NIH HHS/United States
- HL59684/HL/NHLBI NIH HHS/United States
- N01 HC048048/HL/NHLBI NIH HHS/United States
- K12 CA139160/CA/NCI NIH HHS/United States
- HL071025-01A1/HL/NHLBI NIH HHS/United States
- 1R01 AG028321/AG/NIA NIH HHS/United States
- N01-HC-48047/HC/NHLBI NIH HHS/United States
- UL1 TR001079/TR/NCATS NIH HHS/United States
- R01 HL092577/HL/NHLBI NIH HHS/United States
- R01 HL043851/HL/NHLBI NIH HHS/United States
- R01 HL087660/HL/NHLBI NIH HHS/United States
- N01-HC-45204/HC/NHLBI NIH HHS/United States
- P30 DK079637/DK/NIDDK NIH HHS/United States
- N01 HC048049/HL/NHLBI NIH HHS/United States
- Z01-AG000932-06/AG/NIA NIH HHS/United States
- R01 HL076784/HL/NHLBI NIH HHS/United States
- N01-HC-95095/HC/NHLBI NIH HHS/United States
- M01-RR000052/RR/NCRR NIH HHS/United States
- UL1 TR000124/TR/NCATS NIH HHS/United States
- HL58625-01A1/HL/NHLBI NIH HHS/United States
- R01 DK075681/DK/NIDDK NIH HHS/United States
- U01 HL054464/HL/NHLBI NIH HHS/United States
- MC_UU_12015/1/MRC_/Medical Research Council/United Kingdom
- N01-HC-48050/HC/NHLBI NIH HHS/United States
- N01 HC045205/HL/NHLBI NIH HHS/United States
- MC_U106179471/MRC_/Medical Research Council/United Kingdom
- U10 HL054481/HL/NHLBI NIH HHS/United States
- CA047988/CA/NCI NIH HHS/United States
- U10 HL054457/HL/NHLBI NIH HHS/United States
- P30 DK063491/DK/NIDDK NIH HHS/United States
- 1R01DK8925601/DK/NIDDK NIH HHS/United States
- P20 MD006899/MD/NIMHD NIH HHS/United States
- U01 HL108630/HL/NHLBI NIH HHS/United States
- N01 HC025195/HL/NHLBI NIH HHS/United States
- U01 HL081331/HL/NHLBI NIH HHS/United States
- HL054464/HL/NHLBI NIH HHS/United States
- HL087660/HL/NHLBI NIH HHS/United States
- U01 HL054457/HL/NHLBI NIH HHS/United States
- G0701863/MRC_/Medical Research Council/United Kingdom
- M01 RR000052/RR/NCRR NIH HHS/United States
- N01-HC-48049/HC/NHLBI NIH HHS/United States
- K24 DK080140/DK/NIDDK NIH HHS/United States
- N01 HC005187/HL/NHLBI NIH HHS/United States
- N01 HC045134/HC/NHLBI NIH HHS/United States
- R01DK075681/DK/NIDDK NIH HHS/United States
- U01 HL72518/HL/NHLBI NIH HHS/United States
- 090532/WT_/Wellcome Trust/United Kingdom
- NR0224103/NR/NINR NIH HHS/United States
- N01 HC048047/HL/NHLBI NIH HHS/United States
- U01 HL072518/HL/NHLBI NIH HHS/United States
- HL054457/HL/NHLBI NIH HHS/United States
- R01 CA047988/CA/NCI NIH HHS/United States
- R01 HL059684/HL/NHLBI NIH HHS/United States
- R01 HL080467/HL/NHLBI NIH HHS/United States
- R01 DK089256/DK/NIDDK NIH HHS/United States
- N01 HC048050/HL/NHLBI NIH HHS/United States
- HL080467/HL/NHLBI NIH HHS/United States
- U01 HL054481/HL/NHLBI NIH HHS/United States
- N01-HC-48048/HC/NHLBI NIH HHS/United States
- R21 AR056405/AR/NIAMS NIH HHS/United States
- R01 HL117078/HL/NHLBI NIH HHS/United States
- 1R01HL092577/HL/NHLBI NIH HHS/United States
- R01 AG028321/AG/NIA NIH HHS/United States
LinkOut - more resources
Full Text Sources
Other Literature Sources
Medical
Miscellaneous
