. 2014 Jul 10;8(1):75-83.
doi: 10.1016/j.celrep.2014.05.053. Epub 2014 Jun 26.

Transcription factors modulate c-Fos transcriptional bursts

Affiliations

Transcription factors modulate c-Fos transcriptional bursts

Adrien Senecal et al. Cell Rep. .

Abstract

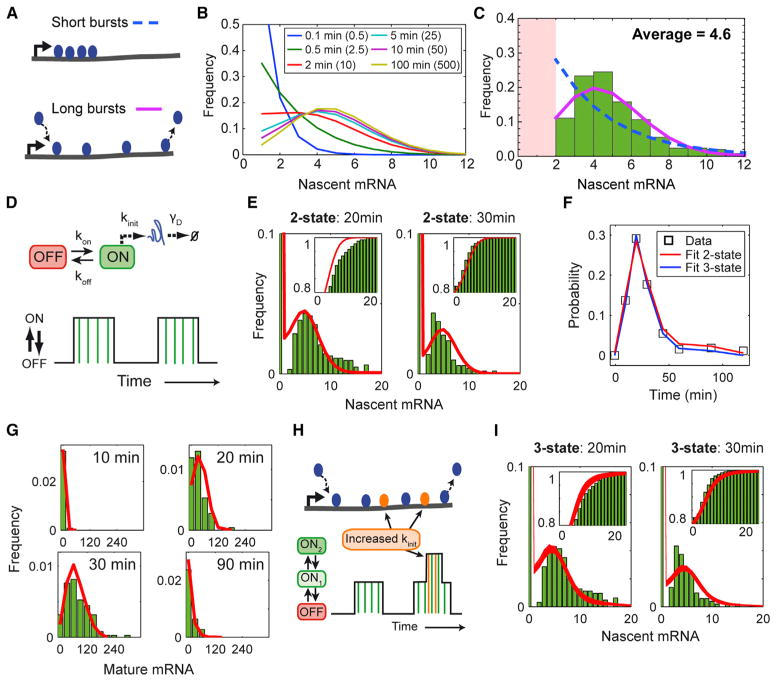
Transcription is a stochastic process occurring mostly in episodic bursts. Although the local chromatin environment is known to influence the bursting behavior on long timescales, the impact of transcription factors (TFs)--especially in rapidly inducible systems--is largely unknown. Using fluorescence in situ hybridization and computational models, we quantified the transcriptional activity of the proto-oncogene c-Fos with single mRNA accuracy at individual endogenous alleles. We showed that, during MAPK induction, the TF concentration modulates the burst frequency of c-Fos, whereas other bursting parameters remain mostly unchanged. By using synthetic TFs with TALE DNA-binding domains, we systematically altered different aspects of these bursts. Specifically, we linked the polymerase initiation frequency to the strength of the transactivation domain and the burst duration to the TF lifetime on the promoter. Our results show how TFs and promoter binding domains collectively act to regulate different bursting parameters, offering a vast, evolutionarily tunable regulatory range for individual genes.


Figures

Figure 1
Figure 1. Quantification of c-Fos Transcriptional Response after Different Stimuli
(A) smFISH in U2OS 30 min after serum induction. Signal in proximity of the transcription sites (TSs) appears only saturated due to scaling to show individual mature mRNA. Scale bars, 10 μm in all figures. Surface plot (not to scale) for area indicated with red dashed line. Detected mature mRNAs shown as green spots over DAPI image. (B) Average mature mRNA levels at different time points after serum induction (left) and zinc concentration (right) by smFISH (red line) and qRT-PCR (blue line). Error bars are 95% CI obtained by bootstrap for smFISH and SD for qRT-PCR (three independent experiments). (C) Selected histograms of smFISH measurement from (B). Cells containing less than 20 mRNAs are show in orange and other cells in green. (D) Number of active TS after serum (left) or zinc induction (right). Cells containing no active TS are not shown. Inset shows average number of active TS per cell. (E) Immunofluorescence (IF) against p-ERK or p-p38 (red) for indicated induction condition and nuclei visualized with DAPI (blue). Note that only one cell has elevated p-p38 levels in the 50 μM picture. (F) Average p-ERK levels (red) and average number of active TS per cell (blue line) after serum induction. (G) Proportion of cells with elevated p-p38 signal (red line) and average number of active TS per cell (blue line). See also Figure S1 and Movie S1.
Figure 2
Figure 2. MAPK Phosphorylation Level Controls the Burst Frequency
(A) smFISH against c-Fos (green) combined with IF against p-p38 (red) in U2OS cells 4 hr after induction with 150 μM of zinc. Nuclei are stained with DAPI (blue). (B) Average number of active TS per cell increases with the average p-p38 level. Cells were pooled in five bins based on their p-p38 levels containing the same number of cells as indicated with black bars in (C) and (E). (C) Mature mRNA number as a function of p-p38 levels (Pearson’s correlation coefficient of 0.51). (D) Histogram of mature mRNA data shown with same bins as used in (B). (E and F) Nascent mRNA number per active TS plotted as function of p-p38 levels (Pearson’s correlation coefficient of −0.02). (F) Same binning as in (B). All error bars are SEM. See also Figure S2.
Figure 3
Figure 3. Mathematical Modeling of Transcriptional Response of c-Fos after Serum Induction
(A) Cartoons illustrating concept of burst saturation limit. For short bursts below the saturation limit (upper plot), mRNA attached to all the loaded polymerases can be observed. For burst in the saturation limit (lower plot), only the mRNA produced by the currently loaded polymerases can be detected. (B) Impact of burst duration on nascent mRNA distribution. Curves share same initiation rate (five mRNA/minute) and burst frequency (0.1 burst/minute) but differ in burst duration as indicated in figure legend. Values in parenthesis indicate average number of mRNAs produced per burst, i.e., the burst amplitude. (C) Histogram of pooled nascent mRNA numbers from all induction condition (serum and zinc) except identified outliers in Figure S3C. Fit with Poisson distribution (pink solid line; log-likelihood of fit = −536) and truncated geometric distribution (dashed blue line; log-likelihood of fit = −705). (D) Two-state model of transcription. Gene can switch between inactive (OFF) and active (ON) state. Transitions are described by rate constants kon and koff. Transcripts are produced during ON states as a Poisson process with fixed rate, kinit (vertical green bars in lower plot). Each mRNA undergoes a production period modeled as an irreversible process with fixed completion time, tprod and mature mRNA degrades as a first-order reaction with the constant γD. (E–G) Fit with two-state model (Parameters from fit L2-8 in Table S1). (E) Fit of nascent mRNA data (green histogram) with two-state model (red line). Insets show cumulative histograms. (F) Probability for one TS to be active (black squares) together with prediction of two-state (red) and three-state model (blue). (G) Fit of mature mRNA data (green histogram) with two-state model (red line). (H) Three-state model of transcription. A second ON state with a higher initiation frequency can be reached from the first ON state. (I) Fits of nascent mRNA data (green histogram) with three-state model (red lines). Each line represents an individual fit with parameters defined in Table S2. Insets show cumulative histograms. See also Figure S3.
Figure 4
Figure 4. Activation of c-Fos with Synthetic Transcription Factors
(A) c-Fos promoter with different synthetic TFs (TALE) binding sites indicated by letters A–D. SRE, serum response element. Different activator domain (AD, in red) were fused to the TALE: VP16 or VP64. (B) Histogram of nascent c-Fos mRNA levels after transfection with one TALE-VP16, one TALE-VP64, or four TALE-VP16. Red lines are model curves (Table S3). Curves for VP64 and 4xVP16 are obtained by changing only one parameter indicated in red in cartoon compared to VP1. See also Figure S4.
Figure 5
Figure 5. Role for TFs in Shaping c-Fos Transcriptional Bursts
Model that illustrates how TFs can act on multiple key aspects of transcriptional burst. Increase of TF concentration yields increase of burst frequency (kon, green); duration of TF binding event with DNA binding domain (DBD) affects burst duration (koff, blue); strength of the activator domain (AD) influences initiation rate (kinit, red).

References

    1. Adelman K, Lis JT. Promoter-proximal pausing of RNA polymerase II: emerging roles in metazoans. Nat Rev Genet. 2012;13:720–731. - PMC - PubMed
    1. Annibale P, Gratton E. Advanced fluorescence microscopy methods for the real-time study of transcription and chromatin dynamics. Transcription. 2014;5:5. - PMC - PubMed
    1. Brown CR, Mao C, Falkovskaia E, Jurica MS, Boeger H. Linking stochastic fluctuations in chromatin structure and gene expression. PLoS Biol. 2013;11:e1001621. - PMC - PubMed
    1. Carey M, Lin YS, Green MR, Ptashne M. A mechanism for synergistic activation of a mammalian gene by GAL4 derivatives. Nature. 1990;345:361–364. - PubMed
    1. Cermak T, Doyle EL, Christian M, Wang L, Zhang Y, Schmidt C, Baller JA, Somia NV, Bogdanove AJ, Voytas DF. Efficient design and assembly of custom TALEN and other TAL effector-based constructs for DNA targeting. Nucleic Acids Res. 2011;39:e82–e82. - PMC - PubMed

Publication types