. 2014 Jul 15;111(28):E2895-904.
doi: 10.1073/pnas.1321869111. Epub 2014 Jun 30.

Activity-dependent dendritic spine neck changes are correlated with synaptic strength

Affiliations

Activity-dependent dendritic spine neck changes are correlated with synaptic strength

Roberto Araya et al. Proc Natl Acad Sci U S A. .

Abstract

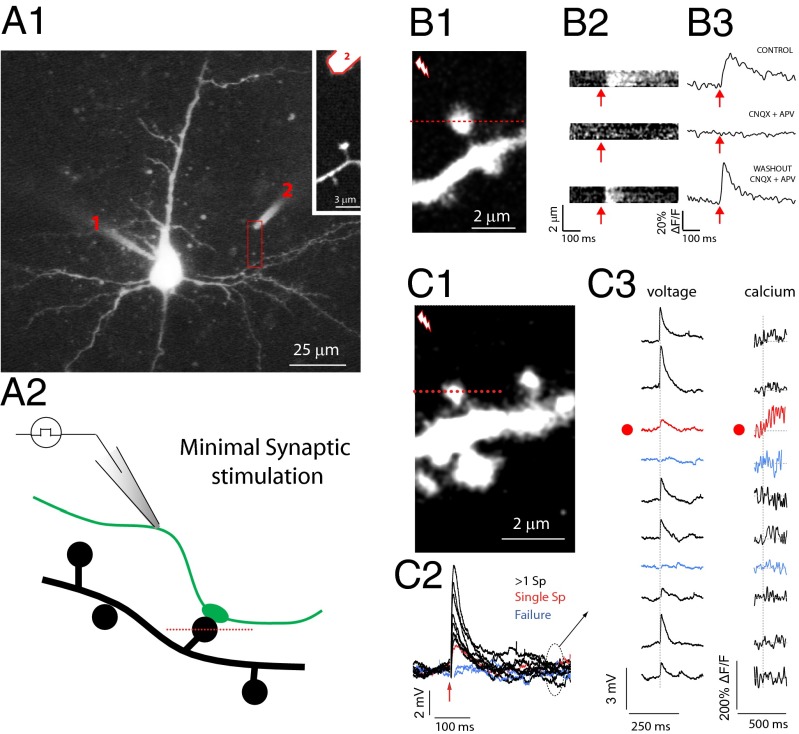
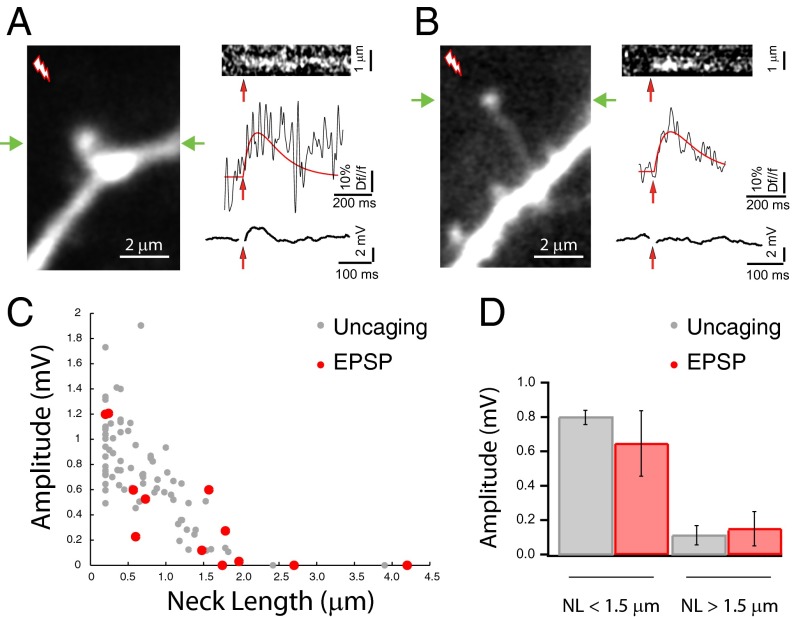
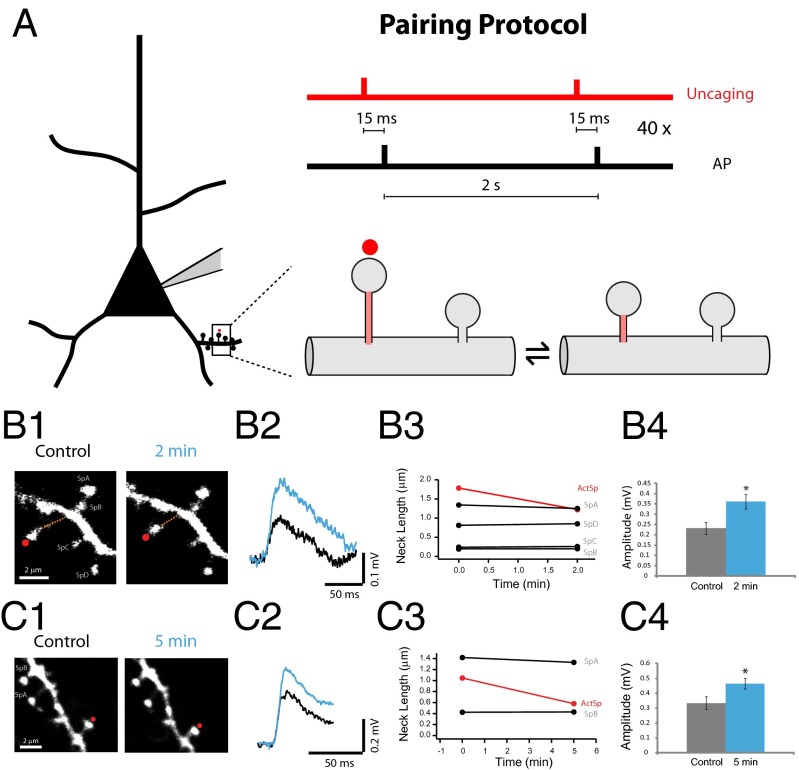
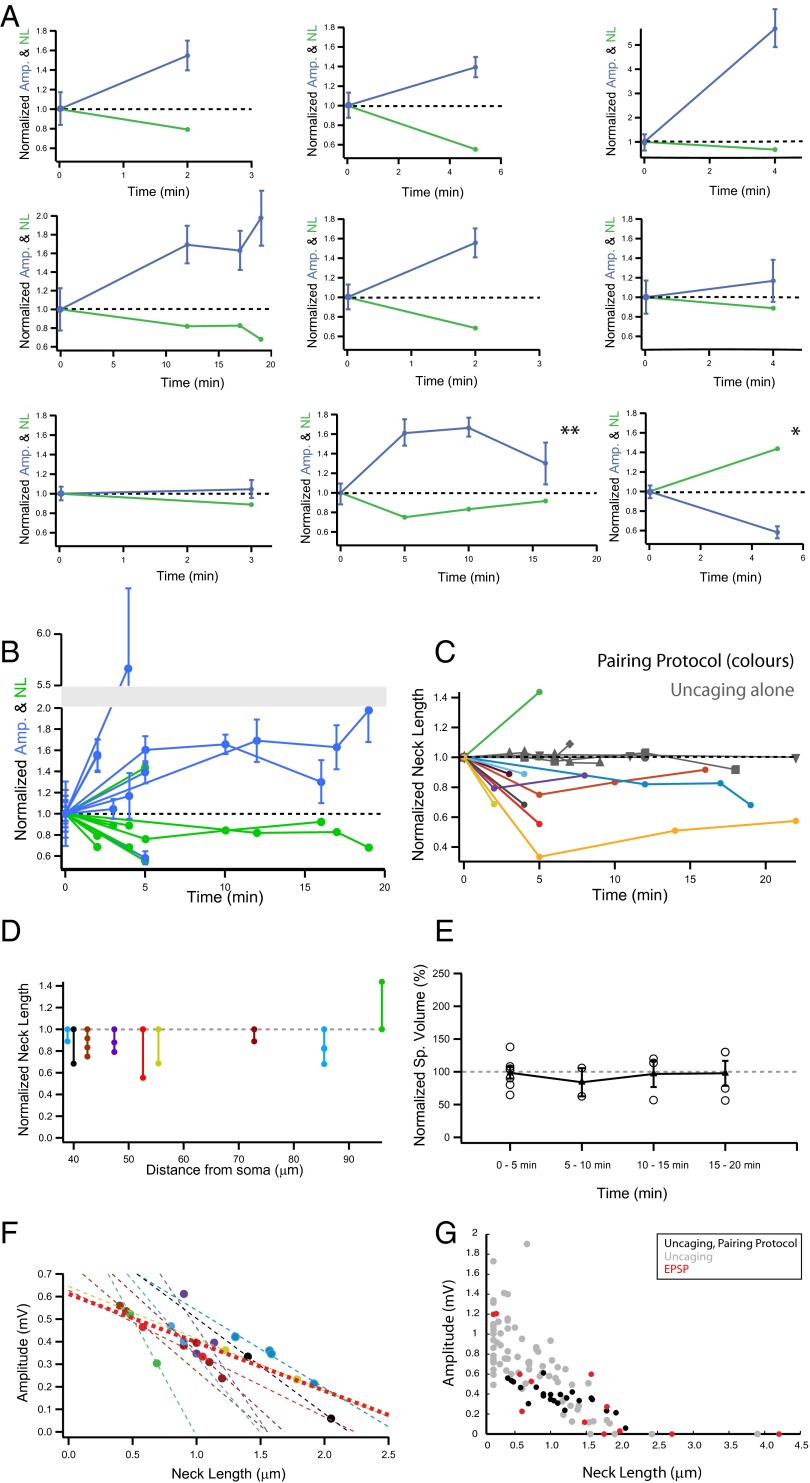
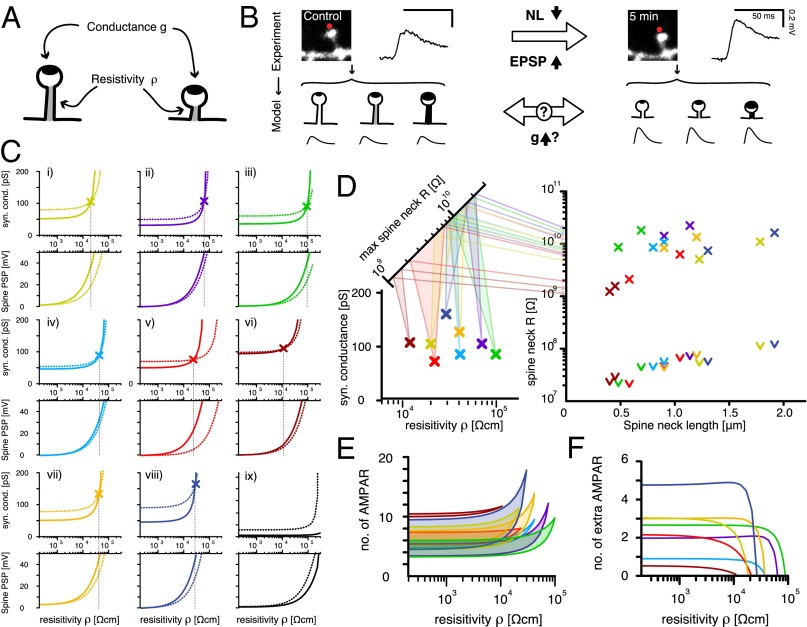
Most excitatory inputs in the mammalian brain are made on dendritic spines, rather than on dendritic shafts. Spines compartmentalize calcium, and this biochemical isolation can underlie input-specific synaptic plasticity, providing a raison d'etre for spines. However, recent results indicate that the spine can experience a membrane potential different from that in the parent dendrite, as though the spine neck electrically isolated the spine. Here we use two-photon calcium imaging of mouse neocortical pyramidal neurons to analyze the correlation between the morphologies of spines activated under minimal synaptic stimulation and the excitatory postsynaptic potentials they generate. We find that excitatory postsynaptic potential amplitudes are inversely correlated with spine neck lengths. Furthermore, a spike timing-dependent plasticity protocol, in which two-photon glutamate uncaging over a spine is paired with postsynaptic spikes, produces rapid shrinkage of the spine neck and concomitant increases in the amplitude of the evoked spine potentials. Using numerical simulations, we explore the parameter regimes for the spine neck resistance and synaptic conductance changes necessary to explain our observations. Our data, directly correlating synaptic and morphological plasticity, imply that long-necked spines have small or negligible somatic voltage contributions, but that, upon synaptic stimulation paired with postsynaptic activity, they can shorten their necks and increase synaptic efficacy, thus changing the input/output gain of pyramidal neurons.

Keywords: STDP; basal dendrites; neocortex.


Conflict of interest statement

The authors declare no conflict of interest.

Figures

Fig. 1.
Fig. 1.
Spine responses to minimal stimulation. (A1) A layer-5 pyramidal cell loaded with Alexa 488 (200 µM) and fluo-4 (200 µM) with a patch electrode (1). A stimulating electrode (2) filled with Alexa 594 dextran (10,000 MW, 50 μM), was located close (∼4–20 μm) to spines of basal dendrites to increase the likelihood of activating an axon contacting the imaged spine. (A2) Diagram of the experiment. Brief current pulses were delivered to a stimulating electrode while voltage responses (recorded at the soma) and calcium signals (fluorescence signal arising from line scans intersecting the spine head) were simultaneously imaged. (B1) Two-photon fluorescent image of a spine from an experiment similar to the one shown in A1. (B2) Average of line scans through the spine head shown in 1 before (Top) and after (Middle) perfusion with the NMDA and AMPA receptor antagonist DL-2-amino-5-phosphonopentanoic acid (d-APV) (40 µM) and 6-cyano-7-nitroquinoxaline-2,3-dione (CNQX) (10 μM), respectively, and after washout (Bottom). (B3) Calcium accumulations under the three conditions shown in B2. (C1) The spine intersected by a red dotted line in the fluorescence image was imaged while stimulating a nearby axon. (C2) voltage traces recorded after minimal synaptic stimulation of the spine crossed by a red dotted line in C1. Failures (blue), minimal (red), and bigger-than-minimal voltage responses (black) were evident. (C3) Sequence of voltage traces and calcium signals recorded from the spine head. Note that the minimal voltage response corresponded with a clear calcium response from the imaged spine head (red dot and red traces).
Fig. 2.
Fig. 2.
Inverse correlation between EPSP amplitude and spine neck length. (A) Synaptic activation of a short-necked spine generated a clear calcium response at the spine head and a clear minimal stimulation voltage deflection at the soma. (B) Synaptic activation of a single long-necked spine generated a clear calcium response at its head, but no voltage deflection at the soma. Green arrows in A and B mark the line scan intersecting the spine head. (C) Amplitude of the voltage response generated by minimal stimulation in a spine plotted vs. neck length (red dots), and uncaging potential amplitudes plotted vs. neck length (46) (gray dots). (D) Graph shows that the amplitude of voltage responses from short-necked spines (neck length <1.5 μm) is significantly reduced (P < 0.01) relative to long-necked spines (neck length >1.5 μm) upon activation by minimal stimulation (red bars) or two-photon uncaging of glutamate (gray bars), and no statistical difference was detected between uncaging and minimal stimulation synaptic responses (see text for values).
Fig. 3.
Fig. 3.
Spine neck plasticity induced by pairing glutamate uncaging and bAPs. (A) Schematic of the experiment. (B1) Example of a long-necked spine before and after the pairing protocol. (B2) Average uncaging potentials from the spine in B1 before (black) and after (blue) the pairing protocol. (B3) Neck-length changes in the stimulated spine (red) and in the four neighboring spines (black, SpA–D). (B4) Peak amplitude of the voltage responses before (black) and after (blue) the pairing protocol. P < 0.05 (*). (C1) Example of a spine with shorter neck than the one in B, before and after the pairing protocol. (C2) Average uncaging potentials from the spine in C1 before (black) and after (blue) the pairing protocol. (C3). Neck-length changes in the stimulated spine (red) and in the two neighboring spines (black, SpA and B). (C4) Peak amplitude of the voltage responses before (black) and after (blue) the pairing protocol. *P < 0.05.
Fig. 4.
Fig. 4.
Spine neck shortening after STDP is correlated with larger uncaging potentials. (A) Individual spine data: neck length and amplitude vs. time before (time 0) and after the pairing protocol. (B) Pooled data from A. (C) Time course of effect. Pooled data from spines that experienced both uncaging of MNI-glutamate and bAPs (colored markers), and those where only glutamate uncaging was triggered (gray markers). (D) Normalized neck length change in all spines vs. distance from soma. (E) Normalized spine volume change after pairing protocol. Data binned in different time points and average from each bin represented with a triangle ± SEM. (F) Amplitude of uncaging potential before and after pairing vs. the neck length. Each spine is represented with a different color. Lines represent linear fit to the data of individual experiments (dotted lines), and to pooled data (thicker dotted red line, see text for values). (G) Amplitude of the voltage response generated by glutamate uncaging (uncaging, gray circles), minimal stimulation voltage responses (EPSP, red circles), and uncaging responses from spines before and after the pairing protocol (uncaging, pairing protocol, black circles) vs. the neck length. Slopes of the three groups are not significantly different from each other (P > 0.05).
Fig. 5.
Fig. 5.
Biophysical modeling of spine neck resistivity, resistance, and synapse conductance for spines before and after induction of STDP. (A) Starting from an experimentally constrained passive model of a cortical pyramidal cell, only two free parameters (neck resistivity ρ and synaptic conductance g) could affect the amplitude of the somatic EPSPs. (B) Schematic of the modeling approach. Several pairs of ρ/g values could be found to reproduce the experimentally observed EPSP amplitude values independently in long- and short-necked spines. (C) To investigate if a sole change in neck length was sufficient to produce the EPSP observed in each of the nine successful experiments (i–ix), we determined the correct synaptic conductance g in the short- and long-necked spine (dotted and solid lines, respectively, in Upper panels for each experiment) for a broad range of ρ values, and searched for a configuration in which both g and ρ were identical in both short- and long-necked spines (marked by an X and a dashed vertical line). (C, i–ix, Lower) Recorded evoked postsynaptic potential in the spine head (spine PSP) of both short- and long-necked spine (dotted and solid line, respectively). Notice that no single solution can be found for spine ix. (D, Left) Conductance (g) and resistivity (ρ) value pairs for experiments i–viii (color-coded to match crossing points from C) that explain the observed experimental phenomenon as a purely passive attenuation phenomenon. In addition, the calculated spine neck resistance for the pre-STDP long-necked spine and its post-STDP shortened neck form was calculated with each ρ value and reflected onto a second diagonal axis showing the actual spine neck resistance (R) of each individual spine, ranging from ∼1 to 12 GΩ. (Right) Plot of the spine neck resistance (R) vs. spine neck length. Color-coded crosses mark the resistance values for short- and long-necked spine with the ρ value that allows for sole electrotonic attenuation in C. The arrowheads mark the R values for the lowest ρ values tested in C. (E) Estimated number of AMPA channels to produce the synaptic conductance of long- and short-necked spines for each resistivity value, based on an estimation of ∼9-pS AMPA receptors. (F) The number of extra, new AMPA receptors required in the shortened spine to provide the additional synaptic conductance (after the induction of synaptic plasticity) that would also explain the result, but with lower resistivity values.

References

    1. Ramón y Cajal S. 1899. La Textura del Sistema Nerviosa del Hombre y los Vertebrados (Moya, Madrid)
    1. Gray EG. Electron microscopy of synaptic contacts on dendrite spines of the cerebral cortex. Nature. 1959;183(4675):1592–1593. - PubMed
    1. Colonnier M. Synaptic patterns on different cell types in the different laminae of the cat visual cortex. An electron microscope study. Brain Res. 1968;9(2):268–287. - PubMed
    1. Arellano JI, Benavides-Piccione R, DeFelipe J, Yuste R. Ultrastructure of dendritic spines: Correlation between synaptic and spine morphologies. Front Neurosci. 2007;1(1):131–143. - PMC - PubMed
    1. Arellano JI, Espinosa A, Fairén A, Yuste R, DeFelipe J. Non-synaptic dendritic spines in neocortex. Neuroscience. 2007;145(2):464–469. - PubMed

Publication types

LinkOut - more resources