. 2014 Aug 15;289(33):22600-22613.
doi: 10.1074/jbc.M114.547380. Epub 2014 Jun 30.

The regulatory roles of microRNA-146b-5p and its target platelet-derived growth factor receptor α (PDGFRA) in erythropoiesis and megakaryocytopoiesis

Affiliations

The regulatory roles of microRNA-146b-5p and its target platelet-derived growth factor receptor α (PDGFRA) in erythropoiesis and megakaryocytopoiesis

Peng-Fei Zhai et al. J Biol Chem. .

Abstract

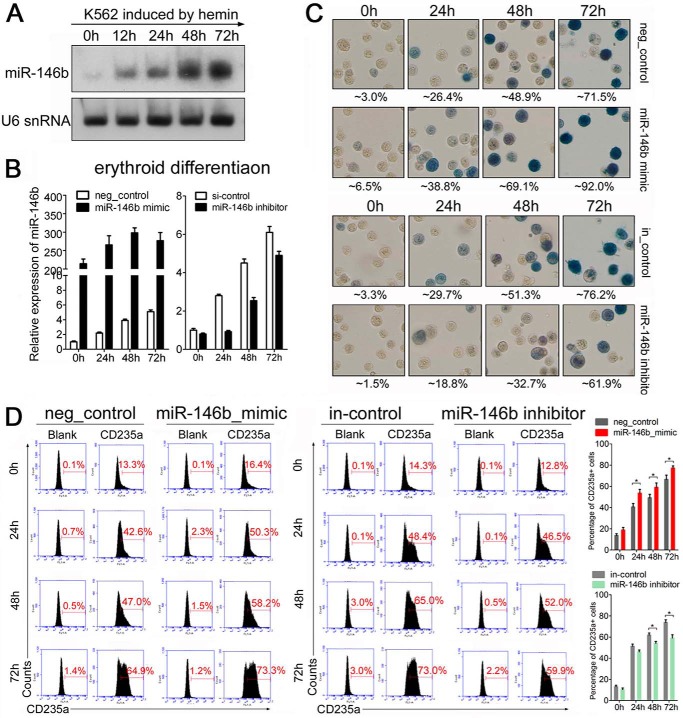
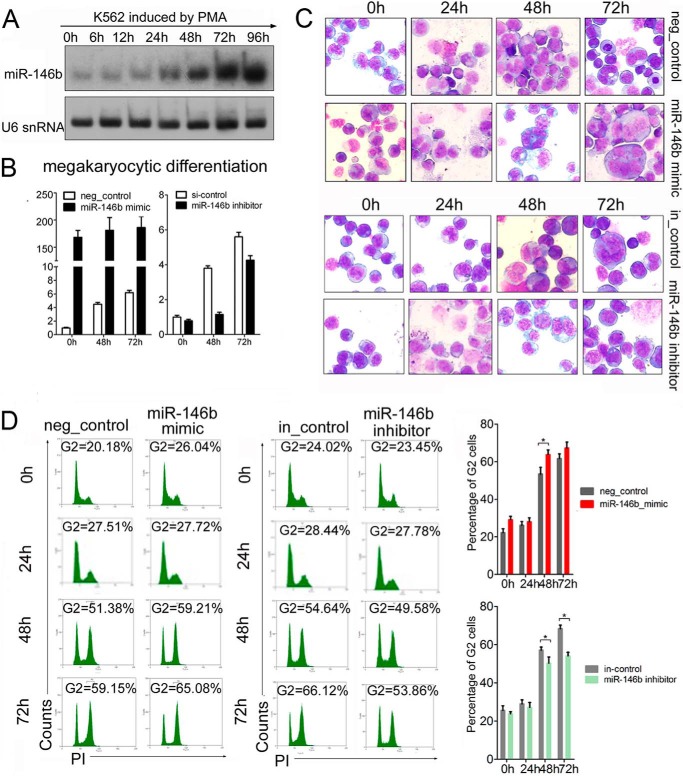
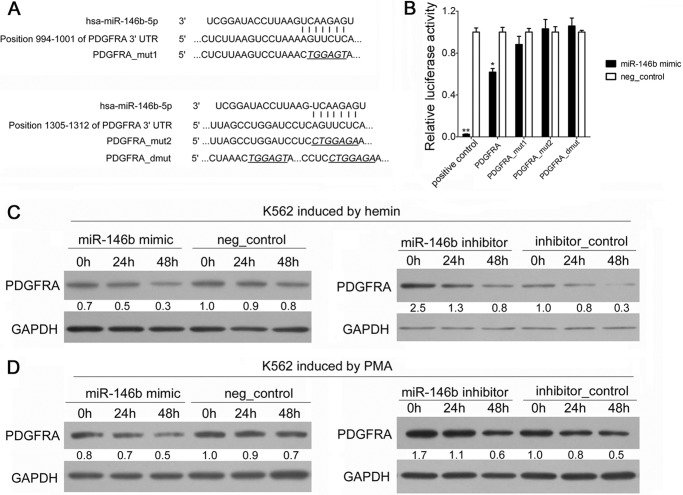
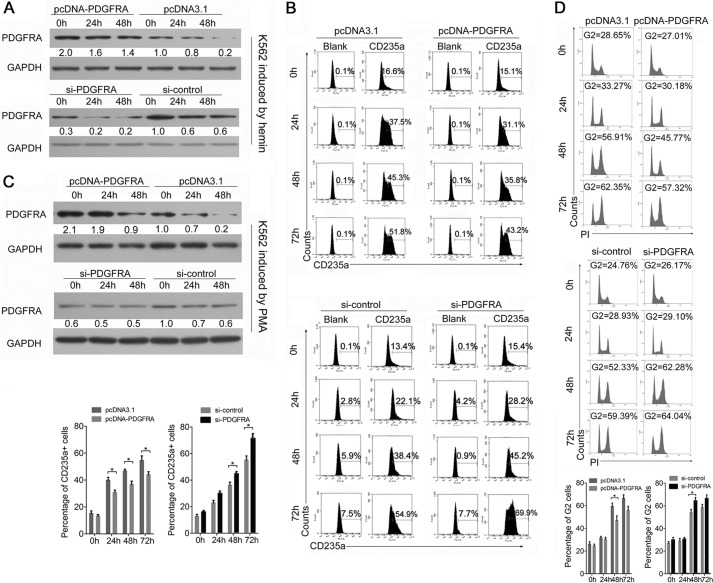
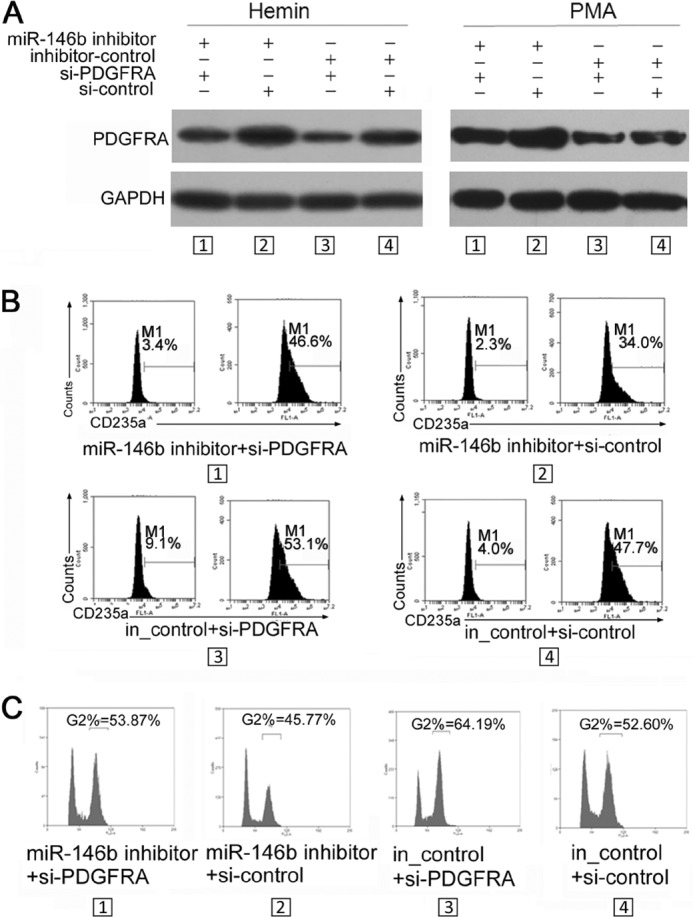
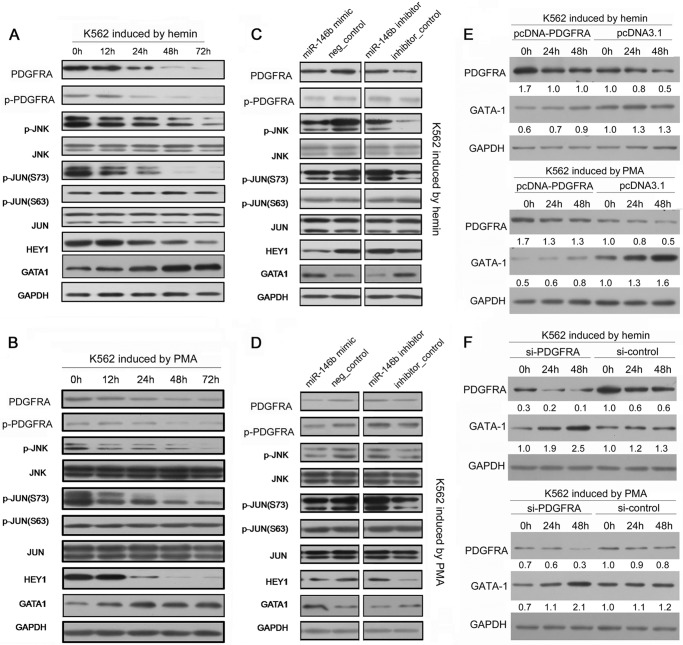
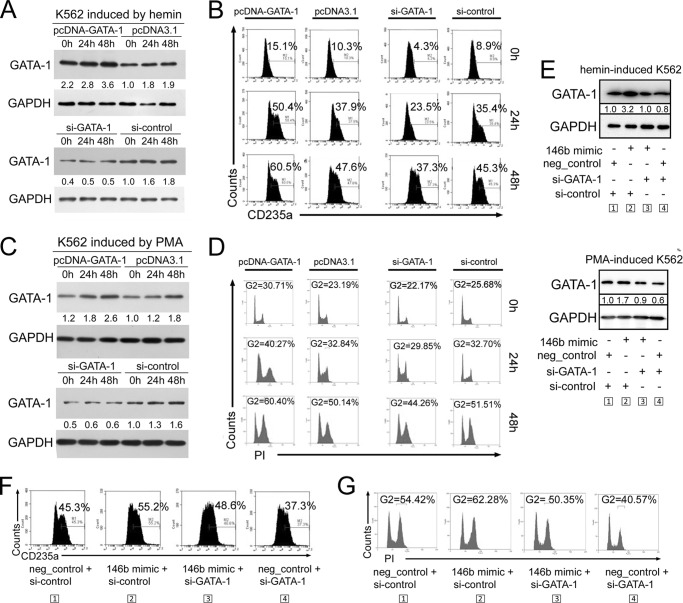
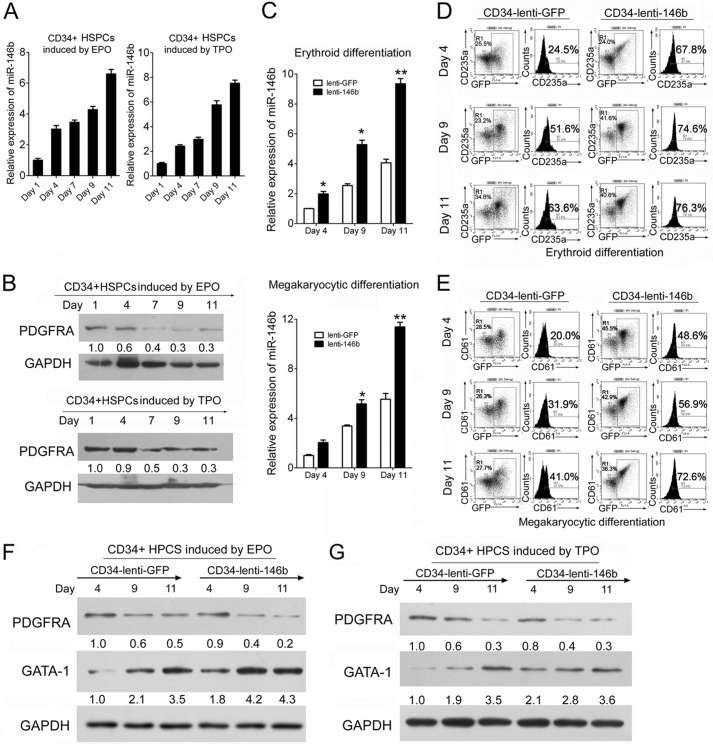
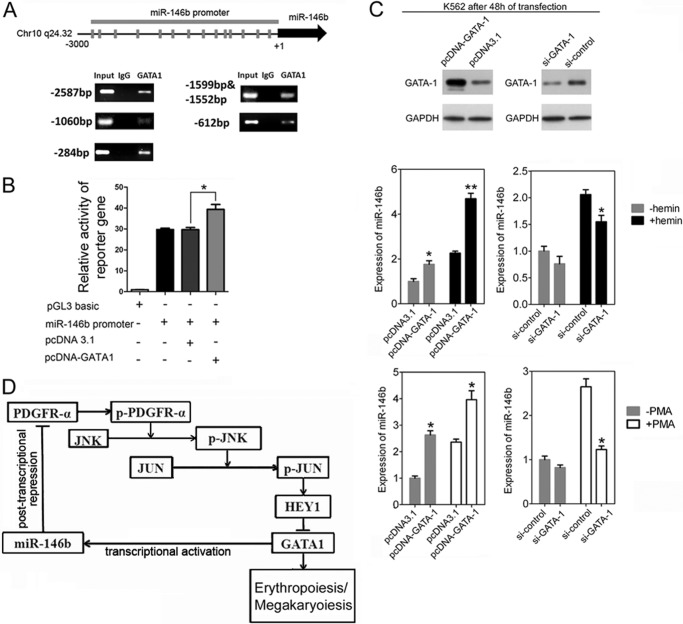
Emerging evidence has shown that microRNAs have key roles in regulating various normal physiological processes, whereas their deregulated expression is correlated with various diseases. The miR-146 family includes miR-146a and miR-146b, with a distinct expression spectrum in different hematopoietic cells. Recent work indicated that miR-146a has a close relationship with inflammation and autoimmune diseases. miR-146-deficient mice have developed some abnormal hematopoietic phenotypes, suggesting the potential functions of miR-146 in hematopoietic development. In this study, we found that miR-146b was consistently up-regulated in both K562 and CD34(+) hematopoietic stem/progenitor cells (HSPCs) undergoing either erythroid or megakaryocytic differentiation. Remarkably, erythroid and megakaryocytic maturation of K562 cells was induced by excess miR-146b but inhibited by decreased miR-146b levels. More importantly, an mRNA encoding receptor tyrosine kinase, namely platelet-derived growth factor receptor α (PDGFRA), was identified and validated as a direct target of miR-146b in hematopoietic cells. Gain-of-function and loss-of-function assays showed that PDGFRA functioned as a negative regulator in erythroid and megakaryocytic differentiation. miR-146b could ultimately affect the expression of the GATA-1 gene, which is regulated by HEY1 (Hairy/enhancer-of-split related with YRPW motif protein 1), a transcriptional repressor, via inhibition of the PDGFRA/JNK/JUN/HEY1 pathway. Lentivirus-mediated gene transfer also demonstrated that the overexpression of miR-146b promoted erythropoiesis and megakaryocytopoiesis of HSPCs via its regulation on the PDGFRA gene and effects on GATA-1 expression. Moreover, we confirmed that the binding of GATA-1 to the miR-146b promoter and induction of miR-146b during hematopoietic maturation were dependent on GATA-1. Therefore, miR-146b, PDGFRA, and GATA-1 formed a regulatory circuit to promote erythroid and megakaryocytic differentiation.

Keywords: Cell Differentiation; Erythropoiesis; GATA Transcription Factor; GATA-1; Hematopoiesis; Megakaryocytopoiesis; MicroRNA (miRNA); MicroRNA-146b; PDGFRA.


Figures

FIGURE 1.
FIGURE 1.
miR-146b promotes erythroid differentiation of K562 cells. A, Northern blot analysis of miR-146b during hemin-induced erythroid differentiation of K562 cells. U6 snRNA was detected to check equal RNA loading. B, qRT-PCR analysis of miR-146b in K562 cells transfected with miR-146b mimic or inhibitor. K562 cells were transfected with scrambled control (neg_control or in_control), miR-146b mimic, or miR-146b inhibitor. After 24 h of transfection, the cells were induced by hemin for 0, 24, 48, or 72 h. C, benzidine staining of hemoglobin-containing cells. The hemoglobin-containing cells were stained dark blue/brown. The percentage of benzidine-positive cells is indicated below the panel. D, flow cytometry analysis of erythroid marker CD235a-positive cells in K562 cells treated as described above. A representative experiment is presented at left, and statistical analysis from three independent experiments is shown at right. Asterisk indicates significant changes in the indicated groups compared with the control (*, p < 0.05).
FIGURE 2.
FIGURE 2.
miR-146b promotes megakaryocytic differentiation of K562 cells. A, Northern blot analysis of miR-146b during PMA-induced megakaryocytic differentiation of K562 cells. U6 snRNA was detected to check equal RNA loading. B, qRT-PCR analysis of miR-146b in K562 cells transfected with miR-146b mimic or inhibitor. K562 cells were transfected with scrambled control (neg_control or in_control), miR-146b mimic, or miR-146b inhibitor. After 24 h of transfection, the cells were induced by PMA for 0, 24, 48, or 72 h. C, morphological analysis of megakaryocytic differentiation by May-Grunwald Giemsa staining in the K562 cells that were transfected as described on the right. After 24 h of transfection, the cells were induced by PMA at the indicated times. D, flow cytometry analysis of megakaryocytic DNA content by PI staining. The left peak arose from 2N and the right peak from 4N (G2) cells. A representative experiment is presented in the left, and statistical analysis from three independent experiments is shown in the right. (*) Significant changes in the indicated groups compared with the control (*, p < 0.05).
FIGURE 3.
FIGURE 3.
PDGFRA mRNA was identified and validated as a direct target of miR-146b. A, computer prediction of conserved binding sites within the 3′UTR of PDGFRA mRNA for miR-146b. The mutated base sequences in the luciferase reporter assays are italicized and underlined. B, relative luciferase activity of the indicated PDGFRA reporter constructs. Error bars represent the standard deviation obtained from three independent experiments. *, p < 0.05; **, p < 0.01. C, immunoblot analysis of PDGFRA in the K562 cells transfected with scramble or miR-146b mimics or inhibitors, followed by hemin induction for 0, 24, or 48 h. D, immunoblot analysis of PDGFRA in K562 cells transfected with scrambled or miR-146b mimics or inhibitors, and PMA induction for 0, 24, or 48 h. For all Western blots, GAPDH antibody was used to assess equal protein loading. The signal in each lane was quantified using Gelpro32 software, and the ratio of PDGFRA to GAPDH was determined. PDGFRA expression was calculated as the relative fold with respect to its expression in the negative (neg)-control-transfected cells before differentiation induction.
FIGURE 4.
FIGURE 4.
PDGFRA is a negative regulator of erythroid and megakaryocytic differentiation. A, immunoblot analysis of PDGFRA expression in transfected and hemin-induced K562 cells. K562 cells were transfected with a construct carrying PDGFRA ORF or an empty vector and with PDGFRA siRNAs or si-control. After transfection for 24 h, the cells were treated by hemin and harvested at the indicated times after hemin induction. GAPDH antibody was used to assess equal protein loading. PDGFRA expression was calculated as the relative fold change with respect to its expression in control-transfected cells before hemin induction. B, flow cytometry analysis of erythroid marker CD235a-positive cells in the K562 cells treated as described above. A representative experiment is presented in the upper panels, and statistical analysis is presented in the lower panels. Error bars represent the standard deviation obtained from three independent experiments. *, p < 0.05. C, immunoblot analysis of PDGFRA expression in transfected and PMA-induced K562 cells. The K562 cells were transfected with the above constructs and oligonucleotides. After transfection for 24 h, the cells were treated by PMA and harvested at the indicated times. D, flow cytometry analysis of megakaryocytic DNA content by PI staining. A representative experiment is presented in the upper panels, and statistical analysis from three independent experiments is presented in the lower panels. *, p < 0.05.
FIGURE 5.
FIGURE 5.
Rescue assays demonstrated that miR-146b promotes erythroid and megakaryocytic differentiation via directly targeting and down-regulating PDGFRA. A, immunoblot analysis of PDGFRA in K562 cells with different treatments. K562 cells were transfected with miR-146b inhibitor or scrambled inhibitor controls. After 24 h of transfection, the cells were subsequently re-transfected with control siRNAs or siRNAs specific to PDGFRA and treated with hemin or PMA for 48 h. B, flow cytometry analysis of erythroid differentiation of K562 cells treated as described above. C, PI staining analysis of megakaryocytic differentiation of K562 cells treated as described above.
FIGURE 6.
FIGURE 6.
miR-146b regulates the PDGFRA-JNK-JUN-GATA-1 pathways in erythroid and megakaryocytic differentiation. A, immunoblot analysis of PDGFRA, JNK, and JUN levels; phosphorylated PDGFRA, JNK, and JUN levels; and HEY1 and GATA-1 levels during hemin-induced erythroid differentiation of K562 cells. B, immunoblot analysis of PDGFRA, JNK, and JUN levels; phosphorylated PDGFRA, JNK, and JUN levels; and HEY1 and GATA-1 levels during PMA-induced megakaryocytic differentiation of K562 cells. C, immunoblot analysis of PDGFRA, JNK, and JUN levels; phosphorylated PDGFRA, JNK, and JUN levels; and JHEY1 and GATA-1 levels in the K562 cells transfected with miR-146b mimics or inhibitors or their controls and treated by hemin induction for 48 h. D, immunoblot analysis of PDGFRA, JNK, and JUN levels and phosphorylated PDGFRA, JNK, and JUN levels in the K562 cells transfected with miR-146b mimics or inhibitors or their controls and treated by PMA induction for 48 h. For all Western blots, GAPDH antibody was used to assess equal protein loading. E, immunoblot analysis of PDGFRA and GATA-1 levels in the K562 cells transfected with a construct carrying the PDGFRA ORF or an empty vector and with PDGFRA siRNAs or si-control and treated by hemin induction for 0, 24, and 48 h. F, immunoblot analysis of PDGFRA and GATA-1 levels in the K562 cells transfected with a construct carrying PDGFRA ORF or an empty vector and PDGFRA siRNAs or si-control and treated with PMA induction for 0, 24, and 48 h. For Western blots in E and F, GAPDH antibody was used to assess equal protein loading. The expression levels of PDGFRA and GATA-1 were calculated as a relative fold with respect to their expression in control-transfected cells before differentiation induction.
FIGURE 7.
FIGURE 7.
miR-146b mediates erythropoiesis and megakaryocytopoiesis via modulating GATA-1 levels. A, immunoblot analysis of GATA-1 levels in the K562 cells transfected with GATA-1 siRNAs or si-control and a construct carrying GATA-1 ORF (pcDNA-GATA-1) or an empty vector (pcDNA3.1) and induced with hemin for 0, 24, and 48 h. B, flow cytometry analysis of erythroid differentiation of K562 cells treated as described in A. C, immunoblot analysis of GATA-1 levels in the K562 cells transfected with GATA-1 siRNAs or si-control and pcDNA-GATA-1 or pcDNA3.1 and induced with PMA for 0, 24, and 48 h. D, PI staining analysis of megakaryocytic differentiation of K562 cells treated as described in C. E–G, rescue assays demonstrated that miR-146b promoted erythroid and megakaryocytic differentiation by modulating GATA-1 levels. K562 cells were transfected with miR-146b mimic or scrambled mimic controls. After 24 h of transfection, the cells were subsequently re-transfected with control siRNAs or siRNAs specific to GATA-1 and treated with hemin or PMA for 48 h. E, immunoblot analysis of GATA-1 in the K562 cells treated as described above. F, flow cytometry analysis of erythroid differentiation of K562 cells treated as described above. G, PI staining analysis of megakaryocytic differentiation of K562 cells treated as described above.
FIGURE 8.
FIGURE 8.
miR-146b promotes erythroid and megakaryocytic differentiation in CD34+ HSPCs via regulation of its target PDGFRA. A and B, qPCR analysis of miR-146b level in CD34+ HSPCs undergoing erythroid (A) and megakaryocytic (B) differentiation at days 1, 4, 7, 9, and 11. C, qPCR analysis of miR-146b levels in CD34+ HSPCs infected with lentivirus expressing mature miR-146b (Lenti-146b) or a control virus (Lenti-GFP), and cultured in erythroid (upper panels) or megakaryocytic (lower panels) induction medium for the indicated times. Error bars represent the standard deviation obtained from three independent experiments. *, p < 0.05; **, p < 0.01. D, FACS analysis of the erythroid culture of CD34+ HSPCs transduced with Lenti-146b or Lenti-GFP at the indicated induction culture days. E, flow cytometry analysis of the megakaryocytic induction culture of CD34+ HSPCs transduced with Lenti-146b or Lenti-GFP at the indicated induction culture days. F and G, immunoblot analysis of PDGFRA expression in the erythroid (F) and megakaryocytic (G) induction cultures of CD34+ HSPCs transduced with Lenti-GFP control and Lenti-146b. GAPDH antibody was used to assess equal protein loading. The expression levels of PDGFRA and GATA-1 were calculated as a relative fold with respect to their expression at day 4 in the induction cultures of Lenti-GFP-infected CD34+ HSPCs.
FIGURE 9.
FIGURE 9.
Transcription of miR-146b gene is positively regulated by GATA-1. A, ChIP-PCR analysis of the GATA-1 hit upstream of miR-146b locus in K562 cells. B, functional activity of GATA-1 on the miR-146b promoter in luciferase reporter analysis. Error bars represent the standard deviation obtained from three independent experiments. *, p <0.05. C, qPCR analysis of miR-146b expression in the transfected K562 cells. The cells were transfected with pcDNA3.1, pcDNA3.1-GATA1, si-GATA-1, and si-control for 24 h, respectively, and then were either induced by hemin or PMA for another 24 h. Upper panel, immunoblot analysis of GATA-1 expression in the transfected K562 cells. Lower panel, qPCR analysis of miR-146b expression in the transfected K562 cells. Error bars represent the standard deviation obtained from three independent experiments. *, p < 0.05. D, schematic representation of the regulatory circuit comprising GATA-1, miR-146b, and PDGFRA in erythroid and megakaryocytic differentiation.

Similar articles

Cited by

References

    1. Gregory R. I., Chendrimada T. P., Cooch N., Shiekhattar R. (2005) Human RISC couples microRNA biogenesis and posttranscriptional gene silencing. Cell 123, 631–640 - PubMed
    1. Bushati N., Cohen S. M. (2007) microRNA functions. Annu. Rev. Cell Dev. Biol. 23, 175–205 - PubMed
    1. Ameres S. L., Zamore P. D. (2013) Diversifying microRNA sequence and function. Nat. Rev. Mol. Cell Biol. 14, 475–488 - PubMed
    1. Bartel D. P. (2004) MicroRNAs: genomics, biogenesis, mechanism, and function. Cell 116, 281–297 - PubMed
    1. Bernstein E., Kim S. Y., Carmell M. A., Murchison E. P., Alcorn H., Li M. Z., Mills A. A., Elledge S. J., Anderson K. V., Hannon G. J. (2003) Dicer is essential for mouse development. Nat. Genet. 35, 215–217 - PubMed

Publication types

MeSH terms

Substances