. 2014 Jul 7;206(1):45-59.
doi: 10.1083/jcb.201312107. Epub 2014 Jun 30.

Accurate phosphoregulation of kinetochore-microtubule affinity requires unconstrained molecular interactions

Affiliations

Accurate phosphoregulation of kinetochore-microtubule affinity requires unconstrained molecular interactions

Anatoly V Zaytsev et al. J Cell Biol. .

Abstract

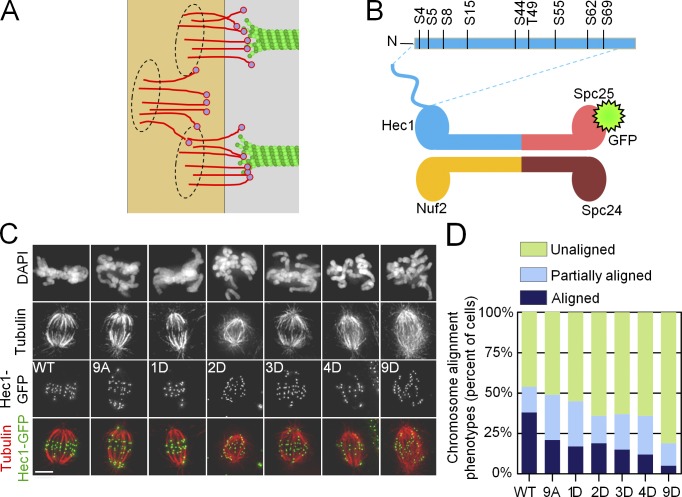
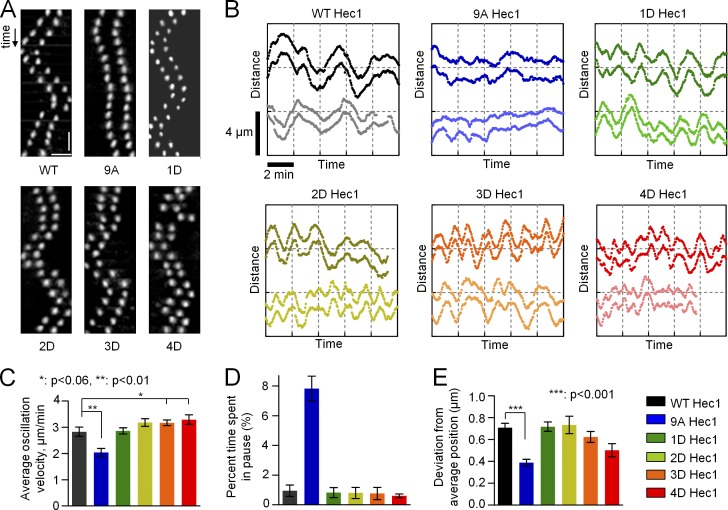
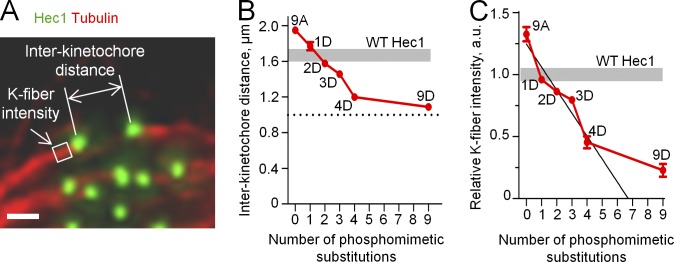
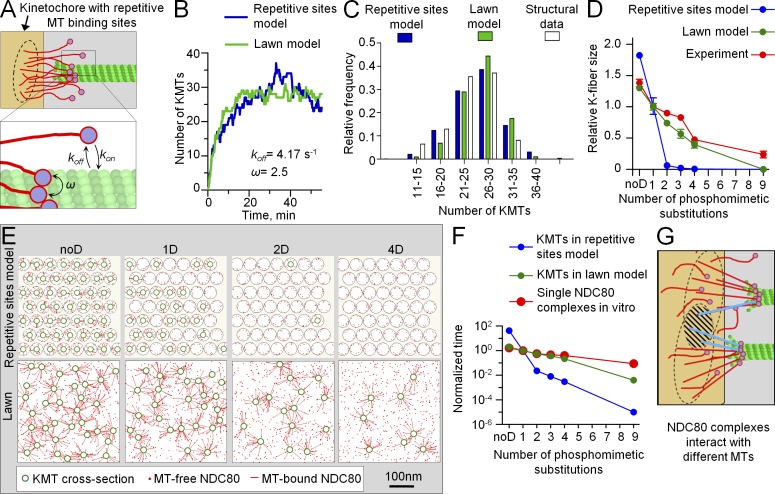
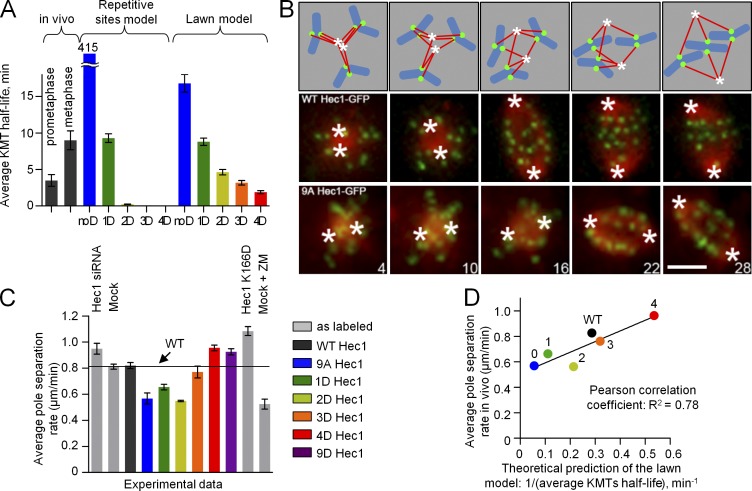
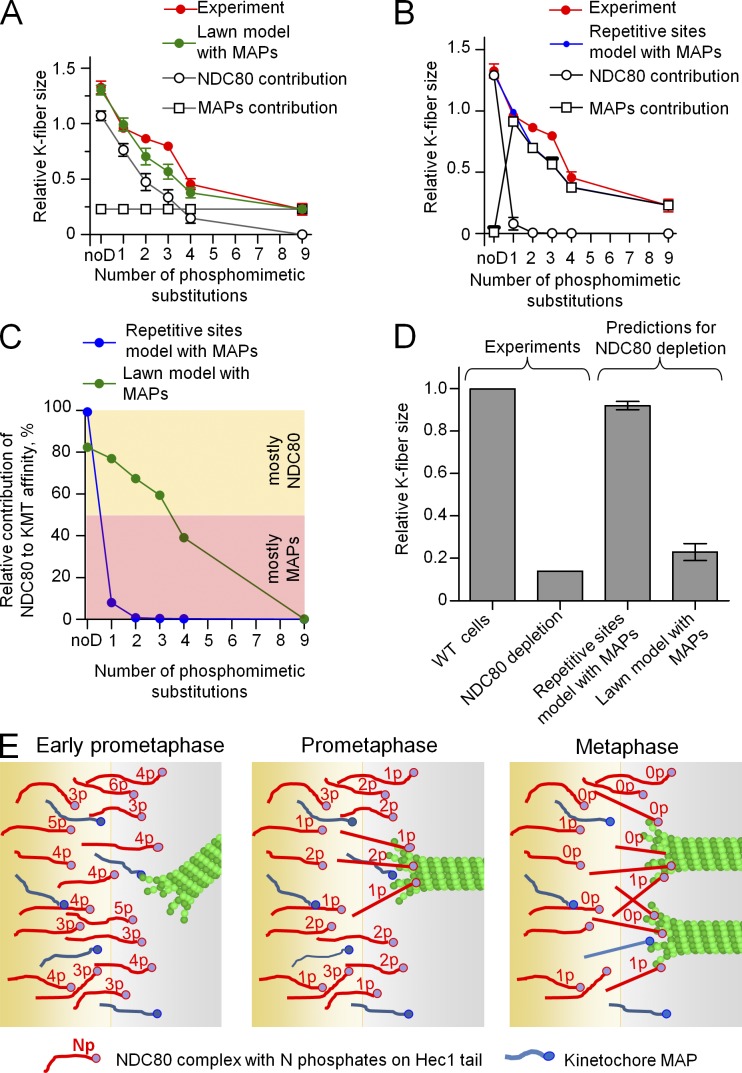
Accurate chromosome segregation relies on dynamic interactions between microtubules (MTs) and the NDC80 complex, a major kinetochore MT-binding component. Phosphorylation at multiple residues of its Hec1 subunit may tune kinetochore-MT binding affinity for diverse mitotic functions, but molecular details of such phosphoregulation remain elusive. Using quantitative analyses of mitotic progression in mammalian cells, we show that Hec1 phosphorylation provides graded control of kinetochore-MT affinity. In contrast, modeling the kinetochore interface with repetitive MT binding sites predicts a switchlike response. To reconcile these findings, we hypothesize that interactions between NDC80 complexes and MTs are not constrained, i.e., the NDC80 complexes can alternate their binding between adjacent kinetochore MTs. Experiments using cells with phosphomimetic Hec1 mutants corroborate predictions of such a model but not of the repetitive sites model. We propose that accurate regulation of kinetochore-MT affinity is driven by incremental phosphorylation of an NDC80 molecular "lawn," in which the NDC80-MT bonds reorganize dynamically in response to the number and stability of MT attachments.


Figures

Figure 1.
Figure 1.
Regulation of kinetochore–MT interactions by Hec1 phosphorylation. (A) Schematic of the KMT interface with repetitive MT binding sites (circles), each containing multiple NDC80 complexes. (B) Schematic of the NDC80 complex and location of Aurora B phosphorylation sites in the Hec1 tail. N, N terminus. (C) Fluorescence images of PtK1 cells depleted of endogenous Hec1 and rescued with phosphomimetic versions of Hec1 in an A background fused to GFP. Cells were fixed after a brief incubation in ice-cold media to reduce the number of nonkinetochore spindle MTs. Bar, 10 µm. (D) Quantification of chromosome alignment phenotypes for the Hec1 silence/rescue experiment. At least 108 cells were analyzed for each Hec1 mutant from three separate experiments.
Figure 2.
Figure 2.
Phosphoregulation of metaphase chromosome oscillations. (A) Kymographs (time and distance scale bars are 24 s and 2 µm, respectively) of representative sister kinetochore pairs from bioriented chromosomes in cells rescued with WT Hec1-GFP or the indicated phosphomimetic mutants generated in an A background. (B) Representative tracings for two sister kinetochore pairs from the indicated backgrounds. The y axis shows the relative position along the spindle axis; time and distance scale bars are the same for all graphs. The vertical offset between each set of pairs is for easier visualization. (C) Mean velocity of kinetochore movement along the spindle axis. See legend on the right for color coding. Data for each bar in C–E are based on 22 kinetochore tracks from at least seven cells. Here and in D and E, the results for 1D Hec1 are the means for three different mutants (Fig. S2, A–C). (D) Time spent with no motion for two sequential frames, or 6 s, normalized to the total time of the time lapse. (E) Deviation from average position, a measure of oscillation amplitude (Stumpff et al., 2008). Error bars are SEMs.
Figure 3.
Figure 3.
Quantitative analysis of the phosphoregulation of K fibers in metaphase cells. (A) Example metaphase PtK1 cell depleted of endogenous Hec1 and rescued with 1D Hec1, fixed, and stained with antitubulin and anti-Hec1 antibodies. The white box shows the area in which the mean intensity of tubulin staining was measured to compare relative sizes of K fibers in different cells. Bar, 1 µm. (B) Interkinetochore distances in metaphase cells expressing Hec1 with different numbers of phosphomimetic substitutions. Results for 1D Hec1 are averaged between three mutants (Fig. S2 D). Shaded area shows the range for interkinetochore distances in WT Hec1 cells. The broken line shows interkinetochore distance in the absence of MTs: 1.0 µm (DeLuca et al., 2006, 2011). At least 127 kinetochores were analyzed in ≥30 cells for each Hec1 mutant. (C) Relative K-fiber intensities in cells expressing Hec1 with different numbers of phosphomimetic substitutions. Results for 1D Hec1 are averaged between three Hec1 mutants (Fig. S2 E). Mean intensity of K fibers in WT cells was chosen as 1; shaded area shows the corresponding range. The value for 9D Hec1 is significantly different from 0 (P < 0.05), which is predicted from the linear relationship. The black line is a best linear fit of experimental points for zero to four phosphomimetic substitutions. At least five K fibers were measured per cell in ≥22 cells for each Hec1 mutant. Error bars are SEMs. a.u., arbitrary unit.
Figure 4.
Figure 4.
Mathematical model of the KMT interface. (A) NDC80–MT binding is characterized by three molecular parameters: association rate (kon), dissociation rate (koff), and cooperativity parameter (ω). (B) Calculated kinetics of the increase in K-fiber size for the kinetochore with 1D NDC80 complexes for the repetitive sites model and lawn model. Values of other model parameters are provided in Table 1 and Table 2. Both models correctly predict that formation of a K fiber with a mean of 27 KMTs takes ∼20 min in PtK1 cells (McEwen et al., 1997). (C) Histogram distribution of the number of KMTs at a steady state in the repetitive sites model and lawn model relative to metaphase cells (experimental data are from McEwen et al., 1997). (D) K-fiber size for different numbers of phosphomimetic substitutions predicted in the two models normalized relative to the normal K-fiber size (27 KMTs in PtK1 cells). Error bars here and for all theoretical plots are SDs. Here and in Fig. 6 (A and B), experimental data for K-fiber size are the same as in Fig. 3 C. (E) Snapshots from theoretical videos for kinetochores with different NDC80 complexes (Video 1 for 1D mutant in the repetitive sites model and Video 2 in the lawn model). Each image is a fragment of a kinetochore cross section at steady state. The exact positions of attached MTs change with time, but the mean number of MTs bound to the kinetochores stays roughly the same at steady state. (F) Mean KMT half-life calculated for kinetochores with different phosphomutants and normalized relative to KMT half-life for 1D NDC80 complexes, which was 9 min in both models (owing to calibration) and was taken as 1 on this graph. Experimental data for single NDC80 complexes are mean residency times in vitro, which is an inverse of the dissociation rate (Table 1). Residency time for 1D NDC80 is 240 ms (taken as 1 on this graph). Note that time is plotted on a logarithmic scale. (G) Schematic of the KMT interface in the lawn model, in which the sites of MT attachment to the kinetochore do not have a predetermined location or molecular makeup, and they form via stochastic contacts between MTs and the NDC80 complexes that can reach them (black circles). The hatched area shows an overlap between two such circles; molecules from this area (in blue) can engage in binding to either of the two MTs.
Figure 5.
Figure 5.
Phosphoregulation of the KMT interface in prometaphase cells. (A) Mean KMT half-life calculated with the two models relative to these values measured previously in PtK1 cells in prometaphase and metaphase (3.5 and 9 min, respectively; Cimini et al., 2006; DeLuca et al., 2006). Both models were calibrated such that the interfaces with 1D NDC80 complexes matched the metaphase half-life. The repetitive sites model predicts very unstable KMT attachments for 2D, 3D, and 4D proteins, so these bars are virtually invisible, whereas the large half-life for noD NDC80 kinetochores is plotted with an interrupted axis. (B) Schematics and representative still images from time-lapse videos of PtK1 cells subjected to a monastrol washout assay. Numbers are times (in minutes) from monastrol washout. Hec1-GFP is shown in green (kinetochores); mCherry-tubulin is shown in red (MTs); cartoon chromosomes are shown in blue; asterisks show position of poles. Bar, 5 µm. (C) Rate of pole separation after monastrol washout. ZM, Aurora B inhibitor ZM447439. The bar labeled Hec1 K166D corresponds to a non-MT–binding Hec1K166D mutant (Ciferri et al., 2008; Sundin et al., 2011). n = 10 cells were analyzed for each Hec1 mutant. (D) Correlation plot for in silico and in vivo data from A and C, respectively. Pearson correlation analysis shows that the correlation is significant for the lawn model but not the repetitive sites model (R2 is 0.78 and 0.51, respectively, with threshold value of 0.05). Error bars are SEMs.
Figure 6.
Figure 6.
Analysis of contribution of other kinetochore MAPs to KMT affinity. (A) Relative K-fiber size predicted for different molecular lawns. The green curve is the total kinetochore affinity, and it is a sum of the contributions from NDC80 complexes with different degrees of phosphorylation and MAPs. (B) Relative K-fiber size predicted for different phosphomutants in the repetitive sites model. Contribution from NDC80 complexes was renormalized (compare with Fig. 4 D), such that the predicted number of KMTs did not exceed the experimentally measured K-fiber size. The MAP contribution is a difference between the best fit with the lawn model (A) and the contribution from NDC80 complexes. The combined affinity in the repetitive sites model was thus matched to the combined affinity in the lawn model (A). (C) Percentage of contribution of NDC80 complexes to the total KMT affinity calculated for the two models with MAPs. Both models provide a match to K-fiber size in cells (see A and B), but they predict different relative NDC80 versus MAP contribution. (D) Relative K-fiber size for kinetochores with depleted Nuf2 (a subunit of the NDC80 complex) in vivo (data from DeLuca et al., 2005) and predictions of the two models in which only MAPs are present. Experimental and theoretical data were normalized to the number of KMTs for WT cells. (E) Summary diagram of the tunable KMT interface. NDC80 complexes and other MAPs comprise a molecular lawn that interacts dynamically with competing MTs. Early in mitosis, NDC80 is likely to be hyperphosphorylated, so other MAPs provide a major contribution to the overall weak KMT binding. As MTs begin to attach, the mean phosphorylation on the Hec1 tail decreases to a range of one to two phosphates, and the contribution of NDC80 becomes significant. Further dephosphorylation in metaphase reduces the mean number of phosphates to a range of zero to one, and the contribution of NDC80 complexes to MT binding dominates. p indicates the number of phosphates. This drawing underrepresents the number of MT-bound NDC80 complexes, which is estimated to be 10–12 (Fig. S5 B). Error bars are SEMs.

References

    1. Akiyoshi, B., Sarangapani K.K., Powers A.F., Nelson C.R., Reichow S.L., Arellano-Santoyo H., Gonen T., Ranish J.A., Asbury C.L., and Biggins S.. 2010. Tension directly stabilizes reconstituted kinetochore-microtubule attachments. Nature. 468:576–579 10.1038/nature09594 - DOI - PMC - PubMed
    1. Alberts, B., Johnson A., Lewis J., Raff M., Roberts K., and Walter P.. 2008. Molecular Biology of the Cell. Fifth edition Garland Science, New York: 1392 pp
    1. Alushin, G.M., Ramey V.H., Pasqualato S., Ball D.A., Grigorieff N., Musacchio A., and Nogales E.. 2010. The Ndc80 kinetochore complex forms oligomeric arrays along microtubules. Nature. 467:805–810 10.1038/nature09423 - DOI - PMC - PubMed
    1. Aravamudhan, P., Felzer-Kim I., and Joglekar A.P.. 2013. The budding yeast point centromere associates with two Cse4 molecules during mitosis. Curr. Biol. 23:770–774 10.1016/j.cub.2013.03.042 - DOI - PMC - PubMed
    1. Armond, J.W., and Turner M.S.. 2010. Force transduction by the microtubule-bound Dam1 ring. Biophys. J. 98:1598–1607 10.1016/j.bpj.2010.01.004 - DOI - PMC - PubMed

Publication types