. 2014 Jul 1;9(7):e100410.
doi: 10.1371/journal.pone.0100410. eCollection 2014.

Mechanisms involving Ang II and MAPK/ERK1/2 signaling pathways underlie cardiac and renal alterations during chronic undernutrition

Affiliations

Mechanisms involving Ang II and MAPK/ERK1/2 signaling pathways underlie cardiac and renal alterations during chronic undernutrition

Paulo A Silva et al. PLoS One. .

Abstract

Background: Several studies have correlated protein restriction associated with other nutritional deficiencies with the development of cardiovascular and renal diseases. The driving hypothesis for this study was that Ang II signaling pathways in the heart and kidney are affected by chronic protein, mineral and vitamin restriction.

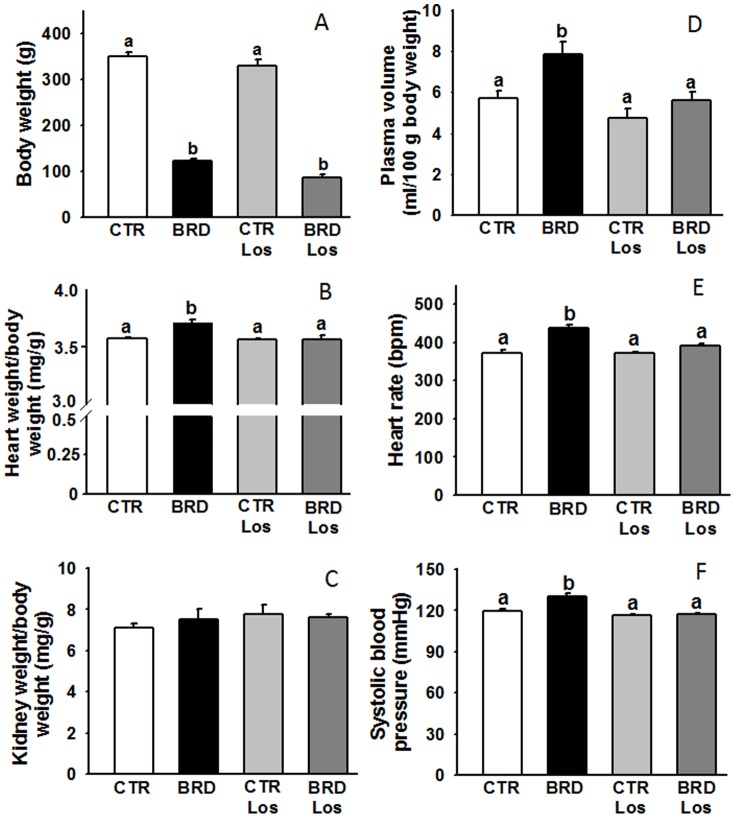
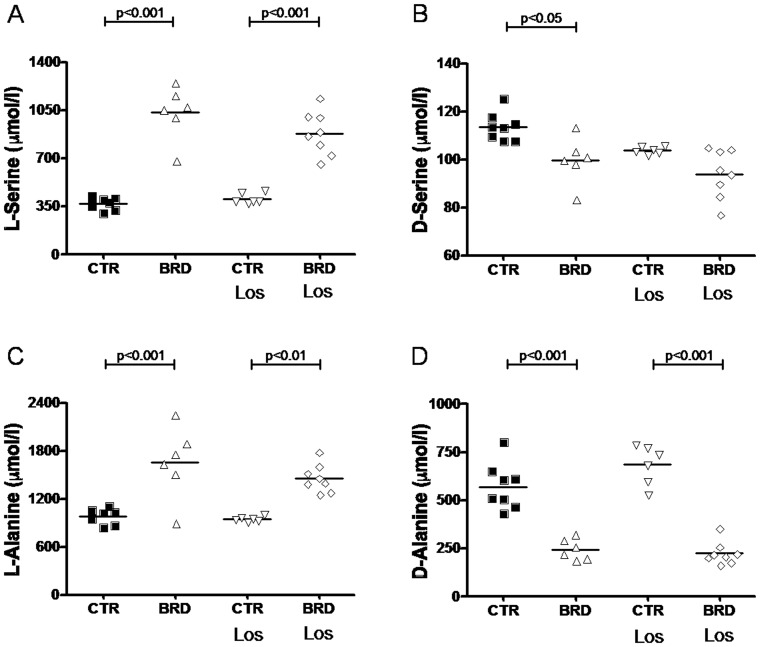
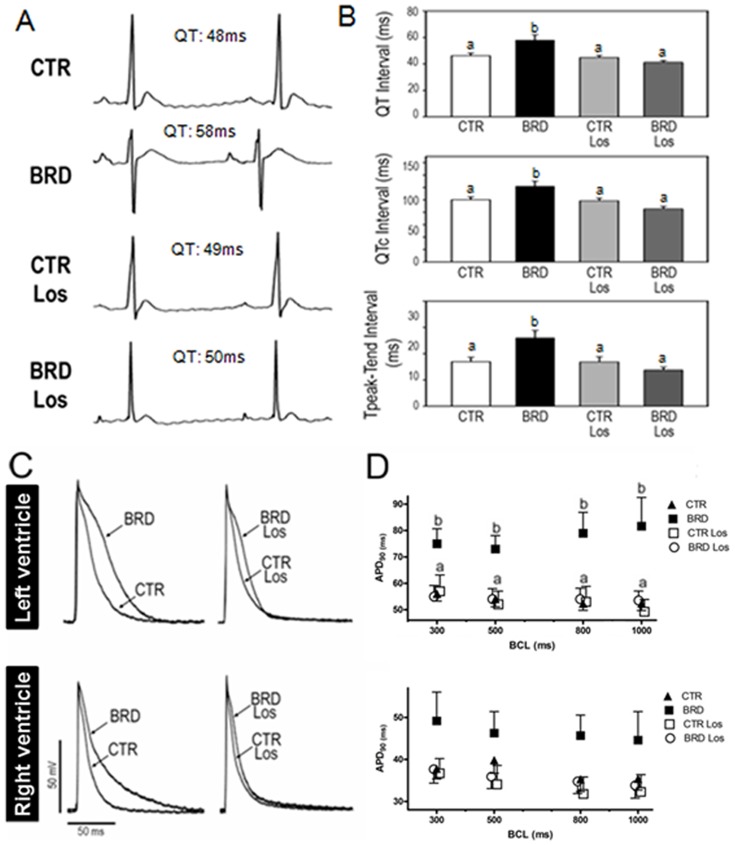
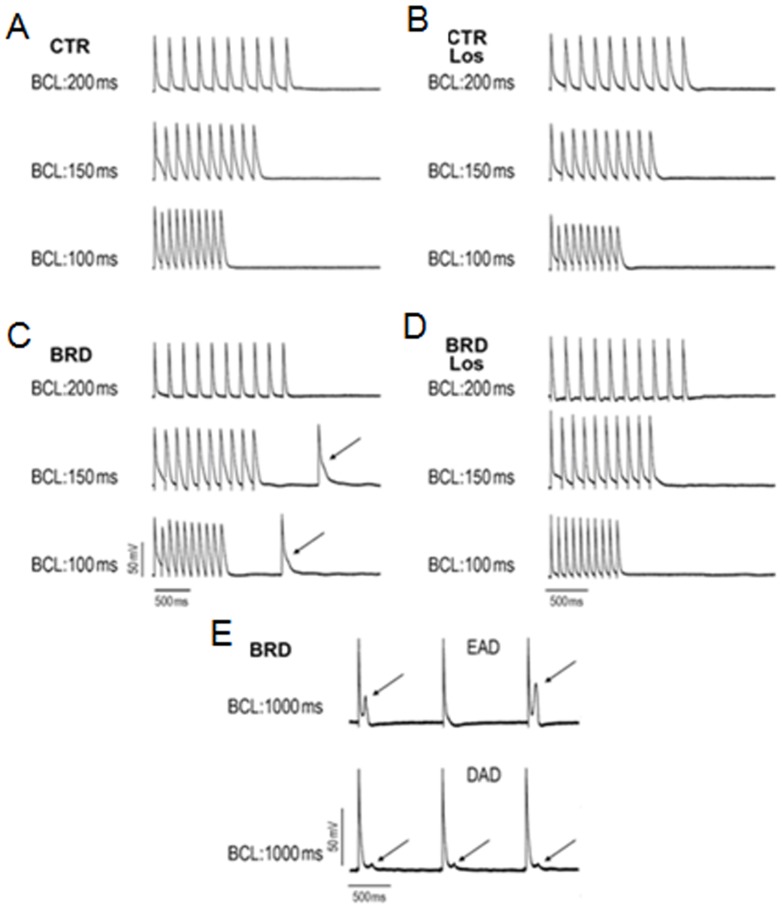
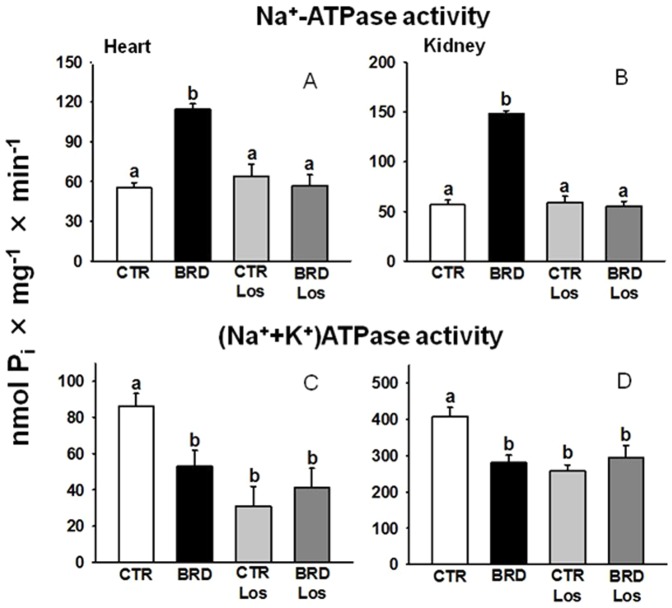
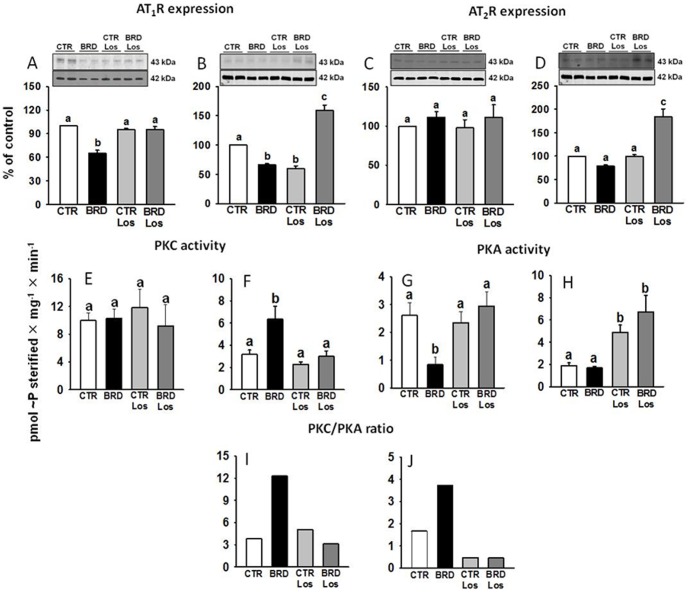
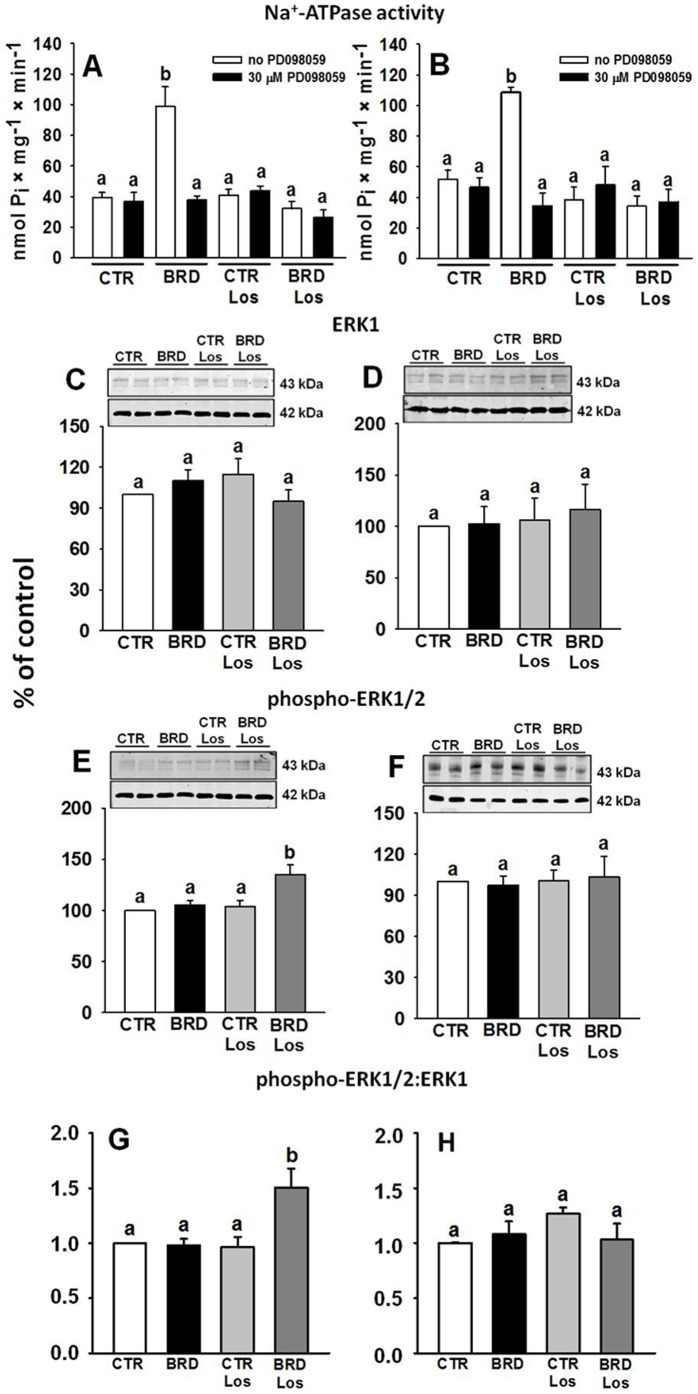
Methodology/principal findings: Wistar rats aged 90 days were fed from weaning with either a control or a deficient diet that mimics those used in impoverished regions worldwide. Such restriction simultaneously increased ouabain-insensitive Na+-ATPase and decreased (Na++K+)ATPase activity in the same proportion in cardiomyocytes and proximal tubule cells. Type 1 angiotensin II receptor (AT1R) was downregulated by that restriction in both organs, whereas AT2R decreased only in the kidney. The PKC/PKA ratio increased in both tissues and returned to normal values in rats receiving Losartan daily from weaning. Inhibition of the MAPK pathway restored Na+-ATPase activity in both organs. The undernourished rats presented expanded plasma volume, increased heart rate, cardiac hypertrophy, and elevated systolic pressure, which also returned to control levels with Losartan. Such restriction led to electrical cardiac remodeling represented by prolonged ventricular repolarization parameters, induced triggered activity, early after-depolarization and delayed after-depolarization, which were also prevented by Losartan.

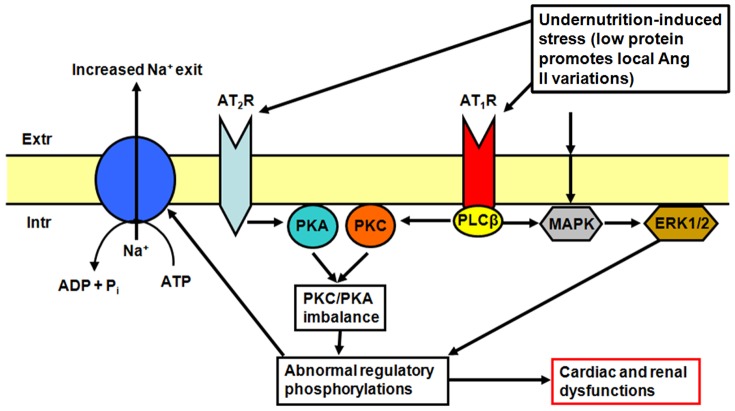
Conclusion/significance: The mechanisms responsible for these alterations are underpinned by an imbalance in the PKC- and PKA-mediated pathways, with participation of angiotensin receptors and by activation of the MAPK/ERK1/2 pathway. These cellular and molecular alterations culminate in cardiac electric remodeling and in the onset of hypertension in adulthood.


Conflict of interest statement

Competing Interests: The authors have declared that no competing interests exist.

Figures

Figure 1
Figure 1. Specificity of the Ang II receptor antibodies.
Electrophoresis of renal membranes was carried out as described in the Materials and Methods section, using 80 µg of total protein. The specificity of the antibodies was confirmed by a preadsorption experiment using full-length human Ang II type 2 receptor recombinant protein as a matrix. The samples were incubated for 72 h at 4°C with gentle stirring and then centrifuged at 18,000×g for 1 min. The secondary antibody was a polyclonal anti-rabbit (NIF824, GE; 1∶2,500). See additional details in the Materials and Methods section. A: Ponceau red-stained nitrocellulose membrane (left) and immunosignal obtained after incubation of the AT1R antibody with the full-length AT2R recombinant protein (right). B: Ponceau red-stained nitrocellulose membrane (left) with no signal when the AT2R antibody was preadsorbed on to the full-length AT2R recombinant protein (right).
Figure 2
Figure 2. Alterations in body weight, cardiac index and renal index (A–C), and expanded plasma volume, accelerated heart rate and increased systolic pressure (D–F), in rats subjected to protein restriction (aged 90 days).
The animal groups were: control (CTR); fed with the deficient diet after weaning (BRD); control receiving Losartan (CTR Los); and BRD receiving Losartan (BRD Los) (A–C, n = 7; D, n = 13 in CTR and CTR Los groups; n = 5 in BRD and BRD Los groups; E, n = 23 in CTR and CTR Los groups; n = 8 in BRD and BRD Los groups; F, n = 7 in all groups). Histograms show mean ± SEM. Different lower-case letters above the bars indicate statistically significant differences in mean values within the corresponding panel (P<0.05).
Figure 3
Figure 3. Food and water intake.
Food and water ingestion was recorded one day before sacrifice at 90 days of age at the end of a 24 h period. The animal groups were those described in the legend to Figure 2. The rats were maintained in individual metabolic cages in the same conditions of light and temperature described in the Methods section of the main text. Simultaneous recording of body weight at the end of the period allowed correction of the data, as shown on the abscissae. Different lowercase letters above the bars indicate statistically different mean values in panel B (P<0.05; n = 5).
Figure 4
Figure 4. Representative plasma amino acids analysis.
The plasma was analyzed by high performance liquid chromatography (HPLC) as described in Materials and Methods. Abbreviations of the experimental groups are those defined in the legend to Figure 2. The peaks were identified using individual amino acid standards that were run immediately after the plasma samples. Quantification and statistical analysis of the peaks are presented in Figures 5 and 6.
Figure 5
Figure 5. Changes in the plasma levels of L-amino acids and glycine.
Panels show values for each animal. Horizontal lines represent mean values (n = 5–8 blood samples from different rats of each group). Statistical differences were assessed by one-way ANOVA followed by Bonferroni adjustment for CTR vs. BRD, CTR vs. CTR Los, BRD vs. BRD Los, and CTR Los vs. BRD Los, as indicated.
Figure 6
Figure 6. BRD induces increase in plasma levels of L-Serine and L-Alanine with simultaneous decrease in D-Serine and D-Alanine.
Panels show values for each animal. Horizontal lines represent mean values (n = 6–8 blood samples from different rats of each group). Statistical differences were assessed by one-way ANOVA followed by Bonferroni adjustment for CTR vs. BRD, CTR vs. CTR Los, BRD vs. BRD Los, and CTR Los vs. BRD Los, as indicated.
Figure 7
Figure 7. BRD induced longer QT, QTc, Tpeak-Tend and action potential duration.
The animal groups were as described for Figure 2. (A) Representative traces of electrocardiograms show longer QT in the BRD group. (B) BRD induced ventricular repolarization disturbances, as summarized in the bar graph. Histograms show mean ± SEM. (C) Representative traces show longer left, but not right, ventricular action potential in BRD. (D) Longer ventricular action potential duration at 90% repolarization (APD90) in the BRD group under different basic cycle lengths (BCL), as shown on the abscissae (panels B and D, n = 6–10). Different lowercase letters above the bars indicate statistically different mean values within the corresponding panel (P<0.05).
Figure 8
Figure 8. Triggered activity, early after depolarization (EAD) and delayed after depolarization (DAD), was induced by chronic BRD intake.
(A–D) Representative action potential traces after a train of 10 beats at BCLs of 200, 150 and 100 ms followed by a pause in the left ventricle of all studied groups. (C) Representative action potential traces from the BRD group show rate-dependent triggered activity during a pause (arrows) after a train of 10 beats at BCLs of 150 and 100 ms followed by a pause protocol. (D) Los prevented the appearance of BRD-induced triggered activity. (E) In right ventricle BRD induced late-phase 3 EAD and DAD at BCL 1000 ms (arrows).
Figure 9
Figure 9. The increment of ouabain-resistant Na+-ATPase and the decrease of (Na++K+)ATPase activities were similar in cardiomyocytes and renal proximal tubule cells of BRD rats, but the pumps were differentially modulated by Los.
Upper: ouabain-insensitive Na+-ATPase (A, heart, n = 5; B, kidney, n = 5). Lower: (Na++K+)ATPase (C, heart, n = 5; D, kidney, n = 5). Histograms show mean ± SEM. Different lowercase letters above the bars indicate statistically different mean values within the corresponding panel (P<0.05), assessed by one-way ANOVA followed by Tukey test for multiple comparisons.
Figure 10
Figure 10. Chronic BRD intake altered Ang II receptor density in membranes and PKC and PKA activities.
(A–D) AT1R and AT2R density. Upper panels: representative immunostainings (duplicates for each experimental condition) and densitometric representations (lower panels) of 7–12 experiments in duplicate corrected for protein loading (β-actin immunosignals in the corresponding lane, middle panels), which were carried out using different membrane preparations (left panels: heart; right panels: kidney). Different lowercase letters above the bars indicate statistically different mean values within the corresponding panel, assessed by one-way ANOVA followed by Tukey test for multiple comparisons. P values for AT1R comparisons: P<0.001 (BRD against the other three groups in heart, P = 0.607–1.000 when the other groups were compared among them); P<0.001 (BRD and CTR Los against the other two groups in kidney, P<0.001 BRD Los against the other three groups, P = 0.811 BRD versus CTR Los). P values for AT2R comparisons: P = 0.686 (heart, where differences among the four groups were not found and Tukey test was not carried out); P<0.001 (BRD against the other three groups in kidney, P = 0.317–1.000 when the other groups were compared among them). (E–J) PKC and PKA activities (n = 5–7), and PKC/PKA ratio (left panels: heart; right panels: kidney). Different lowercase letters above the bars indicate statistically different mean values within the corresponding panel, also assessed by one-way ANOVA followed by Tukey test.
Figure 11
Figure 11. Na+-ATPase activity and MAPK pathway in heart (left panels) and kidney (right panels).
(A, B) Na+-ATPase activity was measured in the four experimental groups in the absence or presence of 30 µM PD098059, as indicated. Results are mean ± SEM (n = 5) in assays carried out using different membrane preparations. (C, D) Representative immunoblottings of ERK1 in duplicate (upper panels), β-actin loading-controls for each blotting (middle panels) and densitometric representations (n = 8–10) (lower panels). (E, F) Representative immunoblottings of phospho-ERK1/2 in duplicate (upper panels), β-actin loading controls for each blotting (middle panels) and densitometric representations (n = 8–10) (lower panels). (G, H) phospho-ERK1/2∶ERK1 ratio (n = 8–10). Each phospho-ERK1/2∶ERK1 ratio value was calculated using the corresponding densitometric value obtained from the same lane. Different lowercase letters above the bars indicate statistically different mean values within the corresponding panel, assessed by one-way ANOVA followed by Tukey test. P values for ERK1 comparisons: P = 0.302 and 0.968 (heart and kidney, respectively, where no statistical differences were found among the four groups and Tukey test was not carried out). P values for phospho-ERK1/2 comparisons: P = 0.001–0.007 (heart, BRD Los against the other three groups, P = 0.928–0.999 for the comparisons among the other groups); P = 0.928 (kidney, where no statistical differences were found among the four groups and Tukey test was not carried out). P values for phospho-ERK1/2∶ERK1 ratio comparisons: P = 0.004–0.007 (heart, BRD Los against the other four groups, P = 0.995–0.999 for the comparisons among the other groups); P = 0.977 (kidney, no differences among the four groups).
Figure 12
Figure 12. Proposed interactions among Ang II receptors, PKC/PKA, MAPK and ERK1/2 in heart and kidney from BRD rats, ultimately targeting the ouabain-insensitive Na+-ATPase and therefore the fine tuning of Na+ extrusion.
Extracellular-induced stress (low protein and altered local Ang II levels) can induce wrong signaling in the branches linked to AT1R and AT2R as well as increase of MAPK/ERK1/2 turnover. The resulting imbalance (increase) in PKC activity/PKA activity ratio, together with modified ERK1/2 activity, would result in abnormal regulatory phosphorylation(s) of the ouabain-insensitive Na+-ATPase and culminate in the accelerated Los- and PD98059-sensitive turnover of the pump (Figure 9A and 9B). The representation also indicates a possible link between AT1R and MAPK/ERK1/2 according to ref. .

References

    1. Monteiro CA, Benicio MH, Konno SC, Silva AC, Lima AL, et al. (2009) Causes for the decline in child under-nutrition in Brazil, 1996–2007. Rev Saude Publica 43: 35–43. - PubMed
    1. Fowden AL, Giussani DA, Forhead AJ (2006) Intrauterine programming of physiological systems: causes and consequences. Physiology (Bethesda) 21: 29–37. - PubMed
    1. Law CM, de Swiet M, Osmond C, Fayers PM, Barker DJ, et al. (1993) Initiation of hypertension in utero and its amplification throughout life. BMJ 306: 24–27. - PMC - PubMed
    1. Fernandez-Twinn DS, Ekizoglou S, Wayman A, Petry CJ, Ozanne SE (2006) Maternal low-protein diet programs cardiac beta-adrenergic response and signaling in 3-mo-old male offspring. Am J Physiol Regul Integr Comp Physiol 291: R429–436. - PubMed
    1. Langley-Evans SC, Welham SJ, Jackson AA (1999) Fetal exposure to a maternal low protein diet impairs nephrogenesis and promotes hypertension in the rat. Life Sci 64: 965–974. - PubMed

Publication types

MeSH terms