

Men are more likely than women to slow in the marathon
- PMID: 24983344
- PMCID: PMC4289124
- DOI: 10.1249/MSS.0000000000000432
Men are more likely than women to slow in the marathon
Abstract
Studies on nonelite distance runners suggest that men are more likely than women to slow their pace in a marathon.
Purpose: This study determined the reliability of the sex difference in pacing across many marathons and after adjusting women's performances by 12% to address men's greater maximal oxygen uptake and also incorporating information on racing experience.
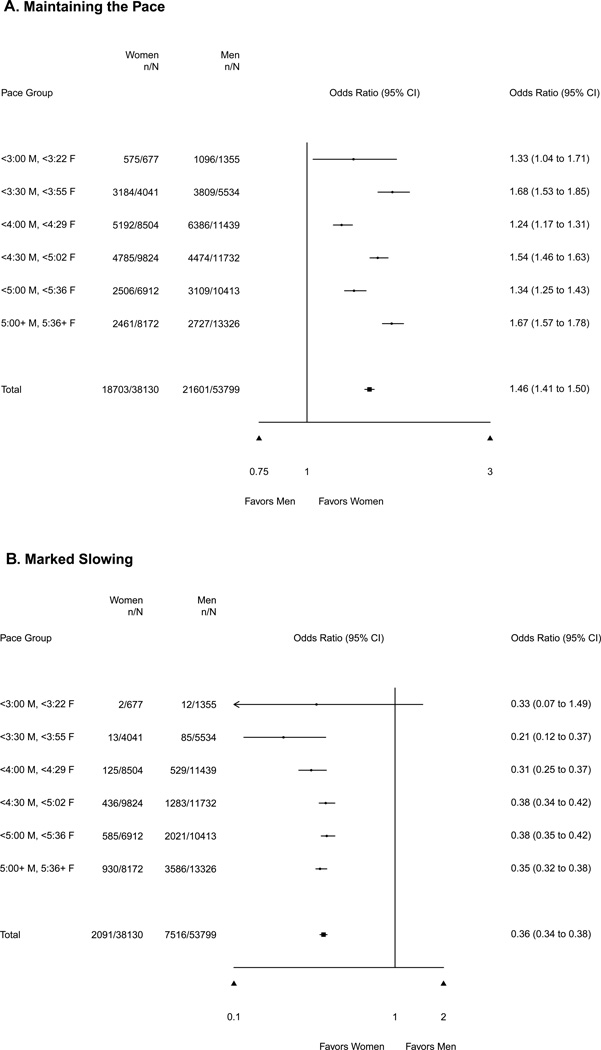
Methods: Data were acquired from 14 US marathons in 2011 and encompassed 91,929 performances. For 2929 runners, we obtained experience data from a race-aggregating Web site. We operationalized pace maintenance as the percentage change in pace observed in the second half of the marathon relative to the first half. Pace maintenance was analyzed as a continuous variable and as two categorical variables, as follows: "maintain the pace," defined as slowing <10%, and "marked slowing," defined as slowing ≥30%.
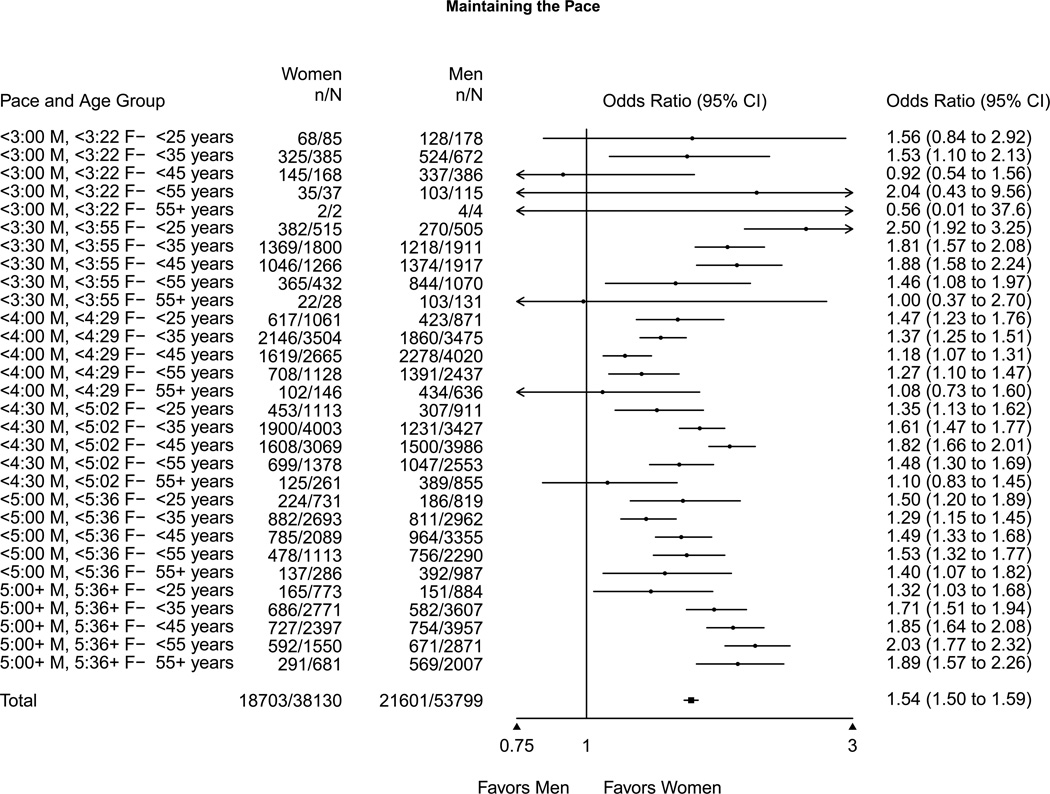
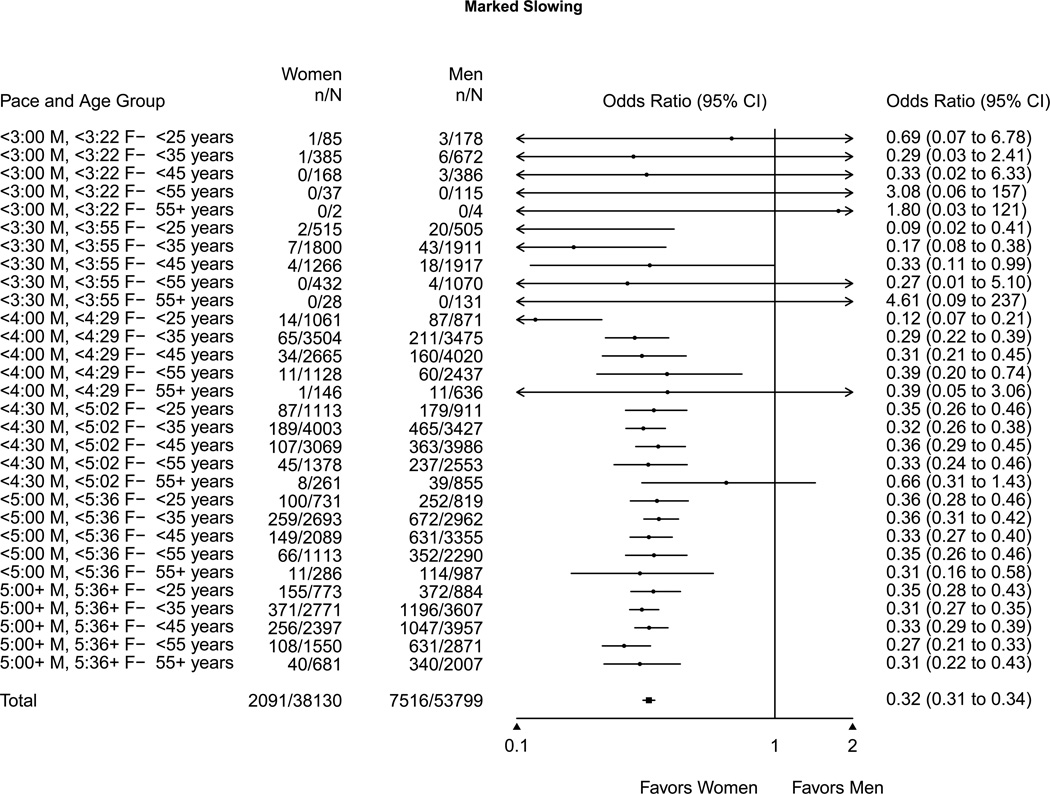
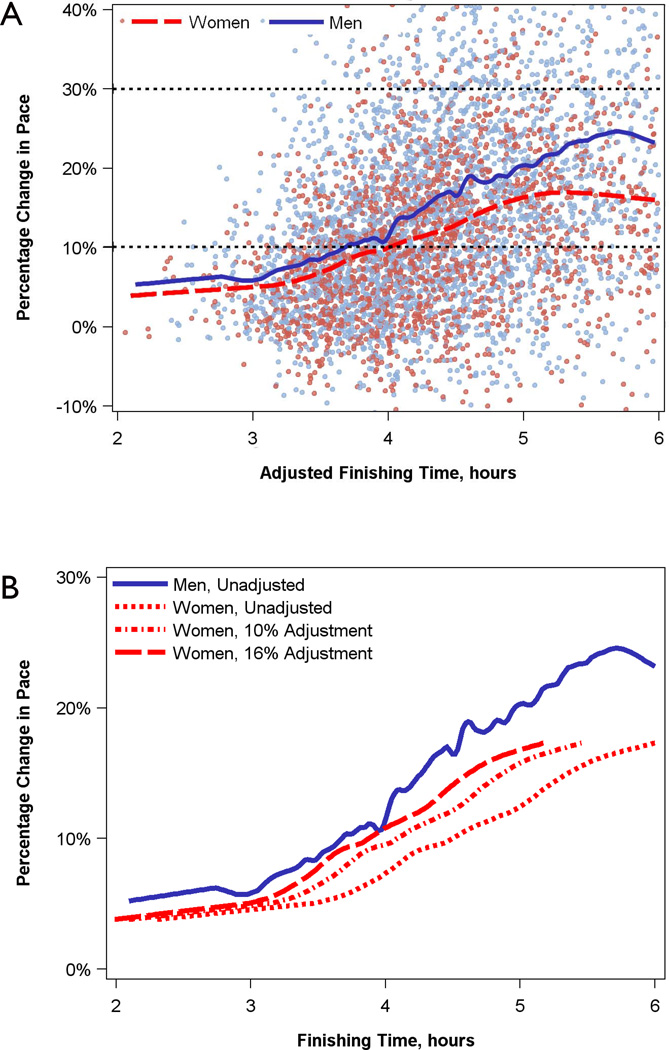
Results: The mean change in pace was 15.6% and 11.7% for men and women, respectively (P < 0.0001). This sex difference was significant for all 14 marathons. The odds for women were 1.46 (95% confidence interval, 1.41-1.50; P < 0.0001) times higher than men to maintain the pace and 0.36 (95% confidence interval, 0.34-0.38; P < 0.0001) times that of men to exhibit marked slowing. Slower finishing times were associated with greater slowing, especially in men (interaction, P < 0.0001). However, the sex difference in pacing occurred across age and finishing time groups. Making the 12% adjustment to women's performances lessened the magnitude of the sex difference in pacing but not its occurrence. Although greater experience was associated with less slowing, controlling for the experience variables did not eliminate the sex difference in pacing.
Conclusions: The sex difference in pacing is robust. It may reflect sex differences in physiology, decision making, or both.
Conflict of interest statement
The authors declare no conflict of interest.
Figures
References
-
- Abbiss CR, Laursen PB. Describing and understanding pacing strategies during athletic competition. Sports Med. 2008;38(3):239–252. - PubMed
-
- Allen EJ, Dechow PM. The “rationality” of the long distance runner: Prospect theory and the marathon. Rochester, NY: Social Science Research Network; 2013. [cited 2013 Dec 15]. Available from: http://papers.ssrn.com/abstract=2342396.
-
- Brooks GA. Lactate: Link between glycolytic and oxidative metabolism. Sports Med. 2007;37(4–5):341–343. - PubMed
-
- Buman MP, Brewer BW, Cornelius AE, Van Raalte JL, Petitpas AJ. Hitting the wall in the marathon: Phenomenological characteristics and associations with expectancy, gender, and running history. Psychol. Sport Exerc. 2008;9(2):177–190.
-
- Byrnes JP, Miller DC, Schafer WD. Gender differences in risk taking: A meta-analysis. Psychol. Bull. 1999;125(3):367–383.
Publication types
MeSH terms
Grants and funding
LinkOut - more resources
Full Text Sources
