

Effects of BMI, fat mass, and lean mass on asthma in childhood: a Mendelian randomization study
- PMID: 24983943
- PMCID: PMC4077660
- DOI: 10.1371/journal.pmed.1001669
Effects of BMI, fat mass, and lean mass on asthma in childhood: a Mendelian randomization study
Abstract
Background: Observational studies have reported associations between body mass index (BMI) and asthma, but confounding and reverse causality remain plausible explanations. We aim to investigate evidence for a causal effect of BMI on asthma using a Mendelian randomization approach.
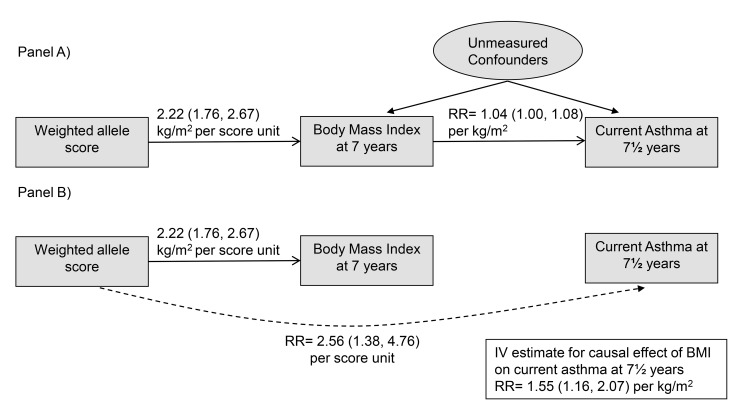
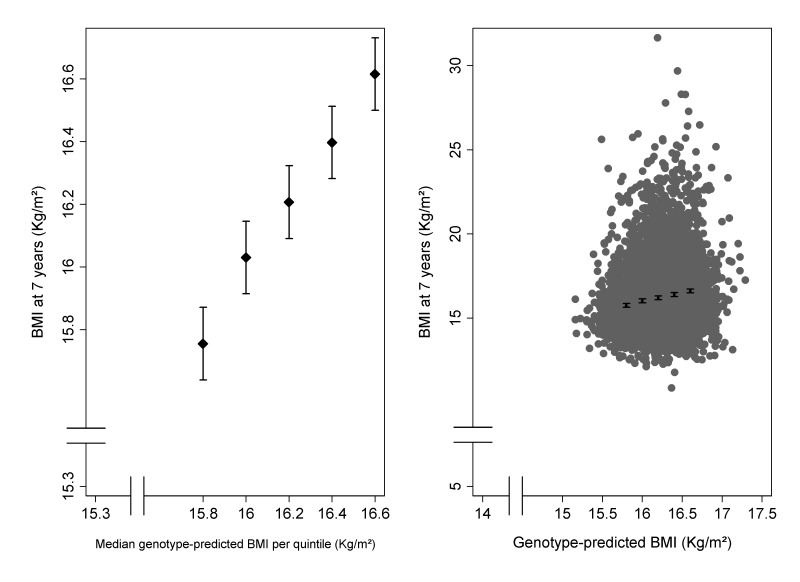
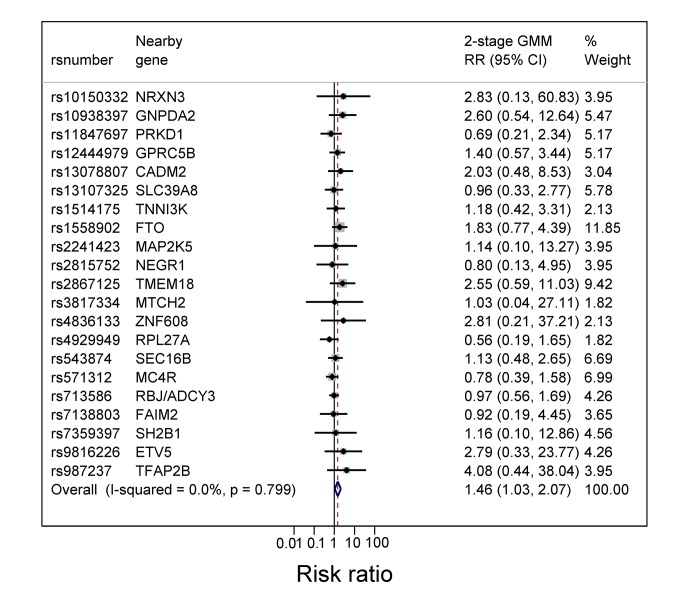
Methods and findings: We used Mendelian randomization to investigate causal effects of BMI, fat mass, and lean mass on current asthma at age 7½ y in the Avon Longitudinal Study of Parents and Children (ALSPAC). A weighted allele score based on 32 independent BMI-related single nucleotide polymorphisms (SNPs) was derived from external data, and associations with BMI, fat mass, lean mass, and asthma were estimated. We derived instrumental variable (IV) estimates of causal risk ratios (RRs). 4,835 children had available data on BMI-associated SNPs, asthma, and BMI. The weighted allele score was strongly associated with BMI, fat mass, and lean mass (all p-values<0.001) and with childhood asthma (RR 2.56, 95% CI 1.38-4.76 per unit score, p = 0.003). The estimated causal RR for the effect of BMI on asthma was 1.55 (95% CI 1.16-2.07) per kg/m2, p = 0.003. This effect appeared stronger for non-atopic (1.90, 95% CI 1.19-3.03) than for atopic asthma (1.37, 95% CI 0.89-2.11) though there was little evidence of heterogeneity (p = 0.31). The estimated causal RRs for the effects of fat mass and lean mass on asthma were 1.41 (95% CI 1.11-1.79) per 0.5 kg and 2.25 (95% CI 1.23-4.11) per kg, respectively. The possibility of genetic pleiotropy could not be discounted completely; however, additional IV analyses using FTO variant rs1558902 and the other BMI-related SNPs separately provided similar causal effects with wider confidence intervals. Loss of follow-up was unlikely to bias the estimated effects.
Conclusions: Higher BMI increases the risk of asthma in mid-childhood. Higher BMI may have contributed to the increase in asthma risk toward the end of the 20th century. Please see later in the article for the Editors' Summary.
Conflict of interest statement
GS is a member of the Editorial Board of
Figures
References
-
- Ford ES (2005) The epidemiology of obesity and asthma. J Allergy Clin Immunol 115: 897–909. - PubMed
-
- Rzehak P, Wijga AH, Keil T, Eller E, Bindslev-Jensen C, et al. (2013) Body mass index trajectory classes and incident asthma in childhood: results from 8 European Birth Cohorts—a Global Allergy and Asthma European Network initiative. J Allergy Clin Immunol 131: 1528–1536. - PubMed
-
- Gilliland FD, Berhane K, Islam T, McConnell R, Gauderman WJ, et al. (2003) Obesity and the risk of newly diagnosed asthma in school-age children. Am J Epidemiol 158: 406–415. - PubMed
Publication types
MeSH terms
Grants and funding
LinkOut - more resources
Full Text Sources
Other Literature Sources
Medical
