. 2014 Jul 1;9(7):e100586.
doi: 10.1371/journal.pone.0100586. eCollection 2014.

Absolute quantitation of Met using mass spectrometry for clinical application: assay precision, stability, and correlation with MET gene amplification in FFPE tumor tissue

Affiliations

Absolute quantitation of Met using mass spectrometry for clinical application: assay precision, stability, and correlation with MET gene amplification in FFPE tumor tissue

Daniel V T Catenacci et al. PLoS One. .

Abstract

Background: Overexpression of Met tyrosine kinase receptor is associated with poor prognosis. Overexpression, and particularly MET amplification, are predictive of response to Met-specific therapy in preclinical models. Immunohistochemistry (IHC) of formalin-fixed paraffin-embedded (FFPE) tissues is currently used to select for 'high Met' expressing tumors for Met inhibitor trials. IHC suffers from antibody non-specificity, lack of quantitative resolution, and, when quantifying multiple proteins, inefficient use of scarce tissue.

Methods: After describing the development of the Liquid-Tissue-Selected Reaction Monitoring-mass spectrometry (LT-SRM-MS) Met assay, we evaluated the expression level of Met in 130 FFPE gastroesophageal cancer (GEC) tissues. We assessed the correlation of SRM Met expression to IHC and mean MET gene copy number (GCN)/nucleus or MET/CEP7 ratio by fluorescence in situ hybridization (FISH).

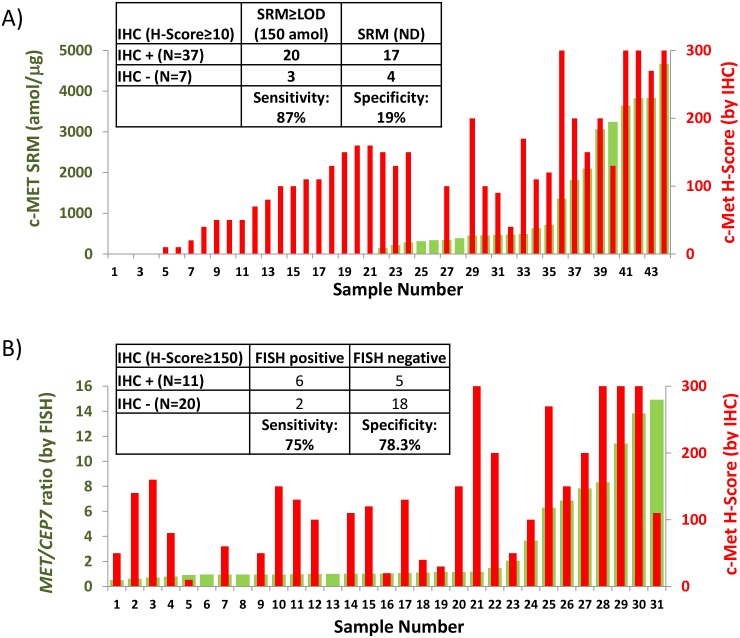
Results: Proteomic mapping of recombinant Met identified 418TEFTTALQR426 as the optimal SRM peptide. Limits of detection (LOD) and quantitation (LOQ) for this peptide were 150 and 200 amol/µg tumor protein, respectively. The assay demonstrated excellent precision and temporal stability of measurements in serial sections analyzed one year apart. Expression levels of 130 GEC tissues ranged (<150 amol/µg to 4669.5 amol/µg. High correlation was observed between SRM Met expression and both MET GCN and MET/CEP7 ratio as determined by FISH (n = 30; R2 = 0.898). IHC did not correlate well with SRM (n = 44; R2 = 0.537) nor FISH GCN (n = 31; R2 = 0.509). A Met SRM level of ≥1500 amol/µg was 100% sensitive (95% CI 0.69-1) and 100% specific (95% CI 0.92-1) for MET amplification.

Conclusions: The Met SRM assay measured the absolute Met levels in clinical tissues with high precision. Compared to IHC, SRM provided a quantitative and linear measurement of Met expression, reliably distinguishing between non-amplified and amplified MET tumors. These results demonstrate a novel clinical tool for efficient tumor expression profiling, potentially leading to better informed therapeutic decisions for patients with GEC.


Conflict of interest statement

Competing Interests: WLL, ST, KB, JU, MD, DBK, TDV, TH, and JB are/were paid employees and stock owners at Oncoplex Dx. DVTC received collaborative research funding from Oncoplex Dx. This does not alter the authors' adherence to PLOS ONE policies on sharing data and materials.

Figures

Figure 1
Figure 1. Liquid Tissue-Selected Reaction Monitoring (SRM) workflow for quantification of proteins from formalin-fixed paraffin-embedded (FFPE) tissue.
Tissue sections are cut onto Director microdissection slides. After they are deparaffinized, areas of interest are identified by pathologists. Laser microdissection is used to procure areas of interest and the targeted cellular material is collected in a tube. The cellular material is processed using the Liquid Tissue protocol, which includes trypsinization, to produce a soluble peptide lysate. A known amount of heavy internal standard peptide is added to the lysate and the sample is analyzed using SRM to measure the absolute abundance of the endogenous peptide of interest.
Figure 2
Figure 2. Development of SRM assay for Met showing the fragmentation spectrum for heavy TEFTTALQR peptide
(A), the standard curve generated in human SK-BR-3 cell lysate (B); inset: the standard curve generated without the highest spiking point (25000 amol). The total ion chromatograms for the light and heavy isotopically labeled peptides are shown (C) along with the transition ions used to identify and quantitate each peptide (D).
Figure 3
Figure 3. Precision assessment for measuring the absolute abundance of Met in 9 NSCLC and 11 GEC FFPE tissues.
Each sample was analyzed on two different liquid chromatography-mass spectrometry systems operated by two different scientists. Red square: Met positive GEC tumors (4/11). Blue square: Met positive NSCLC tumors (5/9).
Figure 4
Figure 4. Comparison of Met levels measured in five different cell lines using Liquid Tissue-SRM and an electrochemiluminescent (ECL) immunoassay.
Inset: comparison of SRM and ECL Met levels measured within the four cell lines containing the lowest concentration of Met.
Figure 5
Figure 5. Temporal reproducibility of FFPE sections processed and analyzed using Liquid Tissue-SRM over one year apart.
SD, standard deviation.
Figure 6
Figure 6. Absolute levels of Met in those GEC tumors above the LOD (45/130) as measured using Liquid Tissue-SRM.
Blue indicates MET gene amplified samples (ratio of MET/CEP7 ≥2) as determined by FISH, and green indicates those not gene amplified (ratio<2). Samples in red were not FISH tested. Sample 36 (526.93 amol/ug) is taken from reference 18 (sample obtained at disease recurrence after initial onartuzumab treatment).
Figure 7
Figure 7. Correlation of Met levels using Liquid Tissue-SRM and MET gene amplification by FISH in 30 GEC tumors.
This cohort includes diploid/low polyploid, high polyploid, and amplified samples. The left y-axis (blue diamond) represents the MET copy number per nucleus and the right y-axis (red square) indicates MET:CEP7 ratio.
Figure 8
Figure 8. IHC to SRM or FISH
assay correlations. Correlation of IHC Met positive H-score to (A) Met SRM (amol/µg) or (B) MET/CEP7 ratio by FISH. Inset tables assess sensitivity/specificity of IHC H-score, assuming SRM (A) and FISH (B) as the comparative standards.
Figure 9
Figure 9. Three-way SRM-IHC-FISH assay correlations.
(A) Correlation of SRM Met level (amol/µg, x-axis) to Met H-Score by IHC (blue, left y-axis) and to FISH MET/CEP7 ratio (red, right y-axis) in GEC FFPE tissues having all three tests performed. Correlation coefficients for the comparisons are in their respective colors. (B) Correlation of FISH MET/CEP7 ratio (x-axis) to Met H-Score by IHC (blue, left y-axis) and to SRM Met level (red, right y-axis) in GEC FFPE tissues having all three tests performed. Correlation coefficients for the comparisons are in their respective colors.

References

    1. Peters S, Adjei AA (2012) MET: a promising anticancer therapeutic target. Nat Rev Clin Oncol 9: 314–326. - PubMed
    1. Cecchi F, Rabe DC, Bottaro DP (2012) Targeting the HGF/Met signaling pathway in cancer therapy. Expert Opin Ther Targets 16: 553–572. - PMC - PubMed
    1. Trusolino L, Bertotti A, Comoglio PM (2010) MET signalling: principles and functions in development, organ regeneration and cancer. Nat Rev Mol Cell Biol 11: 834–848. - PubMed
    1. Catenacci DV, Cervantes G, Yala S, Nelson EA, El-Hashani E, et al. (2011) RON (MST1R) is a novel prognostic marker and therapeutic target for gastroesophageal adenocarcinoma. Cancer Biol Ther 12: 9–46. - PMC - PubMed
    1. Graziano F, Galluccio N, Lorenzini P, Ruzzo A, Canestrari E, et al. (2011) Genetic activation of the MET pathway and prognosis of patients with high-risk, radically resected gastric cancer. J Clin Oncol 29: 4789–4795. - PubMed

Publication types

MeSH terms

Substances