. 2014 Jul 1;9(7):e100591.
doi: 10.1371/journal.pone.0100591. eCollection 2014.

Therapeutic effects of glutamic acid in piglets challenged with deoxynivalenol

Affiliations

Therapeutic effects of glutamic acid in piglets challenged with deoxynivalenol

Miaomiao Wu et al. PLoS One. .

Abstract

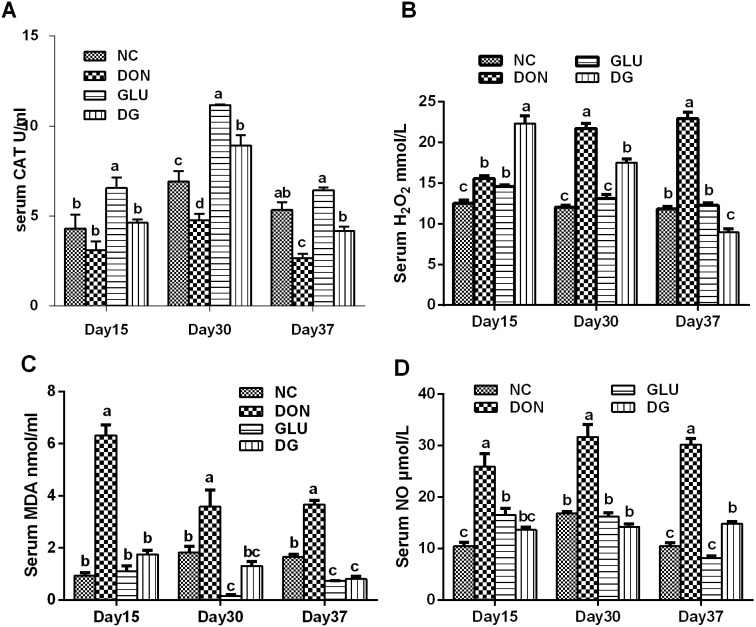
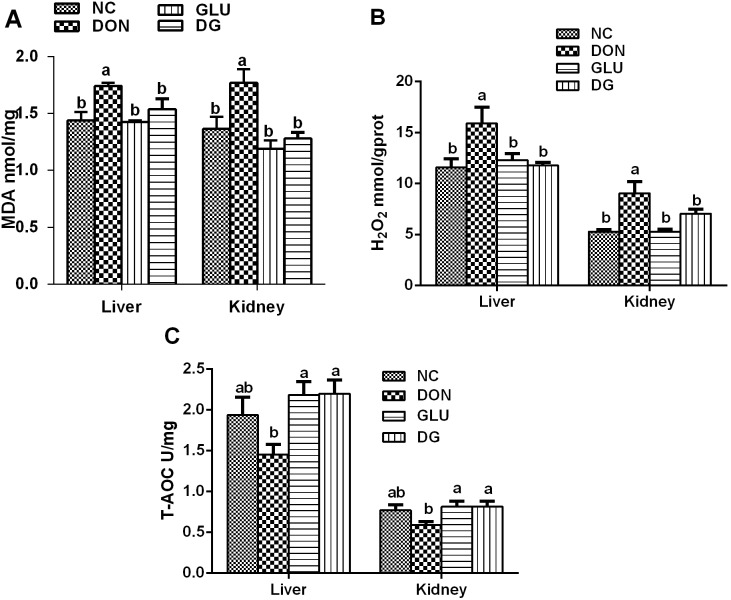
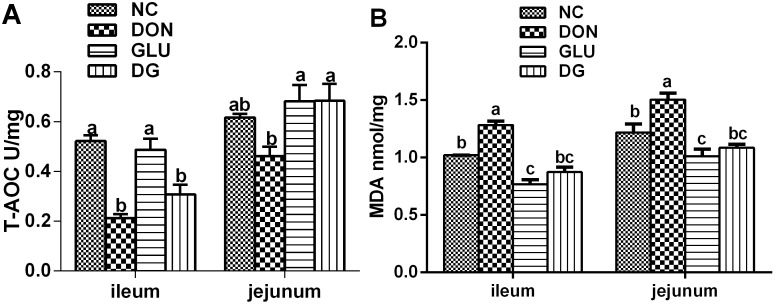
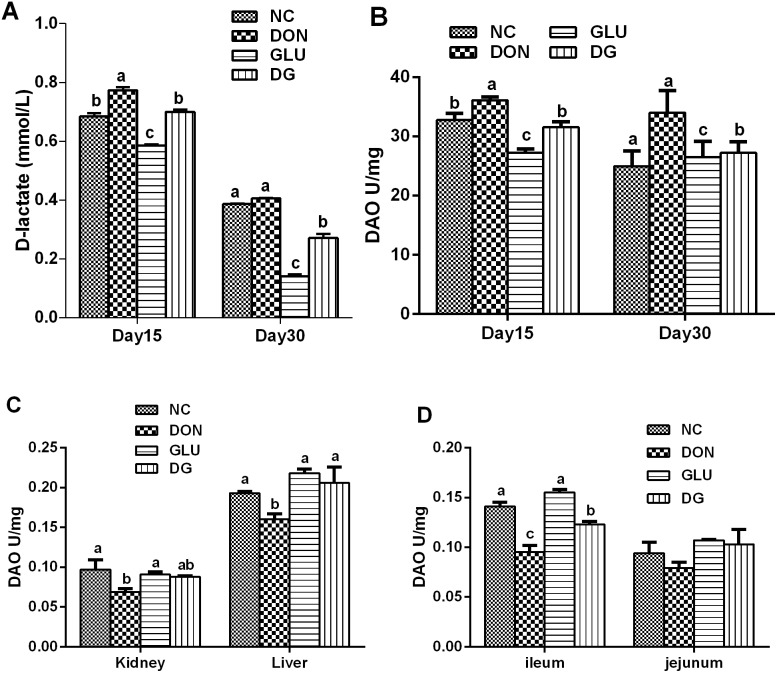
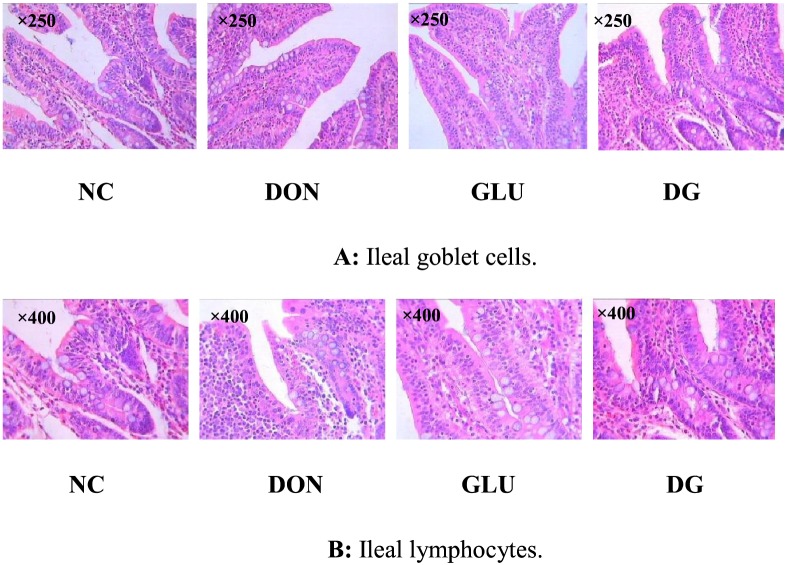
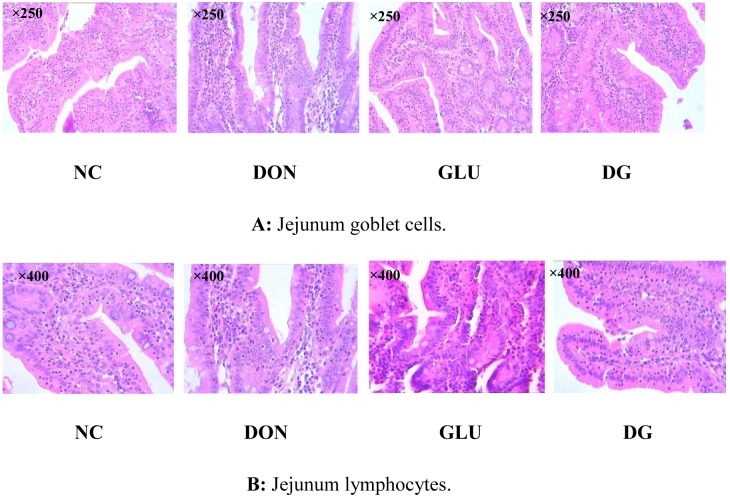
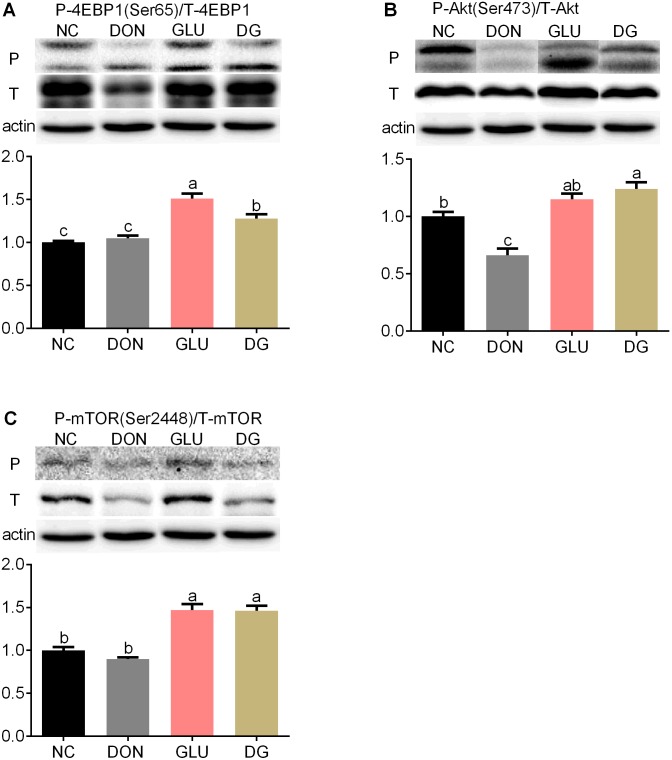
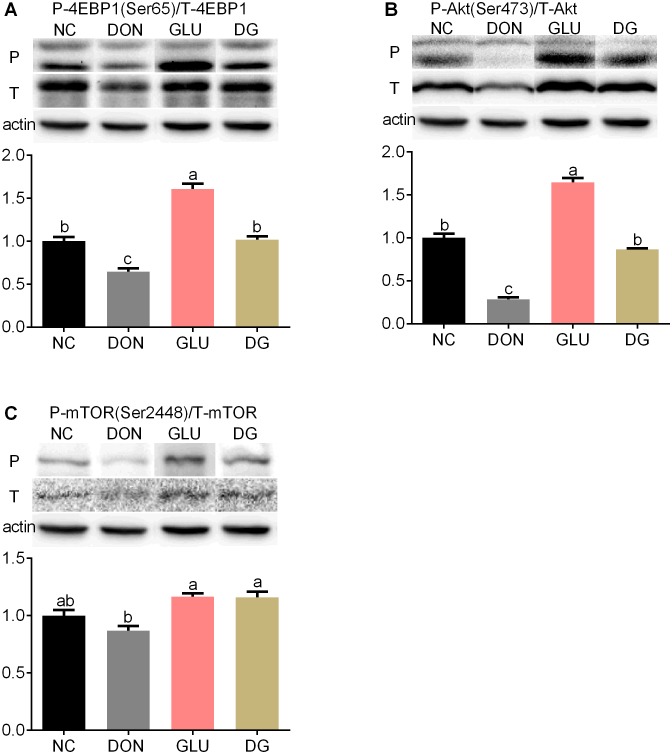
The mycotoxin deoxynivalenol (DON), one of the most common food contaminants, primarily targets the gastrointestinal tract to affect animal and human health. This study was conducted to examine the protective function of glutamic acid on intestinal injury and oxidative stress caused by DON in piglets. Twenty-eight piglets were assigned randomly into 4 dietary treatments (7 pigs/treatment): 1) uncontaminated control diet (NC), 2) NC+DON at 4 mg/kg (DON), 3) NC+2% glutamic acid (GLU), and 4) NC+2% glutamic acid + DON at 4 mg/kg (DG). At day 15, 30 and 37, blood samples were collected to determine serum concentrations of CAT (catalase), T-AOC (total antioxidant capacity), H2O2 (hydrogen peroxide), NO (nitric oxide), MDA (maleic dialdehyde), DAO (diamine oxidase) and D-lactate. Intestinal morphology, and the activation of Akt/mTOR/4EBP1 signal pathway, as well as the concentrations of H2O2, MDA, and DAO in kidney, liver and small intestine, were analyzed at day 37. Results showed that DON significantly (P<0.05) induced oxidative stress in piglets, while this stress was remarkably reduced with glutamic acid supplementation according to the change of oxidative parameters in blood and tissues. Meanwhile, DON caused obvious intestinal injury from microscopic observations and permeability indicators, which was alleviated by glutamic acid supplementation. Moreover, the inhibition of DON on Akt/mTOR/4EBP1 signal pathway was reduced by glutamic acid supplementation. Collectively, these data suggest that glutamic acid may be a useful nutritional regulator for DON-induced damage manifested as oxidative stress, intestinal injury and signaling inhibition.


Conflict of interest statement

Competing Interests: The authors have declared that no competing interests exist.

Figures

Figure 1
Figure 1. Blood anti-oxidative capacity in each group.
A: CAT activity in each group. B: H2O2 concentration in each group. C: MDA concentration in each group. D: NO concentration in each group. Dietary treatments were NC, an uncontaminated basal diet, DON, the basal contaminated with 4 mg/kg deoxynivalenol, GLU, uncontaminated basal diet with 2% (g/g) glutamic acid supplementation, and DG, deoxynivalenol-contaminated (4 mg/kg) basal diet with 2% (g/g) glutamic acid supplementation. Data are presented as means ± SEM, n = 7, with a–c used to indicate a statistically significant difference (P<0.05, one way ANOVA method). CAT: catalase (U/ml); H2O2: hydrogen peroxide (mmol/L); MDA: methane dicarboxylic aldehyde (nmol/ml); NO: nitric oxide (µmol/L).
Figure 2
Figure 2. Liver and kidney anti-oxidative capacity in each group.
A: MDA concentrations of liver and kidney in each group. B: H2O2 concentrations of liver and kidney in each group. C: T-AOC of liver and kidney in each group. Dietary treatments were NC, an uncontaminated basal diet, DON, the basal contaminated with 4 mg/kg deoxynivalenol, GLU, uncontaminated basal diet with 2% (g/g) glutamic acid supplementation, and DG, deoxynivalenol-contaminated (4 mg/kg) basal diet with 2% (g/g) glutamic acid supplementation. Data are presented as means ± SEM, n = 7, with a–b used to indicate a statistically significant difference (P<0.05, one way ANOVA method). MDA: methane dicarboxylic aldehyde (nmol/ml); H2O2: hydrogen peroxide (mmol/L); T-AOC: total antioxidant capacity (U/mg).
Figure 3
Figure 3. Ileum and jejunum anti-oxidative capacity in each group.
A: T-AOC of ileum and jejunum in each group. B: MDA concentrations of ileum and jejunum in each group. Dietary treatments were NC, an uncontaminated basal diet, DON, the basal contaminated with 4 mg/kg deoxynivalenol, GLU, uncontaminated basal diet with 2% (g/g) glutamic acid supplementation, and DG, deoxynivalenol-contaminated (4 mg/kg) basal diet with 2% glutamic acid supplementation. Data are presented as means ± SEM, n = 7, with a–c used to indicate a statistically significant difference (P<0.05, one way ANOVA method). MDA: methane dicarboxylic aldehyde (nmol/ml); T-AOC: total antioxidant capacity (U/mg).
Figure 4
Figure 4. Plasma DAO activity and D-lactate levels in each group.
A: Plasma D-lactate levels in each group on day 15 and day 30. B: Plasma DAO activity in each group on day 15 and day 30. C: DAO activity of kidney and liver in each group. D: DAO activity of ileum and jejunum in each group. Dietary treatments were NC, an uncontaminated basal diet, DON, the basal contaminated with 4 mg/kg deoxynivalenol, GLU, uncontaminated basal diet with 2% (g/g) glutamic acid supplementation, and DG, deoxynivalenol-contaminated (4 mg/kg) basal diet with 2% (g/g) glutamic acid supplementation. Data are presented as means ± SEM, n = 7, with a–d used to indicate a statistically significant difference (P<0.05, one way ANOVA method). DAO: dianine oxidase (U/mg).
Figure 5
Figure 5. Image of ileal goblet cells and ileal lymphocytes.
A: Ileal goblet cells (×250). B: Ileam lymphocytes (×400). Dietary treatments were NC, an uncontaminated basal diet, DON, the basal contaminated with 4 mg/kg deoxynivalenol, GLU, uncontaminated basal diet with 2% (g/g) glutamic acid supplementation, and DG, deoxynivalenol-contaminated (4 mg/kg) basal diet with 2% (g/g) glutamic acid supplementation. n = 7 for treatments.
Figure 6
Figure 6. Image of jejunum goblet cells and jejunum lymphocytes.
A: Jejunum goblet cells (×250). B: Jejunum lymphocytes (×400). Dietary treatments were NC, an uncontaminated basal diet, DON, the basal contaminated with 4 mg/kg deoxynivalenol, GLU, uncontaminated basal diet with 2% (g/g) glutamic acid supplementation, and DG, deoxynivalenol-contaminated (4 mg/kg) basal diet with 2% (g/g) glutamic acid supplementation. n = 7 for treatments.
Figure 7
Figure 7. Activation of mTOR in ileum.
(Up) Representative western blots of total 4EBP1(T-4EBP1), phosphorylated 4EBP1 (Ser65) (P-4EBP1), total Akt (T-Akt), phosphorylated Akt (Ser473) (P-Akt), total mTOR (T- mTOR), phosphorylated mTOR (Ser2448) (P- mTOR) in ileal of piglets fed the various dietary treatments. β-actin was the loading control. (Down) Quantification by image analysis of 4EBP1, Akt and mTOR phosphorylation. Dietary treatments were NC, an uncontaminated basal diet, DON, the basal contaminated with 4 mg/kg deoxynivalenol, GLU, uncontaminated basal diet with 2% (g/g) glutamic acid supplementation, and DG, deoxynivalenol-contaminated (4 mg/kg) basal diet with 2% (g/g) glutamic acid supplementation. n = 7 for treatments.
Figure 8
Figure 8. Activation of mTOR in jejunum.
(Up) Representative western blots of total 4EBP1(T-4EBP1), phosphorylated 4EBP1 (Ser65) (P-4EBP1), total Akt (T-Akt), phosphorylated Akt (Ser473) (P-Akt), total mTOR (T- mTOR), phosphorylated mTOR (Ser2448) (P- mTOR) in jejunum of piglets fed the various dietary treatments. β-actin was the loading control. (Down) Quantification by image analysis of 4EBP1, Akt and mTOR phosphorylation. Dietary treatments were NC, an uncontaminated basal diet, DON, the basal contaminated with 4 mg/kg deoxynivalenol, GLU, uncontaminated basal diet with 2% (g/g) glutamic acid supplementation, and DG, deoxynivalenol-contaminated (4 mg/kg) basal diet with 2% (g/g) glutamic acid supplementation. n = 7 for treatments.

References

    1. AE D (2006) Fusarium mycotoxins: Chemistry, genetics, and biology. St Paul: American Phytopathological Sciety.
    1. Eriksen GS PH (2004) Toxicological evaluation of trichothecenes in animal feed. Anim Feed Sci Technol 114: 205–239.
    1. Felicia W (2007) Measuring the economic impact of Fusarium toxins in animal feeds. Anim Feed Sci Technol 137: 363–374.
    1. Pestka JJ, Smolinski AT (2005) Deoxynivalenol: Toxicology and potential effects on humans. J Toxicol Env Heal B Vrit Rev 8: 39–69. - PubMed
    1. Kolf-Clauw M, Castellote J, Joly B, Bourges-Abella N, Raymond-Letron I, et al. (2009) Development of a pig jejunal explant culture for studying the gastrointestinal toxicity of the mycotoxin deoxynivalenol: histopathological analysis. Toxicol in Vitro 23: 1580–1584. - PubMed

Publication types

LinkOut - more resources