Review
. 2014 Sep:42:44-84.
doi: 10.1016/j.preteyeres.2014.06.003. Epub 2014 Jun 28.

Functional architecture of the retina: development and disease

Affiliations
Review

Functional architecture of the retina: development and disease

Mrinalini Hoon et al. Prog Retin Eye Res. 2014 Sep.

Abstract

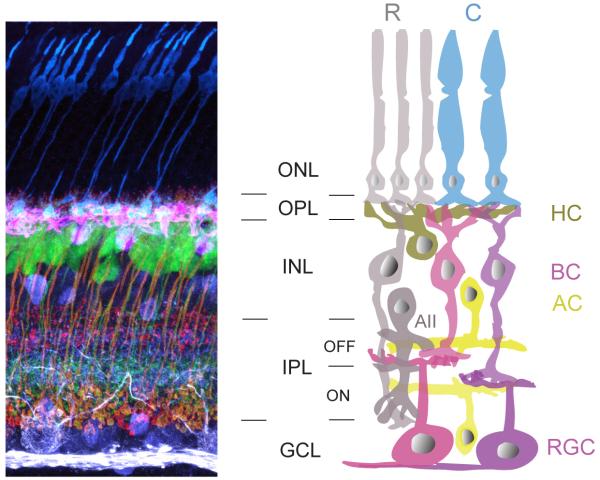
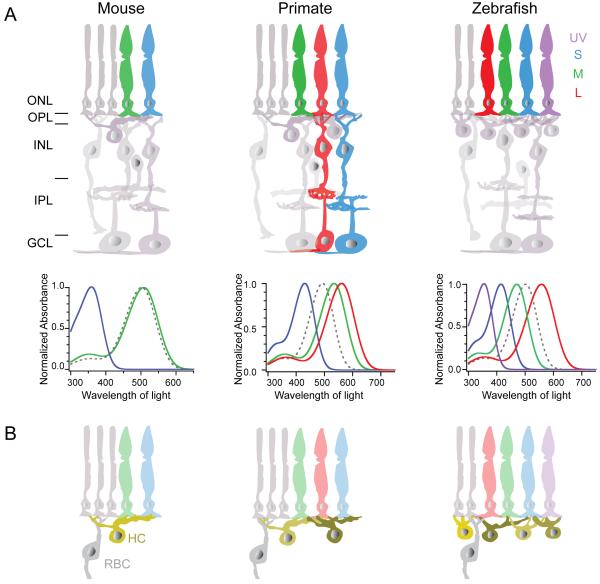
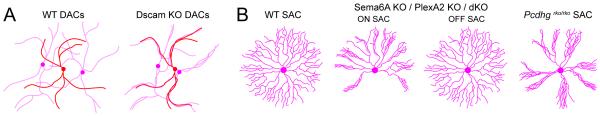
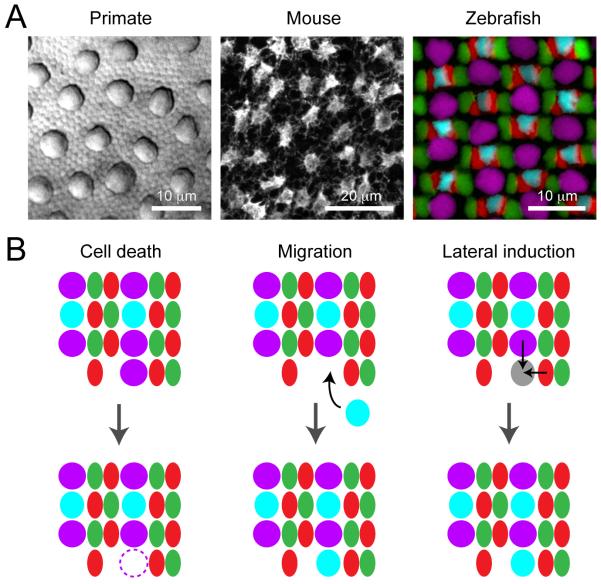
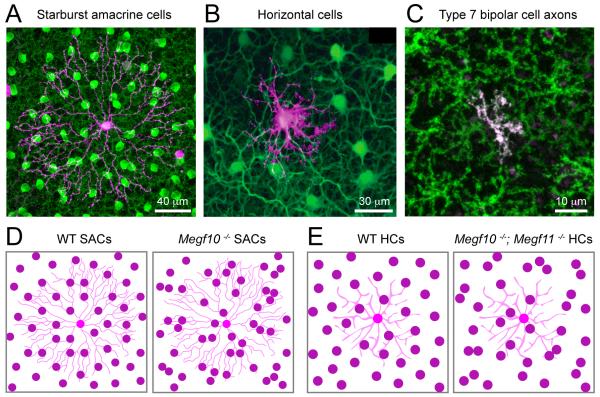
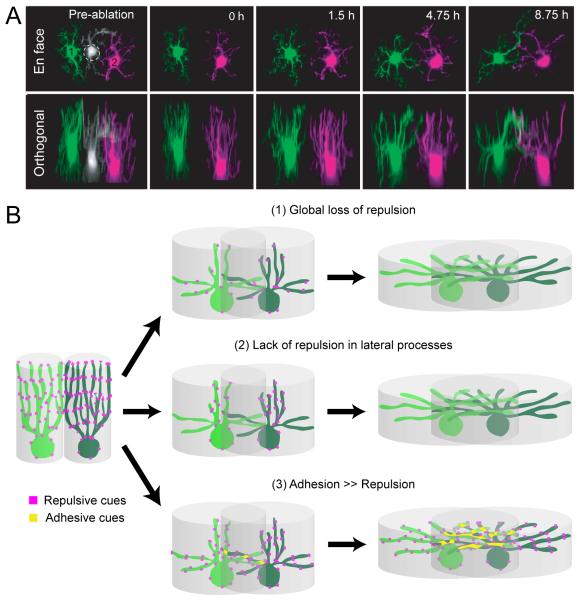
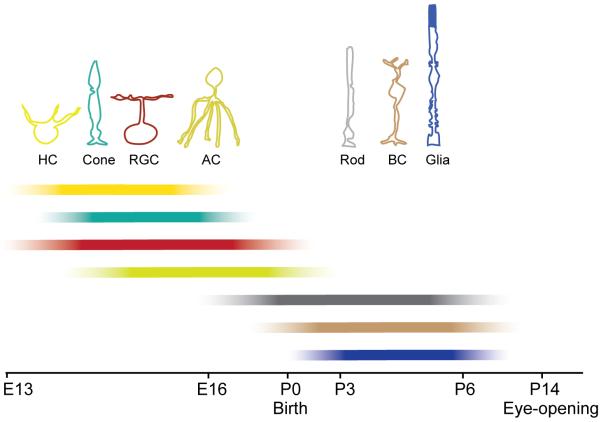
Structure and function are highly correlated in the vertebrate retina, a sensory tissue that is organized into cell layers with microcircuits working in parallel and together to encode visual information. All vertebrate retinas share a fundamental plan, comprising five major neuronal cell classes with cell body distributions and connectivity arranged in stereotypic patterns. Conserved features in retinal design have enabled detailed analysis and comparisons of structure, connectivity and function across species. Each species, however, can adopt structural and/or functional retinal specializations, implementing variations to the basic design in order to satisfy unique requirements in visual function. Recent advances in molecular tools, imaging and electrophysiological approaches have greatly facilitated identification of the cellular and molecular mechanisms that establish the fundamental organization of the retina and the specializations of its microcircuits during development. Here, we review advances in our understanding of how these mechanisms act to shape structure and function at the single cell level, to coordinate the assembly of cell populations, and to define their specific circuitry. We also highlight how structure is rearranged and function is disrupted in disease, and discuss current approaches to re-establish the intricate functional architecture of the retina.

Keywords: Mouse retina; Primate retina; Retinal cell mosaics; Retinal development; Retinal repair; Retinal synapses; Zebrafish retina.


Figures

Figure 1
Figure 1. Schematic organization of neurons in the mammalian retina
(Left) Vertical section of mouse retina showing labeling of the major neuronal cell types. Immunostaining for cone photoreceptors (anti-cone arrestin, blue), horizontal cells (anti-calbindin, pink), bipolar cell terminals (anti-synatotagmin2 and anti-PKC, red), amacrine cells (anti-calretinin, purple), and ganglion cells (SMI-32, white). Immunolabeling was performed on a retina from a transgenic line in which a subtype of bipolar cell (ON-type) express yellow fluorescent protein (green). ONL: outer nuclear layer, OPL: outer plexiform layer, INL: inner nuclear layer, IPL: inner plexiform layer and GCL: ganglion cell layer. (Right) Schematic of the retina. R: rod photoreceptor, C: cone photoreceptor, HC: horizontal cell, BC: bipolar cell, AC: amacrine cell, RGC: retinal ganglion cell. The rod pathway (cells shaded in grey) conveys scotopic information to the photopic cone pathway, via the AII amacrine cell. Colored cells represent cone pathways. Neurons that are depolarized by light increments restrict their synaptic connectivity to the ON sublamina of the IPL, whereas connections of cells that are hyperpolarized instead form the OFF sublamima.
Figure 2
Figure 2. Retinal architecture across species
The retinas of mouse, primate (macaque) and zebrafish exhibit a common basic architecture, but with functional variations. Notably, cone composition (A) varies across these species. UV: ultraviolet, S: short, M: medium, L: long wavelength cones. Primate retina has pathways dedicated for color processing as shown for L and S cone pathways. Illustrations depict the absorption spectra of the various cone opsins across species (bold colored lines) compared to rhodopsin (dotted line) (summarized from: Baylor et al., 1987; Cameron, 2002; Chinen et al., 2003; Govardovskii et al., 2000; Imai et al., 2007; Robinson et al., 1993; Wang et al., 2011). Note that the spectrum of S opsin in mouse retina closely resembles that of UV opsin in zebrafish retina. In addition the cellular distribution and connectivity patterns also vary across species. Shown in B are species differences in the number of horizontal cell (HC) types and the connectivity of rod bipolar cells (RBC). ONL: outer nuclear layer, OPL: outer plexiform layer, INL: inner nuclear layer, IPL: inner plexiform layer and GCL: ganglion cell layer.
Figure 3
Figure 3. Molecular regulation of the branching patterns of amacrine cell neurites
Schematics illustrating the lack of dendritic self-avoidance of two amacrine cell types in mouse mutants. (A) Dopaminergic amacrine cells (DACs) in wildtype (WT) and Dscam knockout (KO) animals. (B) Starburst amacrine cell (SAC) processes in wildtype (WT), Semaphorin6A (Sema6A) KO, plexinA2 (PlexA2) KO, Sema6A-PlexA2 double KO mice or protocadherin KO (Pcdhgrko/rko). Summarized from: Fuerst et al., 2008; Lefebvre et al., 2012; Sun et al., 2013.
Figure 4
Figure 4. Mosaic arrangements of retinal photoreceptors and their formation
(A) Cone photoreceptor distributions in primate (macaque), mouse and zebrafish retina. Macaque retina: Differential interference contrast (DIC) image of peripheral retina. Large profiles are cone photoreceptor inner segments interspersed amongst rod photoreceptors. Mouse retina: Mosaic arrangement of cone pedicles revealed by immunostaining for cone arrestin. Zebrafish: Cone mosaics in adult retina. UV cones, violet; S cones, cyan; M cones; green, L cones, red. Maximum intensity projection of a confocal image stack of a quadruple transgenic line Tg(gnat2:histone2ACFP; sws1:histone2AYFP; trβ2:tdtomato; sws2:GFP). Promoters are: sws1, UV opsin, sws2, S opsin, and trβ2, L opsin. Cones with nuclei labeled by the gnat2 promoter (labels all cones) that did not express UV, S or L opsins were identified as M cones. (Image courtesy: macaque retina, R. Sinha; mouse retina, F. A. Dunn, and zebrafish retina, S. C. Suzuki.) (B) Possible mechanisms that could play a role in organizing the cone photoreceptor mosaic in zebrafish retina.
Figure 5
Figure 5. Mosaic arrangements of retinal cells and their development
(A) Mouse starburst amacrine cells (SAC). Biolistic labeling of a mouse SAC (magenta) together with immunolabeling for choline acetyltransferase (green) to visualize the cell population. The image is a maximum intensity projection of confocal image planes acquired from the ganglion cell layer to the ON sublamina of the IPL in a wholemount retina. (B) Mouse horizontal cell (HC) somata and their dendrites. A HC was intracellularly dye-filled with Alexa-555 (magenta) in the GAD1-GFP transgenic line (green), in which horizontal cells express GFP. (Adapted from Huckfeldt et al., 2009). (C) Mouse bipolar cell axon terminals in the IPL. Individual ON-bipolar cells, including Type 7 bipolar cells, are visualized by tdtomato expression in the grm6-tdTomato transgenic line (Kerschensteiner et al., 2009). Virtually all Type 7 bipolar cells are labeled in the Gus8.4-GFP (Wong et al., 1999) line (Huang et al., 2003). A retina from a double transgenic animal shows an individual Type 7 bipolar cell (magenta-white) within the Type 7 population (green). Image adapted from Dunn and Wong, 2012. (D) Illustration depicting the disruption of the cell body mosaic arrangement of SACs in the Megf10-deficient (Megf10−/−) mouse retina (Kay et al., 2012). The dendritic arbor of an individual SAC is provided in the background. (E) Illustration showing perturbation of HC mosaics in Megf10/11-double knockout (Megf10−/−; Megf11−/−) animals (Kay et al., 2012). Dendritic arbor of an HC is illustrated in the background.
Figure 6
Figure 6. Possible mechanisms regulating retinal mosaic development
(A) Immature horizontal cells transiently project vertical processes that form non-overlapping territories before extending lateral dendrites that overlap at maturity. Shown here are two developing horizontal cells labeled in the GAD1-GFP transgenic mouse retina, pseudocolored in green and magenta imaged with time-lapse multiphoton microscopy (h, hour). The vertical arbors of these immature cells re-tile after laser-ablation of a neighbor, suggesting that homotypic interactions regulate spacing between neighbors. Image adapted from Huckfeldt et al., Nat Neurosci., 2009. (B) Illustrations of how potential adhesive and repulsive interactions could mediate homotypic interactions among neighboring horizontal cells that initially define their cell body mosaic arrangement, and later permit overlap of their lateral dendrites. For example repulsive cues could be downregulated either all through the horizontal cell arbor (1) or specifically from lateral processes (2) to permit dendritic overlap of mature horizontal cells. Additionally, adhesive cues (3) could facilitate dendritic overlap between neighboring horizontal cells.
Figure 7
Figure 7. Formation of the foveal specialization in primate retina
(A) Schematic illustrating how the density of cone photoreceptors increases in the primate (macaque) fovea as the retina develops (Fd: fetal day, P: Postnatal, wk: week). Retina size at each age is drawn to scale. (B) Schematic depicting the re-arrangements of retinal cells during foveal pit formation in macaque retina. Cone photoreceptors in the outer nuclear layer (ONL) increase in density at the foveal pit (Hendrickson, 1992), whereas second order neurons in the inner nuclear layer (INL) and ganglion cell layer (GCL) are pushed aside and decrease their density concurrently. Asterisk depicts increase in cone density at the center of the foveal pit.
Figure 8
Figure 8. Molecular interactions generating opsin expression gradients in the mouse retina
(A) Expression of S opsin follows a dorsal (low) to ventral (high) gradient in mouse retina. Images show immunostaining for S opsin (cyan) and cone-arrestin that labels all cones of an adult mouse retina (red)(Images by F. A. Dunn). D: dorsal, V: ventral, S: S opsin, M: M opsin. (B) Several morphogens, transcription factors, hormones and nuclear hormone receptors contribute towards generating the gradients of opsin expression. Summarized are the spatial expression patterns of known factors. N.D. : not determined. (C) Illustration of the action of known nuclear hormone receptors that could regulate M and S opsin expression in the mouse retina. (+) Promotes, (−) suppresses. (Schematics in B and C summarized from Alfano et al., 2011; Fujieda et al., 2009; Koshiba-Takeuchi et al., 2000; McCaffery et al., 1992; Ng et al., 2001; Peters and Cepko, 2002; Roberts et al., 2005; Roberts et al., 2006; Satoh et al., 2009; Srinivas et al., 2006; Zhang and Yang, 2001).
Figure 9
Figure 9. Timeline for cell genesis in the vertebrate retina
Sequence of cell genesis in the vertebrate retina, schematized here for the mouse. Horizontal cells (HCs), cone photoreceptors (cone) and retinal ganglion cells (RGC) are the first cells to be generated. Amacrine cell (AC) genesis follows, with their peak production occurring around embryonic day 16 (E16). Rod photoreceptors (rod) have a protracted period of genesis beginning before birth and continuing until a week after birth. Bipolar cells (BC) and Müller glial cells (Glia) are produced postnatally (P) until about a week after birth (summarized from Marquardt and Gruss, 2002; Rapaport et al., 2004; Young, 1985). Bars demonstrate the progressive increase and later decrease in neurogenesis as indicated by the intensity gradient.
Figure 10
Figure 10. Molecular cues guiding retinal lamination
(A-B) Schematic showing the expression pattern of heterotypic repulsive (mouse, A) and homotypic adhesive (chick, B) molecular cues across different laminae of the retina. Expression for Sema5A/5B revealed by in situ hybridization, and expression for all other molecules was determined by immunolabeling. (C) Illustration showing aberrant lamination of mouse retinal cell types when semaphorin (Sema)-plexin (Plex) signaling is disrupted compared to wildtype retina (WT). KO: knockout, dKO: double knockout, M1 RGC: Type 1 melanopsin positive ganglion cell, DAC: dopaminergic amacrine cell, T2 BC: Type 2 OFF-cone bipolar cells, RBC: rod bipolar cell, HC: horizontal cell and SAC: starburst amacrine cell. (D) Schematic showing disrupted dendritic lamination of R-cadherin (R-cad+) positive ganglion cell in the Dscam knockdown (by RNAi) retina, and unusual lamination of substance P positive (SP+) amacrine cells in sidekick1 (Sdk1) over-expressing (OE) chick retina. Summarized from Matsuoka et al., 2011a; Matsuoka et al., 2012; Matsuoka et al., 2011b; Sun et al., 2013; Yamagata and Sanes, 2008, ; Yamagata et al., 2002.
Figure 11
Figure 11. Synaptic connectivity at the OPL
Schematics and ultrastructure of cone and rod photoreceptor synapses and receptor composition at each synapse type. ON BC: ON-cone bipolar cell, OFF BC: OFF-cone bipolar cell, RBC: rod bipolar cell, HC: horizontal cell. Metabotropic glutamate receptors (mGluR6) on ON-bipolar cell dendrites mediate a hyperpolarization (sign-inverting) response to glutamate, whereas ionotropic glutamate receptors (AMPA and Kainate receptors) mediate a sign-conserving response in OFF-bipolar cells and horizontal cells. As different species or different OFF-bipolar subtypes express Kainate and/or AMPA receptor both are represented in the schematic, but OFF-bipolar cells in mouse and macaque retina primarily use Kainate receptors for signal transmission through the OPL (see text for details). Red arrow indicates negative feedback and black arrow indicates feedforward modulation. Electron micrographs of rod and cone photoreceptor terminals are from mouse retina. Arrow in electron micrograph points to a ribbon.
Figure 12
Figure 12. Assembly of OPL synapses
(A) Schematic illustrating the formation of the photoreceptor triad at the OPL. Horizontal cells (HCs) contact photoreceptors first, followed by dendrites of ON-bipolar cells (ON BC) and later by the dendrites of OFF-bipolar cells (OFF BC). Ribbons and associated vesicles are shown in red and purple. (B) Relative expression levels of pre- and postsynaptic proteins in the OPL at different time-points from immunohistochemistry of rodent retina (summarized from: Dick et al., 2003; Dunn et al., 2013; Guo et al., 2009; Hack et al., 2002; Johnson et al., 2003; Koulen, 1999; Nomura et al., 1994; Regus-Leidig et al., 2009; Ribic et al., 2014). The color gradients are representative of the total expression of the synaptic proteins, rather than their distribution pattern.
Figure 13
Figure 13. Mechanisms regulating synapses at the OPL
Schematic summary of the role of synapse organizing molecules in the mouse retina that establish connectivity between: (A) rod photoreceptors (Rod) and rod bipolar cells (RBC), (B) cone photoreceptors (Cone) and ON cone bipolar cells (ON BC) and (C) rod photoreceptors and horizontal cells (HC) (summarized from: Dick et al., 2003; Dunn et al., 2013; Omori et al., 2012; Ribic et al., 2014; Sato et al., 2008; Soto et al., 2013). The presence of mGluR6 on cone bipolar cell (CBC) dendrites in the bassoon KO has not been determined and is thus represented with a question mark.
Figure 14
Figure 14. Synaptic connectivity in the IPL
Schematics showing basic organizations of cone bipolar cell (CBC) and rod bipolar cell (RBC) synapses. Neurotransmitter receptor types are shown. AC: amacrine cell, RGC: retinal ganglion cell. Only AI/A17 and AII amacrine cells are postsynaptic to RBCs. Examples of the ultrastructure of bipolar and amacrine cell synapses in mouse retina are provided in the electron micrographs. Arrow indicates ribbon.
Figure 15
Figure 15. Synapse assembly in the IPL
(A) Sequential development of synapses in the IPL. Amacrine cells (ACs) first establish contact with dendrites of retinal ganglion cells (RGC) and other amacrine cells. Next, bipolar cell (BC) terminals synapse onto ganglion cells. Thereafter, presynaptic inhibition provided by amacrine cells is established at the axon terminals of bipolar cells (see text for details). (B) Relative expression levels of excitatory and inhibitory synaptic proteins at different time-points in the IPL from immunolabeling experiments carried out in rodent retina (summarized from: Fletcher and Kalloniatis, 1997; Guo et al., 2009; Hack et al., 2002; Johnson et al., 2003; Kim et al., 2000; Koulen, 1999; Sassoe-Pognetto and Wässle, 1997; Witkovsky et al., 2005). The color gradients are representative of the total expression of the synaptic proteins, rather than their distribution pattern. Note for synaptic proteins mediating excitatory neurotransmission AMPA (GluA1-4) receptors seem to be expressed prior to Kainate (GluK2/3 and GluK5) receptors in the developing IPL. On the other hand, inhibitory neurotransmitters GABA and glycine seem to be expressed at a similar timeline. The receptors mediating inhibitory neurotransmission, however, reach adult expression levels at different time-points with GABAAα2 and GABAAα3 receptors preceding GABAAα1 and GlyRα1 receptors.
Figure 16
Figure 16. Role of neurotransmission in regulating synaptic connectivity in the mouse IPL
(A) Synapse number between cone bipolar cells (CBC) and ganglion cells (RGC) is regulated by neurotransmission. Type 6 bipolar cells that express tetanus toxin (TeNT) make fewer synapses with dendrites of large-field ON alpha-like ganglion cells compared to wildtype (WT) bipolar cells (Kerschensteiner et al., 2009; Morgan et al., 2011; Okawa et al., 2014). (B) GABAergic neurotransmission is necessary for maintaining specific GABA receptor subtypes on rod bipolar cell (RBC) axon terminals. Impairing inhibitory neurotransmission from amacrine cells (ACs) in the GAD67 (GABA synthetic enzyme) deficient (GAD1 mutant) retina leads to a reduction in GABAA but not GABAC receptors on RBC axon terminals (Schubert et al., 2013).
Figure 17
Figure 17. Convergence and divergence of connectivity in the zebrafish retina
(A-B) Convergence of photoreceptor (UV and S cone) input onto the H3 subtype of horizontal cells (HC). Cx55.5:Gal4;UAS:MFP plasmid was injected at the one-cell stage to label the H3 horizontal cells (yellow) in double transgenic (sws1:GFP;sws2:mcherry) fish with both UV (pseudocolored magenta) and S cones (pseudocolored cyan) labeled by expression of different fluorescent proteins. (C-E) Divergence of photoreceptor (L cone, pseudocolored cyan) output onto ON (yellow) and OFF (magenta) subclasses of bipolar cells (BC). Confocal reconstructions acquired from triple transgenic Tg(trβ2:tdTomato;vsx1:MCerulean;nyx:Gal4;UAS:MYFP) fish where the various cell types expressed different fluorescent proteins. Trβ2 drives expression in L cones; vsx1 in some OFF BCs; nyx in ON BCs. (B,D,E) Arrowheads indicate dendritic tips inserting into the cone pedicles. (Image courtesy, T. Yoshimatsu.)
Figure 18
Figure 18. Large-scale changes in retinal structure in disease
(A) Examples of perturbations to spatial arrangements of cell layers. GCL: ganglion cell layer, INL: inner nuclear layer, ONL: outer nuclear layer. (B) Common spatial patterns of cell loss across the retina (large circle). Relative extent of cell loss represented by gray scale: dark regions correspond to regions of extensive cell loss (see Table 1). Small circle: optic nerve head.
Figure 19
Figure 19. Cell death, functional alterations and secondary remodeling of the diseased retina
(Left column) Neuronal types (red) primarily affected by retinal disease. (Middle column) Scotopic and photopic electroretinograms (ERGs) of normal animals and of animals afflicted by disease. (Right column) Neurons commonly undergoing remodeling (colored) after cell loss (shown in red in left column). Pr: photoreceptor, Rod: Rod photoreceptor, Cone: Cone photoreceptor, HC: horizontal cell, BC: bipolar cell, CBC, cone bipolar cell, RBC: rod bipolar cell, RGC: retinal ganglion cell.

References

    1. Abbott CJ, Percival KA, Martin PR, Grunert U. Amacrine and bipolar inputs to midget and parasol ganglion cells in marmoset retina. Vis Neurosci. 2012;29:157–168. - PubMed
    1. Ahnelt P, Kolb H. Horizontal cells and cone photoreceptors in primate retina: a Golgi-light microscopic study of spectral connectivity. J Comp Neurol. 1994;343:387–405. - PubMed
    1. Alfano G, Conte I, Caramico T, Avellino R, Arno B, Pizzo MT, Tanimoto N, Beck SC, Huber G, Dolle P, Seeliger MW, Banfi S. Vax2 regulates retinoic acid distribution and cone opsin expression in the vertebrate eye. Development. 2011;138:261–271. - PubMed
    1. Allison WT, Barthel LK, Skebo KM, Takechi M, Kawamura S, Raymond PA. Ontogeny of cone photoreceptor mosaics in zebrafish. J Comp Neurol. 2010;518:4182–4195. - PMC - PubMed
    1. Applebury ML, Antoch MP, Baxter LC, Chun LL, Falk JD, Farhangfar F, Kage K, Krzystolik MG, Lyass LA, Robbins JT. The murine cone photoreceptor: a single cone type expresses both S and M opsins with retinal spatial patterning. Neuron. 2000;27:513–523. - PubMed

Publication types