

Building the sugarcane genome for biotechnology and identifying evolutionary trends
- PMID: 24984568
- PMCID: PMC4122759
- DOI: 10.1186/1471-2164-15-540
Building the sugarcane genome for biotechnology and identifying evolutionary trends
Abstract
Background: Sugarcane is the source of sugar in all tropical and subtropical countries and is becoming increasingly important for bio-based fuels. However, its large (10 Gb), polyploid, complex genome has hindered genome based breeding efforts. Here we release the largest and most diverse set of sugarcane genome sequences to date, as part of an on-going initiative to provide a sugarcane genomic information resource, with the ultimate goal of producing a gold standard genome.
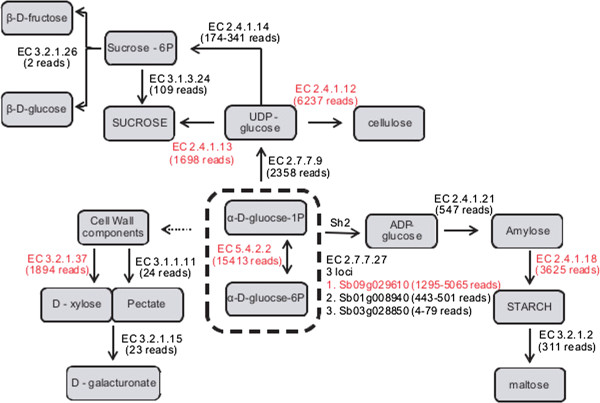
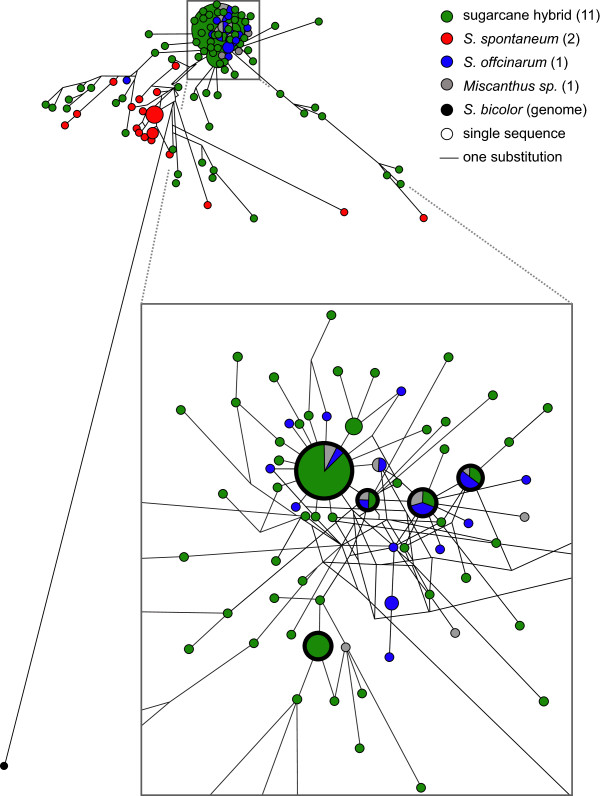
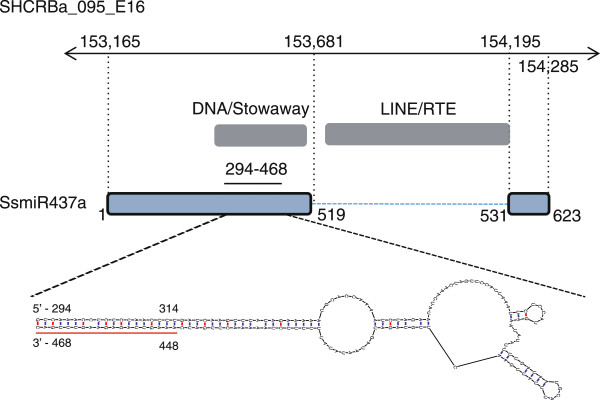
Results: Three hundred and seventeen chiefly euchromatic BACs were sequenced. A reference set of one thousand four hundred manually-annotated protein-coding genes was generated. A small RNA collection and a RNA-seq library were used to explore expression patterns and the sRNA landscape. In the sucrose and starch metabolism pathway, 16 non-redundant enzyme-encoding genes were identified. One of the sucrose pathway genes, sucrose-6-phosphate phosphohydrolase, is duplicated in sugarcane and sorghum, but not in rice and maize. A diversity analysis of the s6pp duplication region revealed haplotype-structured sequence composition. Examination of hom(e)ologous loci indicate both sequence structural and sRNA landscape variation. A synteny analysis shows that the sugarcane genome has expanded relative to the sorghum genome, largely due to the presence of transposable elements and uncharacterized intergenic and intronic sequences.
Conclusion: This release of sugarcane genomic sequences will advance our understanding of sugarcane genetics and contribute to the development of molecular tools for breeding purposes and gene discovery.
Figures


References
-
- European Commission: Agriculture and Rural Development: Sugarhttp://ec.europa.eu/agriculture/sugar/index_en.htm
Publication types
MeSH terms
Substances
Associated data
- Actions
- Actions
- Actions
- Actions
- Actions
- Actions
- Actions
- Actions
- Actions
- Actions
- Actions
- Actions
- Actions
- Actions
- Actions
- Actions
- Actions
- Actions
- Actions
- Actions
- Actions
- Actions
- Actions
- Actions
- Actions
- Actions
- Actions
- Actions
- Actions
- Actions
- Actions
- Actions
- Actions
- Actions
- Actions
- Actions
- Actions
- Actions
- Actions
- Actions
- Actions
- Actions
- Actions
- Actions
- Actions
- Actions
- Actions
- Actions
- Actions
- Actions
- Actions
- Actions
- Actions
- Actions
- Actions
- Actions
- Actions
- Actions
- Actions
- Actions
- Actions
- Actions
- Actions
- Actions
- Actions
- Actions
- Actions
- Actions
- Actions
- Actions
- Actions
- Actions
- Actions
- Actions
- Actions
- Actions
- Actions
- Actions
- Actions
- Actions
- Actions
- Actions
- Actions
- Actions
- Actions
- Actions
- Actions
- Actions
- Actions
- Actions
- Actions
- Actions
- Actions
- Actions
- Actions
- Actions
- Actions
- Actions
- Actions
- Actions
- Actions
- Actions
- Actions
- Actions
- Actions
- Actions
- Actions
- Actions
- Actions
- Actions
- Actions
- Actions
- Actions
- Actions
- Actions
- Actions
- Actions
- Actions
- Actions
- Actions
- Actions
- Actions
- Actions
- Actions
- Actions
- Actions
- Actions
- Actions
- Actions
- Actions
- Actions
- Actions
- Actions
- Actions
- Actions
- Actions
- Actions
- Actions
- Actions
- Actions
- Actions
- Actions
- Actions
- Actions
- Actions
- Actions
- Actions
- Actions
- Actions
- Actions
- Actions
- Actions
- Actions
- Actions
- Actions
- Actions
- Actions
- Actions
- Actions
- Actions
- Actions
- Actions
- Actions
- Actions
- Actions
- Actions
- Actions
- Actions
- Actions
- Actions
- Actions
- Actions
- Actions
- Actions
- Actions
- Actions
- Actions
- Actions
- Actions
- Actions
- Actions
- Actions
- Actions
- Actions
- Actions
- Actions
- Actions
- Actions
- Actions
- Actions
- Actions
- Actions
- Actions
- Actions
- Actions
- Actions
- Actions
- Actions
- Actions
- Actions
- Actions
- Actions
- Actions
- Actions
- Actions
- Actions
- Actions
- Actions
- Actions
- Actions
- Actions
- Actions
- Actions
- Actions
- Actions
- Actions
- Actions
- Actions
- Actions
- Actions
- Actions
- Actions
- Actions
- Actions
- Actions
- Actions
- Actions
- Actions
- Actions
- Actions
- Actions
- Actions
- Actions
- Actions
- Actions
- Actions
- Actions
- Actions
- Actions
- Actions
- Actions
- Actions
- Actions
- Actions
- Actions
- Actions
- Actions
- Actions
- Actions
- Actions
- Actions
- Actions
- Actions
- Actions
- Actions
- Actions
- Actions
- Actions
- Actions
- Actions
- Actions
- Actions
- Actions
- Actions
- Actions
- Actions
- Actions
- Actions
- Actions
- Actions
- Actions
- Actions
- Actions
- Actions
- Actions
- Actions
- Actions
- Actions
- Actions
- Actions
- Actions
- Actions
- Actions
- Actions
- Actions
- Actions
- Actions
- Actions
- Actions
- Actions
- Actions
- Actions
- Actions
- Actions
- Actions
- Actions
- Actions
- Actions
- Actions
- Actions
- Actions
- Actions
- Actions
- Actions
- Actions
- Actions
- Actions
- Actions
- Actions
- Actions
- Actions
- Actions
- Actions
- Actions
- Actions
- Actions
- Actions
- SRA/SRX500284
LinkOut - more resources
Full Text Sources
Other Literature Sources
