. 2014 Jul;24(7):1086-101.
doi: 10.1101/gr.170100.113.

Comparison of D. melanogaster and C. elegans developmental stages, tissues, and cells by modENCODE RNA-seq data

Affiliations

Comparison of D. melanogaster and C. elegans developmental stages, tissues, and cells by modENCODE RNA-seq data

Jingyi Jessica Li et al. Genome Res. 2014 Jul.

Abstract

We report a statistical study to discover transcriptome similarity of developmental stages from D. melanogaster and C. elegans using modENCODE RNA-seq data. We focus on "stage-associated genes" that capture specific transcriptional activities in each stage and use them to map pairwise stages within and between the two species by a hypergeometric test. Within each species, temporally adjacent stages exhibit high transcriptome similarity, as expected. Additionally, fly female adults and worm adults are mapped with fly and worm embryos, respectively, due to maternal gene expression. Between fly and worm, an unexpected strong collinearity is observed in the time course from early embryos to late larvae. Moreover, a second parallel pattern is found between fly prepupae through adults and worm late embryos through adults, consistent with the second large wave of cell proliferation and differentiation in the fly life cycle. The results indicate a partially duplicated developmental program in fly. Our results constitute the first comprehensive comparison between D. melanogaster and C. elegans developmental time courses and provide new insights into similarities in their development . We use an analogous approach to compare tissues and cells from fly and worm. Findings include strong transcriptome similarity of fly cell lines, clustering of fly adult tissues by origin regardless of sex and age, and clustering of worm tissues and dissected cells by developmental stage. Gene ontology analysis supports our results and gives a detailed functional annotation of different stages, tissues and cells. Finally, we show that standard correlation analyses could not effectively detect the mappings found by our method.


Figures

Figure 1.
Figure 1.
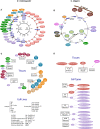
Life cycles and modENCODE RNA-seq data sets of D. melanogaster and C. elegans (Gerstein et al. 2014). (A) modENCODE RNA-seq data sets of 30 different D. melanogaster developmental stages. (B) modENCODE RNA-seq data sets of 35 different C. elegans developmental stages. (C) modENCODE RNA-seq data sets of 29 tissues and 19 cell lines in D. melanogaster. (D) modENCODE RNA-seq data sets of four tissues and 14 dissected cells in C. elegans. For detailed information on the stage, tissue, and cell labels, please refer to Supplemental Table S2.
Figure 2.
Figure 2.
Approaches for comparing transcriptomes of samples. (A) Approach for comparing two biological samples within a species. A hypergeometric test is used to test whether the overlap in their associated genes is significant. (B) Approach for comparing two biological samples between two species. An approximate hypergeometric test is used to test the significance of the number of orthologous gene pairs in their associated genes.
Figure 3.
Figure 3.
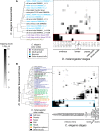
Comparison results of different developmental stages, tissues, and cell lines within D. melanogaster. More significant mapping scores are shown in darker color, corresponding to the scale showing –log10 transformed Bonferroni corrected P-values, which are calculated from the hypergeometric test in Figure 2A. (A) Stage comparison result. All are from mixed organisms with the exception that adults are separated into male and female that have the same three developmental time points (1, 5, and 30 d after eclosion). (B) Comparison of developmental stages with the three gene categories (maternal, maternal/zygotic, and zygotic) defined in Lott et al. (2011). (C) Tissue/cell line comparison result. The grouping of cell lines (yellow box), the mapping of cell lines and ovary tissues (red box), the grouping of head tissues (green box), and the grouping of digestive system tissues (orange box) are highlighted. (D) Comparison of developmental stages with tissues/cell lines, in which the red box marks the mapping of ovary tissues to early embryonic and female adult stages, and the cyan box marks the mapping of testes tissues to pupa and male adult stages. Hierarchical clustering was applied to order the tissues/cell lines in C and D. Tissues from similar organs and cell lines are marked with colors. For detailed information on the stage, tissue, and cell labels, please refer to Supplemental Table S2. Mapping score as in A and B.
Figure 3.
Figure 3.
Comparison results of different developmental stages, tissues, and cell lines within D. melanogaster. More significant mapping scores are shown in darker color, corresponding to the scale showing –log10 transformed Bonferroni corrected P-values, which are calculated from the hypergeometric test in Figure 2A. (A) Stage comparison result. All are from mixed organisms with the exception that adults are separated into male and female that have the same three developmental time points (1, 5, and 30 d after eclosion). (B) Comparison of developmental stages with the three gene categories (maternal, maternal/zygotic, and zygotic) defined in Lott et al. (2011). (C) Tissue/cell line comparison result. The grouping of cell lines (yellow box), the mapping of cell lines and ovary tissues (red box), the grouping of head tissues (green box), and the grouping of digestive system tissues (orange box) are highlighted. (D) Comparison of developmental stages with tissues/cell lines, in which the red box marks the mapping of ovary tissues to early embryonic and female adult stages, and the cyan box marks the mapping of testes tissues to pupa and male adult stages. Hierarchical clustering was applied to order the tissues/cell lines in C and D. Tissues from similar organs and cell lines are marked with colors. For detailed information on the stage, tissue, and cell labels, please refer to Supplemental Table S2. Mapping score as in A and B.
Figure 4.
Figure 4.
Comparison results of different developmental stages, tissues and dissected cells within C. elegans. Mapping scores shown in the heatmaps are –log10 transformed Bonferroni corrected P-values, which are calculated from the hypergeometric test in Figure 2A. (A) Stage comparison result, in which the three dauer stages are put on the right because they form an alternative developmental path in the worm life cycle. (B) Tissue/cell comparison result. (C) Comparison of developmental stages with tissues/cells, in which the red box marks the mappings of 4-cell embryos and adult gonad tissues to both embryonic and adult stages. Hierarchical clustering was applied to order the tissues/cells in B and C. Tissues and cells with similar origins are marked with the same color. For detailed information on the stage/tissue/cell labels, please refer to Supplemental Table S2.
Figure 5.
Figure 5.
Comparison results of different developmental stages between D. melanogaster and C. elegans. Mapping scores shown in the heatmaps are –log10 Bonferroni corrected P-values, which are calculated from the hypergeometric test in Figure 2B. (A) Overall comparison of stages between species. The orange and purple stair-step lines were found by maximizing the sum of mapping scores of the stage pairs they pass through, to emphasize the two parallel collinear mapping patterns observed between D. melanogaster and C. elegans developmental stages. The red, green, and cyan shades mark the three two-to-one fly-worm stage mapping columns 1, 2, and 3 (inset, right). (B) A cartoon summary of main comparison results. Every orange or purple line corresponds to an upper-left corner in the stair-step line of the same color in A. For detailed information on the stage labels, please refer to Supplemental Table S2. (The stage images were modified with permission from FlyMove [Weigmann et al. 2003] by Dr. Christian Klämbt and from WormAtlas [http://www.wormatlas.org] by Dr. David H. Hall and Dr. Zeynep F. Altun.)
Figure 6.
Figure 6.
Comparison results of different developmental stages, tissues, cell lines, and dissected cells between D. melanogaster and C. elegans. Mapping scores shown in the heatmaps are –log10 transformed Bonferroni corrected P-values, which are calculated from the hypergeometric test in Figure 2B. (A) Comparison between D. melanogaster developmental stages and C. elegans tissues/dissected cells. (B) Comparison between D. melanogaster tissues/cell lines and C. elegans developmental stages. (C) Comparison between D. melanogaster tissues/cell lines and C. elegans tissues/dissected cells. Hierarchical clustering was applied to order the D. melanogaster tissues/cell lines and C. elegans tissues/dissected cells in A, B, and C. Tissues/dissected cells with similar origins and cell lines are marked with colors. For detailed information on the stage/tissue/cell labels, please refer to Supplemental Table S2.
Figure 6.
Figure 6.
Comparison results of different developmental stages, tissues, cell lines, and dissected cells between D. melanogaster and C. elegans. Mapping scores shown in the heatmaps are –log10 transformed Bonferroni corrected P-values, which are calculated from the hypergeometric test in Figure 2B. (A) Comparison between D. melanogaster developmental stages and C. elegans tissues/dissected cells. (B) Comparison between D. melanogaster tissues/cell lines and C. elegans developmental stages. (C) Comparison between D. melanogaster tissues/cell lines and C. elegans tissues/dissected cells. Hierarchical clustering was applied to order the D. melanogaster tissues/cell lines and C. elegans tissues/dissected cells in A, B, and C. Tissues/dissected cells with similar origins and cell lines are marked with colors. For detailed information on the stage/tissue/cell labels, please refer to Supplemental Table S2.

References

    1. Adoutte A, Balavoine G, Lartillot N, Lespinet O, Prud’homme B, de Rosa R 2000. The new animal phylogeny: reliability and implications. Proc Natl Acad Sci 97: 4453–4456 - PMC - PubMed
    1. Aranguren ME, Bechhofer S, Lord P, Sattler U, Stevens R 2007. Understanding and using the meaning of statements in a bio-ontology: recasting the Gene Ontology in OWL. BMC Bioinformatics 8: 57. - PMC - PubMed
    1. Arbeitman MN, Furlong EE, Imam F, Johnson E, Null BH, Baker BS, Krasnow MA, Scott MP, Davis RW, White KP 2002. Gene expression during the life cycle of Drosophila melanogaster. Science 297: 2270–2275 - PubMed
    1. Ashburner M, Golic KG, Hawley RS 2005. Drosophila: a laboratory handbook. Cold Spring Harbor Laboratory Press, Cold Spring Harbor, NY
    1. Barberan-Soler S, Zahler AM 2008. Alternative splicing regulation during C. elegans development: splicing factors as regulated targets. PLoS Genet 4: e1000001. - PMC - PubMed

Publication types

MeSH terms

LinkOut - more resources